

Key Points
LDH, MCP-1, and IL-7 are independently associated with PFS in patients with aggressive NHL after CD19 CAR T-cell immunotherapy.
Higher intensity of cyclophosphamide and fludarabine lymphodepletion is associated with higher probability of a favorable cytokine profile.

Abstract
Factors associated with durable remission after CD19 chimeric antigen receptor (CAR)-modified T-cell immunotherapy for aggressive B-cell non-Hodgkin lymphoma (NHL) have not been identified. We report multivariable analyses of factors affecting response and progression-free survival (PFS) in patients with aggressive NHL treated with cyclophosphamide and fludarabine lymphodepletion followed by 2 × 10⁶ CD19-directed CAR T cells/kg. The best overall response rate was 51%, with 40% of patients achieving complete remission. The median PFS of patients with aggressive NHL who achieved complete remission was 20.0 months (median follow-up, 26.9 months). Multivariable analysis of clinical and treatment characteristics, serum biomarkers, and CAR T-cell manufacturing and pharmacokinetic data showed that a lower pre-lymphodepletion serum lactate dehydrogenase (LDH) level and a favorable cytokine profile, defined as serum day 0 monocyte chemoattractant protein-1 (MCP-1) and peak interleukin-7 (IL-7) concentrations above the median, were associated with better PFS. MCP-1 and IL-7 concentrations increased after lymphodepletion, and higher intensity of cyclophosphamide and fludarabine lymphodepletion was associated with higher probability of a favorable cytokine profile. PFS was superior in patients who received high-intensity lymphodepletion and achieved a favorable cytokine profile compared with those who received the same intensity of lymphodepletion without achieving a favorable cytokine profile. Even in high-risk patients with pre-lymphodepletion serum LDH levels above normal, a favorable cytokine profile after lymphodepletion was associated with a low risk of a PFS event. Strategies to augment the cytokine response to lymphodepletion could be tested in future studies of CD19 CAR T-cell immunotherapy for aggressive B-cell NHL. This trial was registered at www.clinicaltrials.gov as #NCT01865617.
Introduction
Lymphodepletion chemotherapy followed by infusion of T cells that are engineered to express a CD19-specific chimeric antigen receptor (CAR) is effective in a significant fraction of patients with relapsed/refractory (R/R) CD19+ B-cell malignancies. Two CD19-directed CAR-modified T-cell immunotherapies, axicabtagene ciloleucel and tisagenlecleucel, were approved by the US Food and Drug Administration (FDA) for the treatment of aggressive B-cell non-Hodgkin lymphoma (NHL) after eliciting high overall response rates (ORRs) of 82% and 52%, respectively, and complete remission (CR) rates of 58% and 40%, in pivotal trials.1,2 Response rates after treatment with CD19 CAR T cells manufactured by academic centers have been similarly impressive.3-5 Although durable CR without subsequent antitumor therapy has been observed in a subset of patients with aggressive NHL after CD19 CAR T-cell immunotherapy, the factors that are independently associated with long-term remissions have not been identified.4-6
We previously reported that immunotherapy with a defined composition of CD4+ and CD8+ CD19 CAR T cells produced high response rates in patients with R/R NHL, acute lymphoblastic leukemia, and chronic lymphocytic leukemia, and established a preferred regimen for patients with NHL that incorporated cyclophosphamide (Cy) and fludarabine (Flu) lymphodepletion followed by infusion of 2 × 10⁶ CD19 CAR T cells/kg.3,7,8 The potential toxicities and cost of CD19 CAR T-cell immunotherapy mandate efforts to identify factors affecting progression-free survival (PFS) to guide patient management and identify mechanisms of resistance and patients at high risk of relapse, which will be needed to rationally design future studies of consolidation or combination therapies. The present study reports the results of multivariable analyses of factors affecting response and PFS in patients with aggressive B-cell NHL treated with CD19 CAR T-cell immunotherapy.
Patients and methods
Study design and patient selection
We conducted a phase 1/2 open-label clinical trial (NCT01865617, www.clinicaltrials.gov) of lymphodepletion chemotherapy followed by infusion of T cells engineered to express a CD19-specific CAR in patients with R/R CD19+ B-cell malignancies.3,7,8 Patients with aggressive NHL were eligible if they had primary refractory disease after chemoimmunotherapy; R/R disease after at least 2 lines of therapy, including chemoimmunotherapy, and were not eligible for autologous hematopoietic cell transplantation (HCT); or had relapsed after HCT. The present article reports all patients with aggressive NHL in the trial who received lymphodepletion chemotherapy with a Cy/Flu-based regimen followed by infusion of 2 × 10⁶ CD19 CAR T cells/kg. The study was conducted according to the principles of the Declaration of Helsinki with informed consent and was approved by the Fred Hutchinson Cancer Research Center (FHCRC) Institutional Review Board.
Lymphodepletion chemotherapy and CD19 CAR T-cell manufacturing and infusion
CD19 CAR T-cell manufacturing from a leukapheresis product has been previously described.3,7 The CAR construct contained an FMC63-derived anti-CD19 single-chain variable fragment (scFv) and a 4-1BB costimulatory domain. A truncated human epidermal growth factor receptor (EGFRt) separated from the CAR by a ribosomal skip sequence allowed precise enumeration of CAR T cells by using flow cytometry.9 Bridging antitumor therapy was permitted for patients with rapid disease progression between leukapheresis and lymphodepletion. Patients received high- or low-intensity lymphodepletion chemotherapy with a Cy/Flu-based regimen (the high-intensity regimen included Cy 60 mg/kg; the low-intensity regimen included Cy ≤1500 mg/m2 or 30 mg/kg total dose) (supplemental Table 1, available on the Blood Web site) in 2 sequentially enrolled cohorts. Two to 4 days after completion of lymphodepletion, 2 × 10⁶ EGFRt+ CD19 CAR T cells/kg at a 1:1 ratio of CD4+:CD8+ CAR T cells were infused.
Clinical response, relapse, and toxicity assessment
Patients were monitored according to standard of care,10 with positron emission tomography and concurrent diagnostic-quality computed tomography scans before lymphodepletion chemotherapy and ∼4 weeks, 6 months, and 12 months after CAR T-cell infusion, as clinically indicated. Bone marrow aspiration and biopsy samples were obtained before lymphodepletion and ∼4 weeks after administration of CAR T cells from patients with marrow disease on initial staging, and as clinically indicated thereafter. Best responses in the absence of additional antitumor therapy were reported according to the Lugano criteria.11 Relapse and/or progression were defined according to clinical, radiological, and/or biopsy evaluations. Toxicities were graded by using the National Cancer Institute’s Common Toxicity Criteria for Adverse Events (version 4.03), with the exception of cytokine release syndrome (CRS), which was graded according to consensus criteria.12 Neurotoxicity was graded according to Common Toxicity Criteria for Adverse Events version 4.03, with modifications as previously described,13 and did not contribute to organ toxicity in CRS grading.
CAR T-cell enumeration and evaluation of serum cytokines
Blood samples were collected before lymphodepletion, on day 0 before CAR T-cell infusion, and at intervals after CAR T-cell infusion. Absolute CD4+ and CD8+ CAR T-cell counts were determined by multiplying the percentages of CD3+CD4+CD8–EGFRt+ and CD3+CD4–CD8+EGFRt+ events, respectively, in a viable CD45+ lymphocyte forward/side scatter gate by an absolute lymphocyte count performed on the same day. The number of copies of the CAR transgene/μg of DNA in the blood was determined by using quantitative polymerase chain reaction (qPCR) to detect the integrated Flap-EF1α sequence, with a lower limit of detection of 10 transgene copies/μg of DNA. Serum cytokine concentrations were evaluated by using the Luminex assay (Luminex Corporation, Austin, TX) according to the manufacturer’s instructions. The areas under the curve of CAR T-cell transgene copies and cytokine concentrations between time points were calculated by using a trapezoidal rule computational algorithm.14
Statistical analyses
Best response rates were reported with 95% confidence interval (CI) calculated by using the Clopper-Pearson method. PFS was defined as the time from CAR T-cell infusion to disease progression or death. PFS and overall survival (OS) were censored at last follow-up. Kaplan-Meier analyses were used to estimate PFS and OS (median, point estimates, and 95% CIs). Differences in PFS and OS between groups were assessed by using the log-rank test.15,16 Follow-up time was predicted by using a reverse Kaplan-Meier estimator (median and range).17 A univariate logistic regression was constructed to evaluate the association of a factor with a binary end point, and a univariate Cox regression was constructed to evaluate the association of a factor with PFS and/or OS.
Clinical and treatment characteristics, serum biomarkers, and CAR T-cell manufacturing and pharmacokinetic data encompassing 132 different factors were considered in multivariable analyses (supplemental Table 2). With limited sample size (n samples) and the potentially large number of factors in the model (p covariates), the regularized regression method, elastic net,18 was used to manage p > n and address multicollinearity between correlated covariates. Variables chosen by using the elastic net method were added to the final regression model. Multivariable logistic regression and multivariable Cox regression models were built to identify factors affecting CR and PFS, respectively. Data were analyzed by using R version 3.4.1 (R Foundation for Statistical Computing, Vienna, Austria) and RStudio version 1.0.153 (RStudio, Boston, MA). The kinetics of CAR T-cell counts and serum cytokine concentrations were analyzed by using local polynomial regression curve fitting.19 Additional statistical methods are described in the figure legends.
Results
Patient characteristics
Sixty-five patients with aggressive B-cell NHL received lymphodepletion and at least 1 CD19 CAR T-cell infusion. Forty-eight patients (median age, 58.5 years; interquartile range, 52-63 years) underwent a Cy/Flu lymphodepletion regimen followed by infusion of 2 × 10⁶ EGFRt+ cells/kg, the preferred approach established during phase 1 studies,3 and are included in this study (supplemental Figure 1). These patients had diffuse large B-cell lymphoma (DLBCL; not otherwise specified or transformed from indolent histology), high-grade B-cell lymphoma with MYC and BCL2 and/or BCL6 rearrangements, and other aggressive histologic subtypes. They had received a median of 4 previous treatment regimens (range, 1-11), and 48% (n = 23) had failed previous autologous (n = 16), allogeneic (n = 4), or both autologous and allogeneic (n = 3) HCT. Between leukapheresis and lymphodepletion, 12 (25%) of 48 patients required systemic bridging therapy to control disease progression, consisting of intensive chemotherapy (n = 7), dexamethasone ≥20 mg or an equivalent corticosteroid dose (n = 9), or combinations of monoclonal antibody, immunomodulatory, and targeted small molecule drugs (n = 2). At staging performed before lymphodepletion, 98% had stage III or IV disease, 90% had extranodal involvement, 67% had elevated lactate dehydrogenase (LDH) levels, and 85% had an intermediate or high International Prognostic Index (IPI) score (Table 1).
Patient characteristics
| Characteristic | All patients |
|---|---|
| No. of patients | 48 |
| Disease type, n (%) | |
| DLBCL* | 28 (58) |
| Not otherwise specified | 18 (37) |
| Transformed from indolent | 10 (21) |
| HGBL-DH/TH | 8 (17) |
| Other aggressive† | 5 (11) |
| Mantle cell lymphoma‡ | 6 (12) |
| Follicular lymphoma | 1 (2)§ |
| Age | |
| Median (interquartile range), y | 58.5 (52-63) |
| ≥65 y, n (%) | 8 (17) |
| Male sex, n (%) | 35 (73) |
| ECOG performance status score ≥1, n (%) | 20 (42) |
| LDH, pre-lymphodepletion above the ULN, n (%) | 32 (67) |
| Disease stage, n (%) | |
| I or II | 1 (2) |
| III or IV | 47 (98) |
| Extranodal disease, n (%) | |
| Yes | 43 (90) |
| No | 5 (10) |
| IPI score, n (%)|| | |
| 0 or 1 | 7 (15) |
| 2 | 16 (33) |
| 3 or 4 | 25 (52) |
| Bulky disease (≥10 cm)¶ | |
| Yes | 8 (17) |
| No | 40 (83) |
| Tumor cross-sectional area# | |
| Median (interquartile range), mm2 | 3926 (2127-6769) |
| Previous therapies | |
| Median (interquartile range) | 4 (3-5) |
| Range | 1-11 |
| Four or more previous lines of therapy, n (%) | 34 (71) |
| Previous autologous HCT, n (%) | |
| Yes | 19 (40) |
| No | 29 (60) |
| Previous allogeneic HCT, n (%) | |
| Yes | 7 (15) |
| No | 41 (85) |
| Bridging therapy between leukapheresis and lymphodepletion, n (%) | |
| Intensive chemotherapy** | 7 (15) |
| High-dose corticosteroid†† | 9 (19) |
| Other‡‡ | 2 (4) |
| Any therapy between leukapheresis and lymphodepletion | 12 (25) |
ECOG, Eastern Cooperative Oncology Group; HGBL-DH/TH, high-grade B-cell lymphoma with MYC and BCL2 and/or BCL6 rearrangements; ULN, upper limit of normal.
MYC rearrangement not available for 8 patients.
Two patients with Burkitt lymphoma, 1 with T-cell/histiocyte-rich large B-cell lymphoma, 1 with primary cutaneous diffuse large B-cell lymphoma/leg type, and 1 with high-grade B-cell lymphoma/not otherwise specified.
Pleomorphic morphology and/or Ki-67 >30%.
Patient with grade 3B follicular lymphoma per 2017 World Health Organization Classification.35
Scores on the IPI include low risk (0 or 1 point), low to intermediate risk (2 points), high to intermediate risk (3 points), and high risk (4 or 5 points).
Maximum tumor diameter ≥10 cm.36
Sum of the product of the perpendicular diameters of up to 6 target measurable nodes and extranodal sites.11
Intensive chemotherapy (rituximab plus cyclophosphamide, doxorubicin, vincristine, and prednisone or equivalent).
More than one dose of dexamethasone 20 mg or equivalent not as part of a chemotherapy regimen.
Monoclonal antibody, immunomodulatory, and/or targeted small molecule drugs.
Durable PFS in patients with aggressive NHL achieving CR
Forty-seven of 48 patients were evaluated for response. One patient with evidence of response had incomplete restaging and was not included in the response analysis. The best ORR without additional therapy after CAR T-cell infusion was 51% (95% CI, 36-66), with 40% of patients achieving CR (95% CI, 27-56). The median time to best response was 1.0 month (range, 0.9-6.2 months). Four patients with partial response (n = 2) or stable disease (n = 2) on initial restaging who did not receive additional antitumor therapy subsequently converted to CR a median of 1.9 months (range, 1.1-5.0 months) after the first response assessment. Among the aggressive histology subtypes, patients with DLBCL (not otherwise specified and transformed from indolent) had ORR and CR rates of 50% (95% CI, 33-67) and 43% (95% CI, 25-63), respectively, whereas patients with confirmed high-grade B-cell lymphoma with MYC and BCL2 and/or BCL6 rearrangements had ORR and CR rates of 38% (95% CI, 10-74) and 25% (95% CI, 4-64). At a median follow-up of 26.9 months (range, 2.5-32.4 months), the median PFS was 20.0 months (95% CI, 9.2-not reached) for those who achieved CR and 2.9 months (95% CI, 1.7-6.6 months) for all patients (Figure 1A). The median OS was 28.9 months (95% CI, 24.2-not reached) for those who achieved CR and 11.4 months (95% CI, 7.0-28.9 months) for all patients (Figure 1B). Among patients who achieved CR, the estimated 24-month probabilities of PFS and OS were 46% (95% CI, 28-76) and 72% (95% CI, 54-96). PFS and OS were similar for patients who would (n = 36) or would not (n = 12) have met the FDA-approved histologic indications for CD19 CAR T-cell immunotherapy (supplemental Figure 2). Most relapses occurred in the first year after CAR T-cell infusion; beyond 12 months, only 1 patient relapsed. For the 16 patients with available biopsy samples at the time of R/R disease, 10 (62%) had CD19-positive disease (8 by flow cytometry [FCM], 1 by immunohistochemistry, and 1 by both methods) and 6 (38%) had CD19-negative disease (5 by FCM and 1 by FCM and immunohistochemistry).
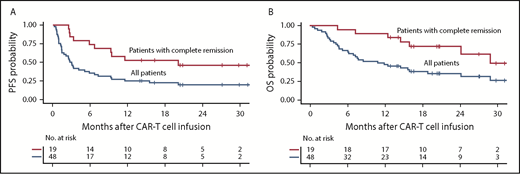
PFS and OS in patients with aggressive NHL after CD19 CAR T-cell immunotherapy. Kaplan-Meier estimates of PFS (A) and OS (B) in patients with aggressive NHL who achieved CR (red) and in all patients (blue). The numbers of patients at risk at 6-month intervals are indicated.
PFS and OS in patients with aggressive NHL after CD19 CAR T-cell immunotherapy. Kaplan-Meier estimates of PFS (A) and OS (B) in patients with aggressive NHL who achieved CR (red) and in all patients (blue). The numbers of patients at risk at 6-month intervals are indicated.
Multivariable analysis of factors associated with CR in patients with aggressive NHL
Because CR after CAR T-cell infusion was associated with better PFS and OS, we investigated factors affecting the probability of CR. We considered that a multivariable analysis using the elastic net method for selection of variables, including clinical and treatment characteristics, serum biomarkers, and CAR T-cell manufacturing and pharmacokinetic data, might provide insight into key factors that affect the probability of CR. This analysis established that lower pre-lymphodepletion serum LDH level (hazard ratio [HR], 0.24 [95% CI, 0.08-0.53] per 100 U/L increment; P = .003) and greater increase in serum monocyte chemoattractant protein-1 (MCP-1) concentration from before lymphodepletion to the day of CAR T-cell infusion (MCP-1Δ; HR, 1.36 [95% CI, 1.12-1.79] per 50 pg/mL increment; P = .007) were independently associated with development of CR. Correlations between pre-lymphodepletion serum LDH, IPI, and tumor burden (sum of the product of the perpendicular diameters of ≤6 index lesions) suggested that high pre-lymphodepletion LDH level reflected more aggressive disease (supplemental Figure 3). The data indicate that the probability of CR after CAR T-cell immunotherapy is better in patients with less aggressive disease before treatment and higher MCP-1 increase in response to lymphodepletion.
Multivariable analysis of factors affecting PFS in aggressive NHL
Multivariable analyses of factors associated with PFS after CD19 CAR T-cell immunotherapy in aggressive NHL have not been reported. In univariate analysis of clinical and treatment characteristics (supplemental Table 3), the probability of PFS was higher in patients with lower serum LDH levels, IPI, sum of the product of the perpendicular diameters of ≤6 index lesions, and abnormal B-cell burden in the blood and marrow before lymphodepletion, lower cumulative corticosteroid dose within 6 weeks before leukapheresis, no requirement for corticosteroid therapy after leukapheresis, and use of high-intensity Cy/Flu lymphodepletion. The concentrations of distinct cytokines and higher in vivo CAR T-cell expansion in the blood measured either by the peak of CD8+ CAR-T cells/μL (HR, 0.70 [95% CI, 0.50-0.97] for each log10 cells/μL increment; P = .03) or CAR transgene copies/μg of DNA (HR, 0.69 [95% CI, 0.47-1.01] for each log10 copies/μg of DNA increment; P = .05) were also associated with better PFS.
Multivariable Cox regression analysis after elastic net variable selection of clinical and treatment characteristics, serum biomarkers, and CAR T-cell manufacturing and pharmacokinetic data showed that lower pre-lymphodepletion serum LDH level (Figure 2A), along with higher serum MCP-1 concentration on the day of CAR T-cell infusion (day 0) (Figure 2B) and higher serum interleukin-7 (IL-7) peak (median day 4) after CAR T-cell infusion (Figure 2C), were associated with better PFS (Table 2). The combined effect of low LDH and high MCP-1 (Figure 2D) or IL-7 (Figure 2E) concentrations resulted in reduced hazard of a PFS event. Similar findings were obtained when the model was adjusted to account for new treatment after CAR T-cell infusion as a time-dependent covariate (supplemental Table 4), indicating that subsequent therapy did not significantly affect PFS. The same variables were identified when the analysis was restricted to patients who would have met the FDA-approved histologic indications for CD19 CAR T-cell immunotherapy (n = 36).
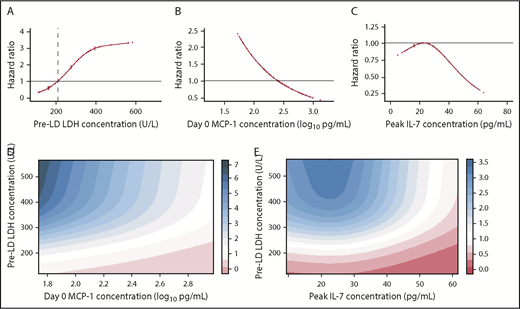
Serum biomarkers associated with PFS in patients with aggressive NHL. (A) The association of pre-lymphodepletion (pre-LD) serum LDH level with the hazard of a PFS event, adjusting for day 0 MCP-1 and peak IL-7 concentrations. The vertical dashed line shows the upper limit of normal LDH. (B) The association of serum day 0 MCP-1 with the hazard of a PFS event, adjusting for pre-LD LDH level and peak IL-7 concentration. (C) The association of serum peak IL-7 concentration with the hazard of a PFS event, adjusting for pre-LD LDH level and day 0 MCP-1 concentration. (D) Estimated combined effect of pre-LD LDH level and day 0 MCP-1 concentration on hazard of a PFS event. (E) Estimated combined effect of pre-LD LDH level and peak IL-7 concentration on hazard of a PFS event. The HRs are shown in the colored bars to the right of each figure in panels D-E. Serum biomarkers were modeled as restricted cubic splines with 3 knots.
Serum biomarkers associated with PFS in patients with aggressive NHL. (A) The association of pre-lymphodepletion (pre-LD) serum LDH level with the hazard of a PFS event, adjusting for day 0 MCP-1 and peak IL-7 concentrations. The vertical dashed line shows the upper limit of normal LDH. (B) The association of serum day 0 MCP-1 with the hazard of a PFS event, adjusting for pre-LD LDH level and peak IL-7 concentration. (C) The association of serum peak IL-7 concentration with the hazard of a PFS event, adjusting for pre-LD LDH level and day 0 MCP-1 concentration. (D) Estimated combined effect of pre-LD LDH level and day 0 MCP-1 concentration on hazard of a PFS event. (E) Estimated combined effect of pre-LD LDH level and peak IL-7 concentration on hazard of a PFS event. The HRs are shown in the colored bars to the right of each figure in panels D-E. Serum biomarkers were modeled as restricted cubic splines with 3 knots.
Factors affecting PFS in patients with aggressive NHL
| Variable | Univariate* | Multivariable† | ||
|---|---|---|---|---|
| HR (95% CI) | P | HR (95% CI) | P | |
| LDH, pre-lymphodepletion‡ | 1.24 (1.04-1.47) | .02 | 1.37 (1.14-1.63) | .0006 |
| MCP-1, day 0 (pre-CAR T-cell infusion)§ | 0.25 (0.10-0.60) | .002 | 0.29 (0.09-0.90) | .03 |
| IL-7, peak|| | 0.84 (0.74-0.95) | .01 | 0.89 (0.77-1.04) | .14 |
Univariate Cox regression model; variables chosen for the final multivariable model are presented (complete univariate results are available in supplemental Table 2).
Cox regression model using elastic net was performed to select variables associated with PFS, in which log10 values were used to transform data as appropriate, with 0.001 substituting for values of 0.
Per 100 U/L increment.
Per log10 pg/mL serum concentration increment.
Per 5 pg/mL serum concentration increment.
The factors associated with PFS in patients who have achieved CR may differ from those identified before the antitumor response is known. We therefore performed a subgroup analysis of patients with aggressive NHL who achieved CR after CAR T-cell immunotherapy (n = 19), testing whether pre-lymphodepletion LDH, day 0 MCP-1, and peak IL-7 concentrations affected PFS. Despite the limited sample size, a higher serum IL-7 peak after CAR T-cell infusion, but not pre-lymphodepletion LDH and day 0 MCP-1 concentrations, was significantly associated with better PFS in patients who had already achieved CR (Table 3). Patients who achieved CR and had a peak IL-7 concentration after CAR T-cell infusion above the median for all patients (peak IL-7 median, 23.4 pg/mL) had better survival than those who had a peak IL-7 concentration below or equal to the median, with 24-month probabilities of PFS and OS of 62% (95% CI, 39-100) and 91% (95% CI, 75-100), respectively (median follow-up, 26.9 months; range, 2.5-32.4 months) (Figure 3A-B). Among patients who achieved CR, those who remained in remission had, on average, higher serum IL-7 concentrations in the first 30 days after CAR T-cell infusion (Figure 3C).
Multivariable model for factors affecting PFS in patients with aggressive NHL who achieved CR
| Variable | HR | 95% CI | P |
|---|---|---|---|
| LDH, pre-lymphodepletion* | 1.26 | 0.67-2.38 | .47 |
| MCP-1, day 0 (before CAR T-cell infusion)† | 1.13 | 0.21-6.26 | .89 |
| IL-7, peak‡ | 0.70 | 0.49-1.00 | .05 |
| Variable | HR | 95% CI | P |
|---|---|---|---|
| LDH, pre-lymphodepletion* | 1.26 | 0.67-2.38 | .47 |
| MCP-1, day 0 (before CAR T-cell infusion)† | 1.13 | 0.21-6.26 | .89 |
| IL-7, peak‡ | 0.70 | 0.49-1.00 | .05 |
Cox regression model was performed to assess the association between PFS and the 3 variables of interest, in which log10 values were used to transform data as appropriate, with 0.001 substituting for values of 0.
Per 100 U/L increment.
Per log10 pg/mL serum concentration increment.
Per 5 pg/mL serum concentration increment.
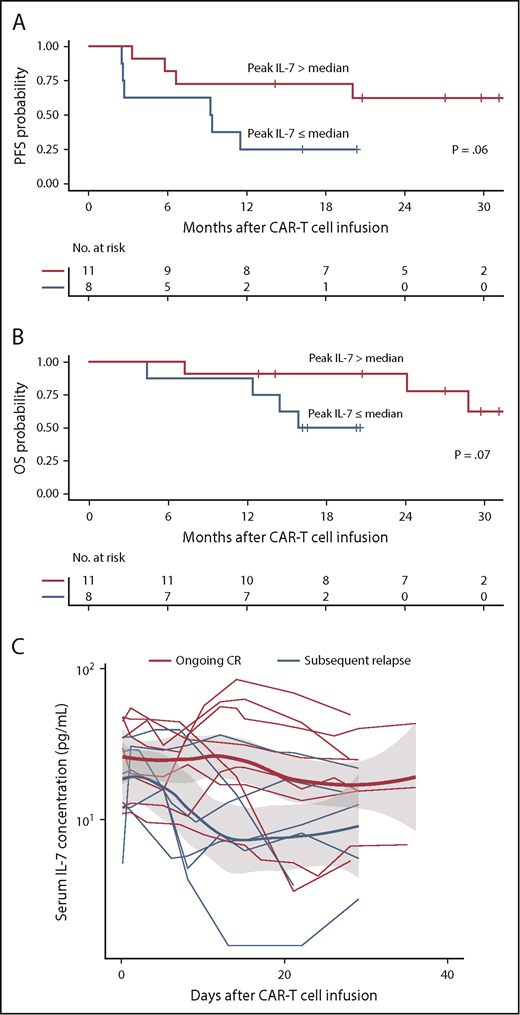
Superior PFS and OS in patients with aggressive NHL who achieved CR and had high peak IL-7 concentrations. Kaplan-Meier estimates of PFS (A) and OS (B) in patients with aggressive NHL who achieved CR and had serum peak IL-7 concentration above the median (red) compared with those who had serum peak IL-7 concentration below or equal to the median (blue). The numbers of patients at risk at 6-month intervals are indicated. Log-rank tests were used to compare between-group differences in survival probabilities. (C) Serum IL-7 concentrations in patients who remained in CR (red) and in those who subsequently relapsed (blue; P = .05 for the difference in the IL-7 area under the curve from peak to day 28 between the groups). Adjusted P values were calculated by using the Wilcoxon rank-sum test.
Superior PFS and OS in patients with aggressive NHL who achieved CR and had high peak IL-7 concentrations. Kaplan-Meier estimates of PFS (A) and OS (B) in patients with aggressive NHL who achieved CR and had serum peak IL-7 concentration above the median (red) compared with those who had serum peak IL-7 concentration below or equal to the median (blue). The numbers of patients at risk at 6-month intervals are indicated. Log-rank tests were used to compare between-group differences in survival probabilities. (C) Serum IL-7 concentrations in patients who remained in CR (red) and in those who subsequently relapsed (blue; P = .05 for the difference in the IL-7 area under the curve from peak to day 28 between the groups). Adjusted P values were calculated by using the Wilcoxon rank-sum test.
Cytokines associated with PFS in aggressive NHL are increased by lymphodepletion
The cytokines that we identified as being associated with CR and/or PFS in aggressive NHL might be influenced by bridging or lymphodepletion chemotherapy. Before lymphodepletion, serum MCP-1 and IL-7 concentrations were similar between those who received or did not receive bridging therapy to control disease progression between leukapheresis and lymphodepletion (supplemental Figure 4A-B), suggesting that bridging chemotherapy did not significantly affect pre-lymphodepletion cytokine concentrations. Consistent with the effects of lymphodepletion, serum MCP-1 and IL-7 concentrations were higher on the day of CAR T-cell infusion compared with their respective levels before lymphodepletion (Figure 4A-B).3,4,20
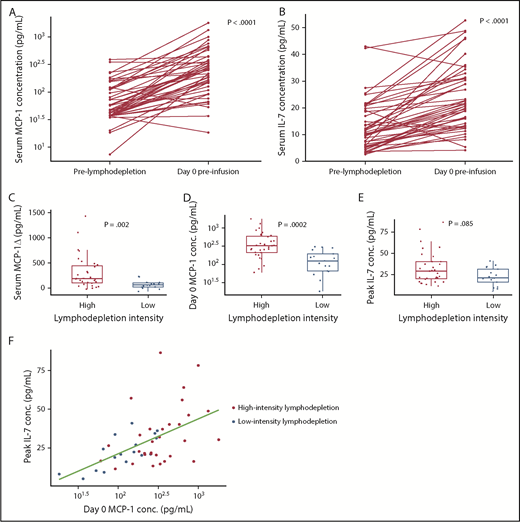
Higher serum MCP-1 and IL-7 concentrations in patients with aggressive NHL who received more intensive lymphodepletion. Serum day 0 MCP-1 (A) and day 0 IL-7 (B) increase after lymphodepletion. Serum cytokine concentrations before lymphodepletion and on day 0 before CAR T-cell infusion for each patient are connected. P values comparing cytokine concentrations before lymphodepletion and on day 0 before CAR T-cell infusion were calculated by using the Wilcoxon rank-sum test. (C) The change in serum MCP-1 concentration between the pre-lymphodepletion and day 0 time points in patients who received high-intensity Cy/Flu lymphodepletion (red) and in those who received low-intensity Cy/Flu lymphodepletion (blue) are shown. Serum day 0 MCP-1 (D) and peak IL-7 (E) concentrations in patients who received high-intensity Cy/Flu lymphodepletion (red) and in those who received low-intensity Cy/Flu lymphodepletion (blue). Each point in panels C-E represents data from a single patient. Box and whisker plots show the median (bar) and interquartile range (box). Adjusted P values were calculated by using the Wilcoxon rank-sum test. (F) Serum day 0 MCP-1 and peak IL-7 concentrations according to lymphodepletion intensity (Spearman correlation r = 0.52; P = .0001). Each point represents data from a single patient.
Higher serum MCP-1 and IL-7 concentrations in patients with aggressive NHL who received more intensive lymphodepletion. Serum day 0 MCP-1 (A) and day 0 IL-7 (B) increase after lymphodepletion. Serum cytokine concentrations before lymphodepletion and on day 0 before CAR T-cell infusion for each patient are connected. P values comparing cytokine concentrations before lymphodepletion and on day 0 before CAR T-cell infusion were calculated by using the Wilcoxon rank-sum test. (C) The change in serum MCP-1 concentration between the pre-lymphodepletion and day 0 time points in patients who received high-intensity Cy/Flu lymphodepletion (red) and in those who received low-intensity Cy/Flu lymphodepletion (blue) are shown. Serum day 0 MCP-1 (D) and peak IL-7 (E) concentrations in patients who received high-intensity Cy/Flu lymphodepletion (red) and in those who received low-intensity Cy/Flu lymphodepletion (blue). Each point in panels C-E represents data from a single patient. Box and whisker plots show the median (bar) and interquartile range (box). Adjusted P values were calculated by using the Wilcoxon rank-sum test. (F) Serum day 0 MCP-1 and peak IL-7 concentrations according to lymphodepletion intensity (Spearman correlation r = 0.52; P = .0001). Each point represents data from a single patient.
We then investigated whether the intensity of Cy/Flu lymphodepletion affected serum MCP-1 and IL-7 concentrations and found that, compared with patients who received low-intensity Cy/Flu lymphodepletion, those who received high-intensity Cy/Flu lymphodepletion had a greater increase in serum MCP-1 (Figure 4C), but not IL-7, concentration between the pre-lymphodepletion and day 0 time points. Both serum day 0 MCP-1 and peak IL-7 concentrations were higher after high-intensity lymphodepletion compared with low-intensity lymphodepletion (Figure 4D-F). Patients who received high-intensity lymphodepletion also had higher CAR T-cell peak counts compared with those who received low-intensity lymphodepletion, as did those with day 0 MCP-1 concentrations above the median compared with below or equal to the median (day 0 MCP-1 median, 253.6 pg/mL) (Figure 5A-B). Cox regression analysis showed that patients in CR with >1000 copies of the CAR transgene/μg DNA in blood on day 28 after infusion had a higher probability of remaining progression-free (Figure 5C). We observed no correlation between peak IL-7 concentration and CAR T-cell counts. We observed no differences in the incidences of grade 3 or higher CRS or grade 1 or higher neurotoxicity in patients who received high-intensity compared with low-intensity lymphodepletion; however, grade 1 or higher CRS was increased after high-intensity lymphodepletion (odds ratio, 5.87; 95% CI, 1.6-21.5; P = .007). The incidence and severity of CRS and neurotoxicity were not different in patients with day 0 MCP-1 and peak IL-7 concentrations above compared with those with one or both levels below or equal to their respective medians. Patients who received high-intensity lymphodepletion compared with low-intensity lymphodepletion had similar incidences of grade 3 or higher anemia, neutropenia, and thrombocytopenia within the first 28 days after infusion or thereafter.
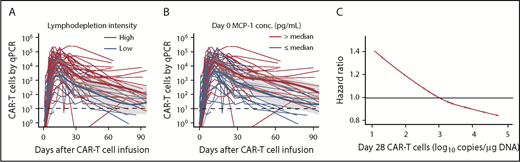
Higher CAR T-cell counts in patients with aggressive NHL who received high-intensity lymphodepletion or had high serum MCP-1 concentration. CAR T-cell copies/μg of DNA by qPCR in patients who received high-intensity Cy/Flu lymphodepletion (red) and in those who received low-intensity Cy/Flu lymphodepletion (blue; P = .0005 for the difference in the peak of CAR T cells between the groups) (A); and in patients with serum day 0 MCP-1 concentration above the median (red) or below or equal to the median (blue; P = .03 for the difference in the peak of CAR T cells between the groups) (B). Each thin line in panels A-B represents a single patient; bold lines represent the averaged data using local polynomial regression curve fitting approximation, with the standard error in gray. Adjusted P values were calculated by using the Wilcoxon rank-sum test. (C) Association of day 28 CAR T-cell counts by qPCR (log10 copies/μg DNA) and the hazard of PFS event using a restricted cubic spline with 3 knots. Tick marks represent data from individual patients.
Higher CAR T-cell counts in patients with aggressive NHL who received high-intensity lymphodepletion or had high serum MCP-1 concentration. CAR T-cell copies/μg of DNA by qPCR in patients who received high-intensity Cy/Flu lymphodepletion (red) and in those who received low-intensity Cy/Flu lymphodepletion (blue; P = .0005 for the difference in the peak of CAR T cells between the groups) (A); and in patients with serum day 0 MCP-1 concentration above the median (red) or below or equal to the median (blue; P = .03 for the difference in the peak of CAR T cells between the groups) (B). Each thin line in panels A-B represents a single patient; bold lines represent the averaged data using local polynomial regression curve fitting approximation, with the standard error in gray. Adjusted P values were calculated by using the Wilcoxon rank-sum test. (C) Association of day 28 CAR T-cell counts by qPCR (log10 copies/μg DNA) and the hazard of PFS event using a restricted cubic spline with 3 knots. Tick marks represent data from individual patients.
We observed a correlation between the serum day 0 MCP-1 and peak IL-7 concentrations, and established that there was variation in the levels of these cytokines within the subsets of patients who received high- or low-intensity lymphodepletion (Figure 4F). Although many patients who received high-intensity lymphodepletion had serum day 0 MCP-1 and/or peak IL-7 concentrations above the levels achieved by those who received low-intensity lymphodepletion, a subset of recipients of high-intensity lymphodepletion had day 0 MCP-1 and peak IL-7 concentrations that were no higher than those who received low-intensity lymphodepletion. These data show that the median levels of cytokines identified in multivariable analyses to be associated with CR and/or PFS increase after lymphodepletion and are higher in patients who receive high-intensity lymphodepletion; however, not all patients who receive high-intensity lymphodepletion develop favorable MCP-1 and IL-7 cytokine profiles.
Cytokine concentrations after lymphodepletion are better associated with the probability of PFS than the intensity of Cy/Flu lymphodepletion
Patients with a favorable cytokine profile, defined as day 0 MCP-1 and peak IL-7 concentrations above their respective medians (n = 16), had superior PFS compared with those with one or both cytokine concentrations below or equal to the median (Figure 6A). Superior PFS was also observed in patients who received high-intensity lymphodepletion compared with low-intensity lymphodepletion; however, the effect of lymphodepletion intensity on PFS was marginal (Figure 6B), consistent with our multivariable model, which showed that, unlike a favorable cytokine profile, lymphodepletion intensity was not independently associated with PFS.
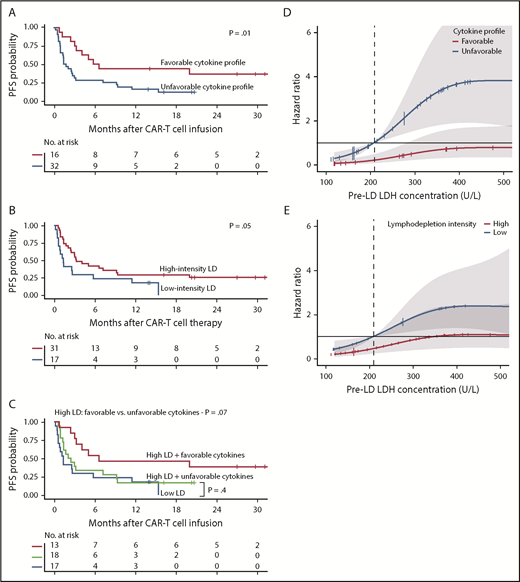
Impact of serum MCP-1 and IL-7 concentrations and lymphodepletion intensity on PFS. (A) Kaplan-Meier estimates of PFS according to patients with a favorable cytokine profile (serum day 0 MCP-1 and peak IL-7 concentrations above the median; red) compared with those with an unfavorable cytokine profile (serum day 0 MCP-1 and/or peak IL-7 concentrations below or equal to the median; blue). (B) Kaplan-Meier estimates of PFS in patients who received high-intensity lymphodepletion (LD; red) compared with those who received low-intensity lymphodepletion (blue). (C) Kaplan-Meier estimates of PFS in patients who received high-intensity lymphodepletion and did or did not achieve a favorable cytokine profile (day 0 MCP-1 and peak IL-7 concentrations above the median), and in those who received low-intensity lymphodepletion. (A-C) The numbers of patients at risk at 6-month intervals are indicated. Log-rank tests were used to compare between-group differences in survival probabilities. (D) Association of favorable (red) or unfavorable (blue) cytokine profile and the hazard of a PFS event according to pre-lymphodepletion serum LDH level, with 95% CI depicted in gray. Cytokines were modeled as restricted cubic splines with 3 knots. The horizontal line indicates the HR of a PFS event in the whole cohort. (E) Association of high-intensity (red) or low-intensity (blue) lymphodepletion and the hazard of a PFS event according to pre-lymphodepletion serum LDH level, with 95% CIs depicted in gray. The horizontal line indicates the HR of a PFS event in the whole cohort.
Impact of serum MCP-1 and IL-7 concentrations and lymphodepletion intensity on PFS. (A) Kaplan-Meier estimates of PFS according to patients with a favorable cytokine profile (serum day 0 MCP-1 and peak IL-7 concentrations above the median; red) compared with those with an unfavorable cytokine profile (serum day 0 MCP-1 and/or peak IL-7 concentrations below or equal to the median; blue). (B) Kaplan-Meier estimates of PFS in patients who received high-intensity lymphodepletion (LD; red) compared with those who received low-intensity lymphodepletion (blue). (C) Kaplan-Meier estimates of PFS in patients who received high-intensity lymphodepletion and did or did not achieve a favorable cytokine profile (day 0 MCP-1 and peak IL-7 concentrations above the median), and in those who received low-intensity lymphodepletion. (A-C) The numbers of patients at risk at 6-month intervals are indicated. Log-rank tests were used to compare between-group differences in survival probabilities. (D) Association of favorable (red) or unfavorable (blue) cytokine profile and the hazard of a PFS event according to pre-lymphodepletion serum LDH level, with 95% CI depicted in gray. Cytokines were modeled as restricted cubic splines with 3 knots. The horizontal line indicates the HR of a PFS event in the whole cohort. (E) Association of high-intensity (red) or low-intensity (blue) lymphodepletion and the hazard of a PFS event according to pre-lymphodepletion serum LDH level, with 95% CIs depicted in gray. The horizontal line indicates the HR of a PFS event in the whole cohort.
The observation that a subset of patients who received high-intensity lymphodepletion failed to develop a favorable cytokine profile (18 of 31 [58%]) suggested that the host biological response to lymphodepletion chemotherapy could be more closely associated with CR and PFS than the lymphodepletion intensity. Patients who received high-intensity lymphodepletion and had a favorable cytokine profile had a higher CR rate (8 of 13 [62%]) compared with those who received high-intensity lymphodepletion and failed to develop a favorable cytokine profile (6 of 18 [33%]) or those who received low-intensity lymphodepletion (5 of 16 [31%]). The data show a higher probability of CR in those who received high-intensity lymphodepletion and had a favorable cytokine profile compared with the remaining patients (OR, 3.35; 95% CI, 0.91-13.5; P = .07). Because only 3 (18%) of 17 patients who received low-intensity lymphodepletion developed a favorable cytokine profile, we examined the effect of the cytokine profile on PFS in patients who received high-intensity lymphodepletion. In such patients, achieving a favorable cytokine profile improved PFS (Figure 6C). The PFS of patients who received high-intensity lymphodepletion and had an unfavorable cytokine profile was similar to that of those who received low-intensity lymphodepletion. These data indicate that the benefit of high-intensity lymphodepletion may be primarily observed in patients who achieve a favorable cytokine profile.
We investigated the impact of a favorable or an unfavorable cytokine profile on PFS in patients with different pre-lymphodepletion LDH concentrations. A pre-lymphodepletion LDH level above normal was associated with short PFS (supplemental Figure 5A). However, even in high-risk patients with LDH levels above normal, a favorable cytokine profile after lymphodepletion was associated with a low risk of a PFS event (Figures 2D-E and 6D; supplemental Figure 5B). In contrast, regardless of the pre-lymphodepletion LDH concentration, high-intensity lymphodepletion did not significantly decrease the risk of a PFS event compared with low-intensity lymphodepletion (Figure 6E). These findings show that higher serum day 0 MCP-1 and peak IL-7 concentrations, reflecting a more favorable cytokine profile achieved by a subset of patients after high-intensity lymphodepletion, are associated with better PFS after treatment of patients with aggressive NHL with CD19 CAR T cells.
Discussion
We studied response and long-term outcomes in adult patients with CD19+ aggressive B-cell NHL treated with Cy/Flu lymphodepletion chemotherapy and 2 × 10⁶ CD19 CAR T cells/kg. Forty percent of these patients achieved CR, which was associated with prolonged PFS. It is noteworthy that our study included patients with highly aggressive histologic subtypes such as Burkitt lymphoma, who would not have been eligible for the pivotal axicabtagene ciloleucel and tisagenlecleucel trials.1,2 Furthermore, patients in our study who required systemic bridging chemotherapy to control aggressive disease would have been ineligible for the pivotal axicabtagene ciloleucel study.1
Multivariable analysis of clinical and treatment characteristics, serum biomarkers, and CAR T-cell manufacturing and pharmacokinetic data showed that a lower pre-lymphodepletion LDH level and greater increase in MCP-1 concentration from lymphodepletion to day of CAR T-cell infusion were associated with higher probability of CR. We found that MCP-1 and IL-7 concentrations increased after lymphodepletion, consistent with a study that additionally reported an increase in serum IL-15.4 In univariate analysis, they found an association of higher serum IL-15 concentration with response. Lower pre-lymphodepletion LDH level was also associated with superior PFS, along with higher day 0 MCP-1 and peak IL-7 concentrations. The association of high LDH level before lymphodepletion with short PFS is consistent with worse outcomes in patients with more aggressive and extensive disease. Although a high LDH level has been associated with poor prognosis in DLBCL and other B-cell lymphomas,21,22 and may reflect proliferative activity and/or high tumor burden, there is also evidence that it may be associated with a more immunosuppressive tumor microenvironment that could inhibit CAR T-cell function.23-26 The absence of independent associations between PFS and the number or proximity of previous therapies before leukapheresis suggests that the poor PFS in patients with high LDH levels is not solely due to the effects of previous chemotherapy on T-cell function; however, a contribution from this mechanism cannot be excluded.
The mechanisms by which greater MCP-1Δ, day 0 MCP-1, and peak IL-7 concentrations are associated with better and/or more durable antitumor response were not determined in this study and remain speculative. MCP-1 could contribute to antitumor efficacy, for example, through enhancement of T-cell trafficking or recruitment of innate immune cells into the tumor microenvironment.27,28 The association of high peak MCP-1 concentration with toxicity in previous studies20,29 suggests that high MCP-1 concentrations may in some way promote CAR T-cell expansion or effector function, which could contribute to better efficacy, or may serve as a biomarker for CAR T-cell activity. It is notable that a high peak IL-7 concentration after CAR T-cell infusion was the strongest predictor of ongoing remission and better PFS in patients with aggressive NHL who had already achieved CR. In light of previous studies showing that IL-7 contributes to T-cell effector function, homeostatic proliferation, and survival,30-33 as well as enhanced efficacy of adoptive T-cell therapy,34 these findings suggest that supplementing IL-7 in future trials may augment CAR T-cell–mediated antitumor activity. Additional studies are needed to confirm our findings and characterize the mechanisms by which MCP-1 and IL-7 are associated with response.
The intensity of lymphodepletion contributed to the establishment of a favorable cytokine profile, but not all patients who received high-intensity lymphodepletion developed high day 0 MCP-1 and peak IL-7 concentrations. Furthermore, the benefit of a favorable cytokine profile in prolonging PFS seemed more robust than the benefit of lymphodepletion intensity, suggesting that the biological effects of lymphodepletion, rather than its intensity, may be the critical determinant of antitumor efficacy. The superior PFS in patients who developed a favorable cytokine profile compared with an unfavorable cytokine profile after high-intensity lymphodepletion suggests that the benefit of high-intensity lymphodepletion is not simply due to a greater chemotherapy-mediated antitumor effect. However, a contribution from disruption of the tumor microenvironment after high-intensity lymphodepletion cannot be discounted and should be considered in future studies. The benefit of a favorable cytokine profile was apparent even in high-risk patients with high pre-lymphodepletion LDH level. Although a subset of patients who received intensive Cy/Flu lymphodepletion had favorable cytokine profiles and excellent outcomes after treatment with defined composition CD19 CAR T cells, the impact of lymphodepletion intensity and the cytokine profile may be different after treatment with other CAR T-cell products. In addition, the enthusiasm for widespread adoption of high-intensity lymphodepletion must be tempered by the potential for greater risk of CRS and organ toxicity caused by more intensive chemotherapy.
Our study confirms the potent antitumor efficacy of defined composition CD19 CAR T cells in adults with aggressive B-cell NHL and reports durable remissions in many of those who achieved CR. The biological insights provided by data from multivariable analyses indicate that investigation of novel strategies to improve the cytokine milieu, such as delivery of different lymphodepletion regimens and approaches to supplement key cytokines, are warranted.
The online version of this article contains a data supplement.
The publication costs of this article were defrayed in part by page charge payment. Therefore, and solely to indicate this fact, this article is hereby marked “advertisement” in accordance with 18 USC section 1734.
Acknowledgments
The authors thank the staff of the FHCRC Cell Processing Facility, the Cell Therapy Laboratory at the Seattle Cancer Care Alliance, the FHCRC Integrated Immunotherapy Research Center, and the Seattle Cancer Care Alliance’s Bezos Family Immunotherapy Clinic.
This work was supported by the National Institutes of Health, National Cancer Institute (R01 CA136551 and P30 CA15704) and the National Institute of Diabetes and Digestive and Kidney Diseases (P30 DK56465), Life Science Discovery Fund, Bezos Family, the University of British Columbia Clinician Investigator Program, FHCRC Immunotherapy Integrated Research Center, and Juno Therapeutics, a Celgene company.
Authorship
Contribution: A.V.H., J.G., and K.A.H. collected and analyzed research data; S.C. and X.C. collected research data; B.S.P., R.M.H., A.V., and R.N.S. performed experiments; J.M.V., Q.W., T.G., and D.L. performed statistical analyses; A.V.H. and C.J.T. wrote and edited the manuscript; and all authors reviewed and edited the final version of the manuscript.
Conflict-of-interest disclosure: K.A.H. has served on advisory boards for Celgene. D.L. is an employee of and has equity ownership in Juno Therapeutics, a Celgene company. U.H.A. received research funding from Juno Therapeutics, a Celgene company. R.D.C. received research funding from Amgen, Incyte, Kite, a Gilead Company, Merck, Pfizer, and Seattle Genetics; and has served on advisory boards for Amgen, Jazz Pharmaceuticals, and Pfizer. H.-P.K. received research funding from Calimmune and Rocket Pharma; and has served on advisory boards for CSL, Homology, and Rocket Pharma. R.C.L. received research funding from Incyte, Juno Therapeutics, a Celgene company, Rhyzen Pharmaceuticals, Takeda, and TG Therapeutics. J.R. is an employee of and has equity ownership in Seattle Genetics. M.S. received research funding from Acerta Pharma, Beigene, Celgene, Genentech, Gilead Sciences, Mustang Bio, Pharmacyclics, and TG Therapeutics; and has served on advisory boards for AbbVie, AstraZeneca, Genentech, Qilu Puget Sound Biotherapeutics, and Verastem. B.G.T. received research funding from and has patents licensed to Mustang Bio. S.R.R. received research funding from and has patents licensed to Juno Therapeutics, a Celgene company; has equity ownership in Celgene; and has served on advisory boards for Adaptive Biotechnologies, Cell Medica, Juno Therapeutics, a Celgene company, and Nohla Therapeutics. D.G.M. received research funding from GlaxoSmithKline and Juno Therapeutics, a Celgene company. C.J.T. received research funding from Juno Therapeutics, a Celgene company, and Nektar Therapeutics; has patents licensed to Juno Therapeutics, a Celgene company; has served on advisory boards and has equity ownership in Caribou Biosciences, Eureka Therapeutics, and Precision Biosciences; and has served on advisory boards for Aptevo, Juno Therapeutics, a Celgene company, Kite, a Gilead Company, Nektar Therapeutics, and Novartis. The remaining authors declare no competing financial interests.
The current affiliation for U.H.A. is the Dana-Farber Cancer Institute/Brigham and Women’s Cancer Center, Brighton, MA.
The current affiliation for J.R. is Seattle Genetics, Seattle, WA.
Correspondence: Alexandre V. Hirayama, Clinical Research Division, Fred Hutchinson Cancer Research Center, 1100 Fairview Ave N, Seattle, WA 98109; e-mail: ahirayama@fredhutch.org.

This feature is available to Subscribers Only
Sign In or Create an Account Close Modal