

Key Points
Tumor EBV status is more strongly associated with distinct genetic and etiological mechanisms than geographic origin.
EBV-positive BL genomes feature fewer driver mutations despite their greater mutational load that is partly a result of increased AICDA activity.

Abstract
Although generally curable with intensive chemotherapy in resource-rich settings, Burkitt lymphoma (BL) remains a deadly disease in older patients and in sub-Saharan Africa. Epstein-Barr virus (EBV) positivity is a feature in more than 90% of cases in malaria-endemic regions, and up to 30% elsewhere. However, the molecular features of BL have not been comprehensively evaluated when taking into account tumor EBV status or geographic origin. Through an integrative analysis of whole-genome and transcriptome data, we show a striking genome-wide increase in aberrant somatic hypermutation in EBV-positive tumors, supporting a link between EBV and activation-induced cytidine deaminase (AICDA) activity. In addition to identifying novel candidate BL genes such as SIN3A, USP7, and CHD8, we demonstrate that EBV-positive tumors had significantly fewer driver mutations, especially among genes with roles in apoptosis. We also found immunoglobulin variable region genes that were disproportionally used to encode clonal B-cell receptors (BCRs) in the tumors. These include IGHV4-34, known to produce autoreactive antibodies, and IGKV3-20, a feature described in other B-cell malignancies but not yet in BL. Our results suggest that tumor EBV status defines a specific BL phenotype irrespective of geographic origin, with particular molecular properties and distinct pathogenic mechanisms. The novel mutation patterns identified here imply rational use of DNA-damaging chemotherapy in some patients with BL and targeted agents such as the CDK4/6 inhibitor palbociclib in others, whereas the importance of BCR signaling in BL strengthens the potential benefit of inhibitors for PI3K, Syk, and Src family kinases among these patients.
Introduction
Burkitt lymphoma (BL) is an aggressive B-cell non-Hodgkin lymphoma first described in Africa by Denis Burkitt in 1958.1 The geographic variability of BL incidence has prompted investigation into environmental factors including viruses and parasites.2,3 Cases arising in malaria-endemic regions, where the disease is most common, constitute the clinical variant known as endemic BL (eBL). Clinically, these cases most commonly present with large tumors at the head and the abdominal cavity. The cells of nearly all eBL tumors are infected by the Epstein-Barr virus (EBV), a recognized carcinogen for BL, the mechanism of which has not been fully elucidated.3,4 BL tumors tend to dramatically respond to intensive chemotherapy and are considered curable for children in countries in which proper supportive care is readily available.5 However, eBL remains fatal for the majority of children in sub-Saharan Africa for many reasons, including diagnosis at an advanced stage, healthcare delivery systems lacking capacity to support intensive chemotherapeutic regimens, and poverty/malnutrition.3,6-8 Outside of malaria-endemic regions, BL cases occur at a 10-fold lower incidence, termed sporadic BL (sBL), and concurrent EBV presence is much lower (10%-30%).9 The clinical manifestations of sBL differ from eBL, with abdominal and thoracic presentations most common and large facial tumors exceedingly rare. Until recently, treating adult and elderly patients was a challenge and was associated with high mortality,5 although current clinical trials are more promising.10 Thus, there is a continued need for better understanding the genetic and molecular features of BL to facilitate the discovery of more effective treatments with lower toxicity.
BL has a characteristic chromosomal rearrangement that places the MYC proto-oncogene next to an immunoglobulin (IG) enhancer, resulting in constitutive MYC expression.11,12 However, additional genetic or epigenetic alterations are required to cooperate with increased MYC activity for BL to develop.13 Recent studies using DNA or RNA sequencing (RNA-seq) or both have implicated several genes and pathways as drivers of BL, including B-cell receptor (BCR) and PI3K-AKT signaling (TCF3, ID3, PTEN), apoptosis (TP53), cell cycle regulation (CCND3), epigenetic regulation (ARID1A, SMARCA4, KMT2D), and G protein-coupled receptor signaling (GNA13, RHOA, P2RY8).14-19 RNA-seq data have also began shedding light on mutational differences of known BL genes in eBL and sBL17 and in BL stratified on tumor EBV status.18 However, these comparisons have thus far been limited by access to small patient cohorts, underrepresentation of African cases, and differences in experimental protocols.
Here, we present an integrative genomic and transcriptomic characterization of 106 HIV-negative pediatric BL cases by leveraging the largest yet multidimensional sequencing data set from samples from patients with BL. These data allowed for a detailed molecular and genetic comparison of EBV-positive and EBV-negative eBL and sBL tumors, revealing important pathogenic differences that indicate potential roles of EBV in Burkitt lymphomagenesis. Our findings suggest that tumor EBV status stratifies patients into more clinically relevant subgroups than geographic origin of the cases. Notably, we observed higher AICDA expression, a gene encoding for activation-induced cytidine deaminase, and concomitant aberrant somatic hypermutation (SHM) among EBV-positive tumors. In addition to identifying novel candidate BL genes, we show strikingly fewer putative driver mutations in EBV-positive tumors, a signal that was highly significant for mutations in genes with roles in apoptosis. These results clarify the molecular pathways and driver mutations relevant to EBV-positive and EBV-negative BLs and demonstrate that tumor EBV status identifies a distinct BL phenotype in both eBL and sBL, and may be an important consideration for BL therapy.
Materials and methods
Case accrual and sequencing
Endemic and sporadic cases were accrued from Uganda and the United States (termed Burkitt Lymphoma Genome Sequencing Project [BLGSP] cases), respectively, and tumor samples underwent stringent pathology consensus review. We subjected tumor and matched constitutive (normal) DNA from 91 cases to whole-genome sequencing (WGS; mean depth, 82-fold and 41-fold, respectively). We performed strand-specific ribo-depleted RNA sequencing (RNA-seq) and miRNA sequencing (miRNA-seq) on the tumor samples and applied the same protocol to flow-sorted centroblasts and centrocytes from 6 pediatric tonsil donors. We reanalyzed the paired tumor-normal WGS data (mean depth, 40-fold) from 15 sBLs that had been previously investigated by the International Cancer Genome Consortium (ICGC) Molecular Mechanisms in Malignant Lymphoma by Sequencing project.15,20 Because of the lower sequencing coverage, we omitted the ICGC cases for any analyses that would be susceptible to varying sensitivity for mutation calls. We also performed targeted sequencing of recurrently mutated regions on tumor and matched constitutive DNA (mean depth, 243-fold) in a separate validation cohort of 29 cases. Of these validation tumors, 26 also underwent RNA-seq. See the supplemental Methods, available on the Blood Web site, for more details.
Data analysis
WGS and RNA-seq reads were aligned to a version of the human reference genome (GRCh38) that included the EBV genome using BWA-MEM21 and the JAGuaR pipeline,22 respectively. Tumor EBV status was inferred from the fraction of EBV reads in the WGS data and the number of Epstein–Barr virus-encoded small RNAs (EBER) reads in the RNA-seq data (supplemental Figure 1). The inferred EBV status was concordant with available results from EBER in situ hybridization (N = 5) or EBV polymerase chain reaction (N = 1). We performed somatic variant calling on tumor-normal pairs to detect simple somatic mutations (SSMs; single nucleotide variants and small insertions/deletions; ie, <50 bp) using Strelka,23 copy number variations using Sequenza,24 and structural variations using Manta.25 Genes were considered significantly mutated by nonsynonymous SSMs if they were called by 2 or more of the following methods: MutSigCV,26 OncodriveFM,27 OncodriveFML,28 and OncodriveCLUST.29 Noncoding mutation peaks were detected using the Rainstorm and Doppler algorithms.30 De novo mutational signatures were identified using the previously described framework by Alexandrov et al.31 Gene expression was quantified using Salmon from the RNA-seq data (Gencode release 25),32 and miRNA expression was profiled using the methodology employed by The Cancer Genome Atlas project (miRBase release 21).33 Clonal BCRs were identified using MiXCR.34,35 See the supplemental Methods for more details.
Results
Clinical and molecular characteristics of the discovery and validation cases
The clinical and molecular characteristics of the discovery (N = 106) and validation (N = 29) cohorts are summarized in Table 1 and supplemental Table 1, respectively. The study of the relationship between disease biology and clinical variant status and tumor EBV status was enabled by the inclusion of 8 EBV-negative eBLs and 4 EBV-positive sBLs, termed “discordant” BL cases. Patient metadata are presented in supplemental Table 2, and mutation data are included in supplemental Tables 3-6. We found IG-MYC translocations in all but 2 of the discovery cases, with 85 (82%) cases involving IGH and the remaining 19 (18%) cases associated with IGL or IGK (Figure 1A). The other 2 discovery cases featured more complex MYC rearrangements involving BCL6 in an sBL case (BLGSP-71-19-00123) and IGH via an intergenic region on chromosome 17 in an eBL case (BLGSP-71-06-00277). We observed telomeric gains of chromosome 8 in 7 (6.6%) tumors, indicative of unbalanced IG-MYC translocations that may further promote MYC expression.
Summary of clinical and molecular characteristics of the discovery cohort
| Variable and level | BLGSP (n = 91) | ICGC (n = 15) | Total (n = 106) |
|---|---|---|---|
| Clinical variant | |||
| Endemic BL | 74 (81%) | 0 (0%) | 74 (70%) |
| Sporadic BL | 17 (19%) | 15 (100%) | 32 (30%) |
| EBV status | |||
| EBV-positive | 71 (78%) | 0 (0%) | 71 (67%) |
| EBV-negative | 20 (22%) | 15 (100%) | 35 (33%) |
| Age group, y | |||
| 0-5 | 21 (23%) | 6 (40%) | 27 (25%) |
| 6-10 | 50 (55%) | 5 (33%) | 55 (52%) |
| 11-15 | 18 (20%) | 2 (13%) | 20 (19%) |
| 16-20 | 2 (2%) | 2 (13%) | 4 (4%) |
| Tumor biopsy | |||
| FF | 88 (97%) | 15 (100%) | 103 (97%) |
| FFPE | 3 (3%) | 0 (0%) | 3 (3%) |
| IG-MYC translocations | |||
| IGH-MYC | 74 (81%) | 11 (73%) | 85 (80%) |
| IGL-MYC | 8 (9%) | 3 (20%) | 11 (10%) |
| IGK-MYC | 7 (8%) | 1 (7%) | 8 (8%) |
| Other | 2 (2%) | 0 (0%) | 2 (2%) |
| Expressed IG isotype | |||
| IgM | 63 (69%) | 0 (0%) | 63 (59%) |
| IgG | 11 (12%) | 0 (0%) | 11 (10%) |
| Undetectable | 17 (19%) | 15 (100%) | 32 (30%) |
| Anatomic site | |||
| Head-only disease | 29 (32%) | 0 (0%) | 29 (27%) |
| Intra-abdominal disease | 16 (18%) | 0 (0%) | 16 (15%) |
| Disseminated disease (no BM/CNS involvement) | 36 (40%) | 0 (0%) | 36 (34%) |
| Disseminated disease (BM/CNS involvement) | 8 (9%) | 0 (0%) | 8 (8%) |
| Unknown | 2 (2%) | 15 (100%) | 17 (16%) |
All cases were HIV-negative. Cases from the BLGSP and the ICGC project are shown separately. The IG isotype was not determined for the ICGC cases because the ICGC tumor RNA-seq data were not analyzed. BM, bone marrow; CNS, central nervous system; FF, fresh frozen tissue; FFPE, formalin-fixed paraffin-embedded tissue.
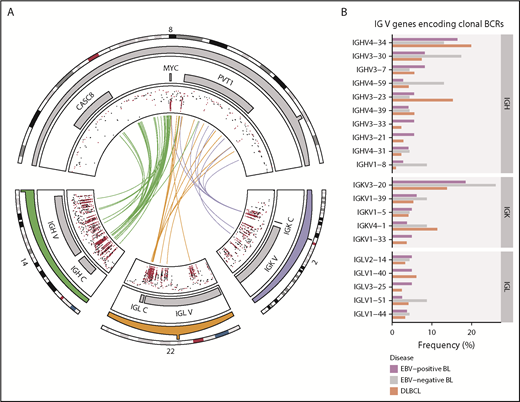
Rearrangements of the immunoglobulin loci in BL. (A) Translocations (shown in center) between the MYC locus (chromosome 8) and the IGH (chromosome 14), IGK (chromosome 2), or IGL (chromosome 22) loci in tumors with WGS data (N = 106). The inner track displays the rainfall plot for simple somatic mutations in these regions. Mutations that overlap AICDA recognition sites (RGYW) are shown in red. (B) Percentage of EBV-positive and EBV-negative BL (N = 117) and DLBCL (N = 323) tumors with RNA-seq data that use the given immunoglobulin V genes to encode their most clonal BCRs (ie, with the highest clonal fraction). V genes that are clonal in fewer than 4 BL tumors are not displayed. Within each group, V genes are ordered from top to bottom on the basis of decreasing overall frequency in the BL cohort.
Rearrangements of the immunoglobulin loci in BL. (A) Translocations (shown in center) between the MYC locus (chromosome 8) and the IGH (chromosome 14), IGK (chromosome 2), or IGL (chromosome 22) loci in tumors with WGS data (N = 106). The inner track displays the rainfall plot for simple somatic mutations in these regions. Mutations that overlap AICDA recognition sites (RGYW) are shown in red. (B) Percentage of EBV-positive and EBV-negative BL (N = 117) and DLBCL (N = 323) tumors with RNA-seq data that use the given immunoglobulin V genes to encode their most clonal BCRs (ie, with the highest clonal fraction). V genes that are clonal in fewer than 4 BL tumors are not displayed. Within each group, V genes are ordered from top to bottom on the basis of decreasing overall frequency in the BL cohort.
Nonuniform V gene usage for encoding clonal BCRs in BL
Given the reliance on a functional BCR in BL,14 we sought to characterize the heavy and light chain gene usage of the expressed BCR. We identified clonal IG gene rearrangements for the heavy and light chains in 96 (82%) and 104 (90%) out of 117 cases, respectively (supplemental Figure 2A-B). Tumors in which clonal rearrangements were undetectable had fewer reads attributable to IG genes (P = 1.2 × 10⁻⁷ and 5.7 × 10⁻⁴, respectively, Mann-Whitney U test), which limited the ability to detect rearrangements (supplemental Figure 2C). Among clonal rearrangements, IG variable region (V) gene usage was not uniform in BL, exhibiting a pattern comparable to diffuse large B-cell lymphoma (DLBCL) tumors (N = 323; Figure 1B).36 In BL, the most recurrently used heavy chain V genes were IGHV4-34 (16%), IGHV3-30 (10%), and IGHV3-7 (7.3%). The most frequently used light chain V gene was IGKV3-20 (20%). We found no difference in individual V gene usage based on clinical variant status or tumor EBV status, nor between BL and DLBCL (Q > 0.1, Fisher’s exact test). These results are consistent with the established notion that BL relies on BCR activity for promoting PI3K signaling14 and raises the possibility for positive selection of potentially autoreactive or antigen-driven BCRs.
Deregulated AICDA activity in EBV-positive BL
We identified 70 discrete genomic regions enriched for noncoding mutations, referred to here as “peaks,” with a median size of 1539 bp (supplemental Figure 3A; supplemental Table 7). Of the 38 peaks mutated in 15 or more patients, 17 overlapped one of the 3 IG loci and were considered separately. Of the remaining commonly mutated peaks, 18 were within 3 kbp of a transcription start site (TSS) and were thus named TSS-proximal, whereas the other 3 were considered TSS-distal (supplemental Figure 3B). Most of these peaks were more commonly mutated in endemic or EBV-positive cases (Q < 0.1, Fisher’s exact test; Figure 2A; supplemental Figure 3C). In addition, most TSS-proximal peaks are associated with genes known to be affected by aberrant SHM (aSHM).37 Given that most peaks are TSS-proximal and associated with genes targeted by aSHM, we hypothesized that these regions are mutated by AICDA.
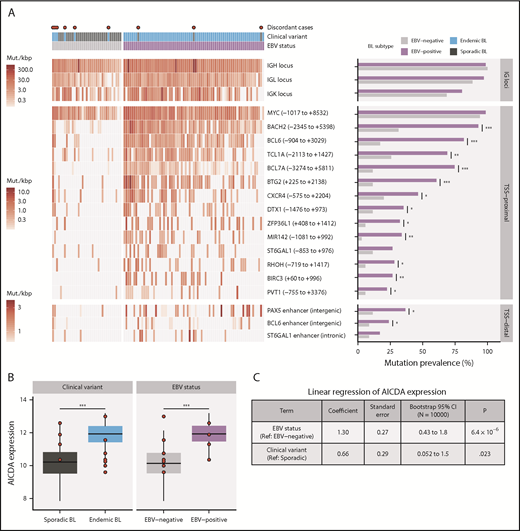
Differential AICDA activity in BL. (A) Left-hand panel shows for each tumor the density of noncoding mutations as mutations per kilobase (mut./kbp) in noncoding mutation peaks annotated with the nearest transcription start site (relative position in parentheses) or regulatory element. Peaks overlapping IG loci are shown separately. Red points indicate discordant cases, which we define as EBV-negative eBLs and EBV-positive sBLs. Right-hand panel compares the mutation prevalence for each peak in EBV-positive and EBV-negative tumors. Significance brackets: *Q < 0.1; **Q < 0.001; ***Q < 0.00001 (Fisher’s exact test). (B) AICDA expression in BL tumor samples stratified on clinical variant status or tumor EBV status (N = 117). Discordant cases, including additional ones from the validation cohort, are highlighted as red points. Significance brackets: ***P < .00001 (Mann-Whitney U test). (C) Linear regression of AICDA expression as a function of tumor EBV status and clinical variant status. This linear model was also bootstrapped 10 000 times to calculate bootstrap 95% confidence intervals (CI). Ref, reference level.
Differential AICDA activity in BL. (A) Left-hand panel shows for each tumor the density of noncoding mutations as mutations per kilobase (mut./kbp) in noncoding mutation peaks annotated with the nearest transcription start site (relative position in parentheses) or regulatory element. Peaks overlapping IG loci are shown separately. Red points indicate discordant cases, which we define as EBV-negative eBLs and EBV-positive sBLs. Right-hand panel compares the mutation prevalence for each peak in EBV-positive and EBV-negative tumors. Significance brackets: *Q < 0.1; **Q < 0.001; ***Q < 0.00001 (Fisher’s exact test). (B) AICDA expression in BL tumor samples stratified on clinical variant status or tumor EBV status (N = 117). Discordant cases, including additional ones from the validation cohort, are highlighted as red points. Significance brackets: ***P < .00001 (Mann-Whitney U test). (C) Linear regression of AICDA expression as a function of tumor EBV status and clinical variant status. This linear model was also bootstrapped 10 000 times to calculate bootstrap 95% confidence intervals (CI). Ref, reference level.
Consistent with AICDA activity, we found an enrichment of mutations affecting AICDA recognition sites (RGYW) in 61% of peaks (Q < 0.1, binomial exact test; supplemental Figure 3D). Given that active transcription is known to facilitate AICDA-mediated mutation,38,39 we explored the expression of genes associated with TSS-proximal peaks (ie, “peak target genes”). Peak target genes were among the most highly expressed genes in all tumors, including those cases lacking mutations in these regions (median TPM expression percentile = 98.3; supplemental Figure 3E). We also did not find a consistent association between the presence of mutations in a peak and higher target gene expression (supplemental Figure 3F). Overall, AICDA expression correlated with the number of mutations in peaks in any given genome (P = 2.3 × 10⁻⁸, Pearson correlation test; supplemental Figure 3G). Possibly explaining variability in mutation at these aSHM targets, AICDA was more highly expressed among eBLs (P = 4.9 × 10⁻⁷, Mann-Whitney U test) and in EBV-positive tumors (P = 4.8 × 10⁻⁹), regardless of clinical variant status (Figure 2B; supplemental Figure 3H). Linear regression confirmed a stronger association of AICDA expression with tumor EBV status than with clinical variant status (Figure 2C). Altogether, these findings demonstrate that discrete genomic regions in BL accumulate noncoding mutations, and most appear to be the consequence of AICDA-mediated aSHM in EBV-positive tumors.
Although several noncoding mutation peaks identified here overlap known targets of aSHM, many of these regions or genes are not known to be targeted by aSHM in BL. Notably, we found a peak 54 kbp downstream of MYC that overlaps the promoter and first intron of PVT1, a locus that produces a long noncoding RNA and a known target of MYC (Figure 3A).40 PVT1 promoter mutations occurred in 17% of 106 BL cases compared with only 4.6% in a cohort of 153 DLBCL cases.30 These mutations were associated with the presence of EBV (P = .031, Fisher’s exact test), but not with clinical variant status (P = .26). Another noncoding mutation peak affected a distal enhancer for PAX5, a transcription factor with an important role in B-cell differentiation (Figure 3B). Mutations in this enhancer were found in 11% of 150 chronic lymphocytic leukemia cases,41 whereas we observe a higher mutation incidence (20%) in 106 BL genomes, which is comparable to that observed in 153 DLBCL genomes (23%).30 Guanine-cytosine pairs in AICDA recognition sites (RGYW) were mutated at a higher than expected rate in the PAX5 enhancer and PVT1 promoter mutation peaks, reminiscent of aSHM (Q = 0.0045 and 0.056, respectively, binomial exact test). These variants raise the possibility that AICDA is contributing to BL by introducing noncoding mutations in regulatory regions.
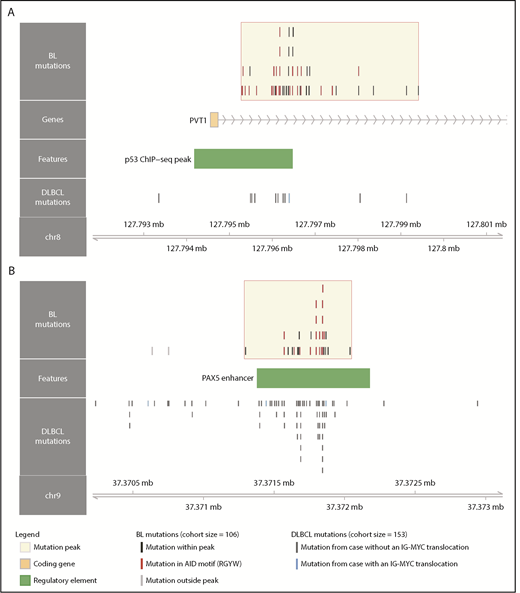
Novel targets of aberrant somatic hypermutation in BL. Noncoding mutation peaks overlapping (A) the PVT1 promoter region and (B) a distal PAX5 enhancer. Mutations from the BL discovery cohort (N = 106) and a DLBCL cohort (N = 153) are shown separately.
Novel targets of aberrant somatic hypermutation in BL. Noncoding mutation peaks overlapping (A) the PVT1 promoter region and (B) a distal PAX5 enhancer. Mutations from the BL discovery cohort (N = 106) and a DLBCL cohort (N = 153) are shown separately.
Novel patterns of nonsynonymous mutations in BL
Patterns of nonsynonymous mutations that depart from neutral selection often affect genes with important tumorigenic roles. We searched for these patterns among SSMs in our discovery cohort (N = 106) and identified 23 significantly mutated genes (Figure 4; supplemental Figure 5; supplemental Table 8). Several known BL genes were classified as significantly mutated, including some recently discovered candidate BL genes such as TFAP418 and KMT2D,19 whereas other previously reported candidate BL genes such as CCNF and MSH6 lacked nonsynonymous SSMs in our cohort.17,18 We also identified genes not previously described as recurrently mutated in BL; namely, SIN3A, USP7, HIST1H1E, CHD8, and RFX7. This highlights an emerging understanding of the genetic underpinnings of this disease.
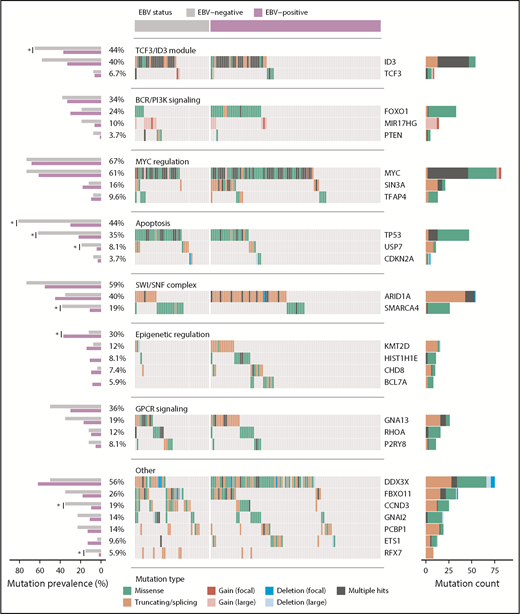
Landscape of nonsynonymous mutations in BL-associated genes. Mutation status of BL-associated genes (BLGs) in the discovery and validation cohorts. EBV-positive (N = 94) and EBV-negative (N = 41) tumors are shown separately and reordered for each pathway to highlight any mutual exclusivity. Mutations are colored according to their predicted consequence on the protein (ie, mutation type) and are tabulated in the right-hand bar plots. Focal gains and deletions were defined as those smaller than 1 Mbp. Mutation prevalence in EBV-positive (N = 94) and EBV-negative (N = 26) BLGSP discovery and validation cases were the ones subject to statistical analysis and are shown in left-hand bar plot. ICGC cases were excluded to avoid the possible confounding effect of lower sequencing coverage. Significance brackets: *Q < 0.1 (Fisher’s exact test).
Landscape of nonsynonymous mutations in BL-associated genes. Mutation status of BL-associated genes (BLGs) in the discovery and validation cohorts. EBV-positive (N = 94) and EBV-negative (N = 41) tumors are shown separately and reordered for each pathway to highlight any mutual exclusivity. Mutations are colored according to their predicted consequence on the protein (ie, mutation type) and are tabulated in the right-hand bar plots. Focal gains and deletions were defined as those smaller than 1 Mbp. Mutation prevalence in EBV-positive (N = 94) and EBV-negative (N = 26) BLGSP discovery and validation cases were the ones subject to statistical analysis and are shown in left-hand bar plot. ICGC cases were excluded to avoid the possible confounding effect of lower sequencing coverage. Significance brackets: *Q < 0.1 (Fisher’s exact test).
For a comprehensive view of potential driver mutations in BL, we considered all mutation types, including structural and copy number variations, affecting BL-associated genes (BLGs; supplemental Figure 6; supplemental Table 9). Here, we define BLGs as any gene deemed significantly mutated in our study or previously described as recurrently mutated in BL altered in at least 5 patients in our discovery cohort (Figure 4). Notably, we found an enrichment of variants affecting AICDA recognition sites in HIST1H1E, ID3, MYC, BCL7A, and ETS1, whereas GNAI2 and RHOA showed the opposite trend (Q < 0.1, binomial exact test; supplemental Figure 4A). The lack of putative AICDA-mediated mutations in GNAI2 and RHOA is consistent with the observed constraints on which codons are mutated in these genes (supplemental Figure 5). In fact, we extended the mutation pattern in GNAI2 to include the recurrent in-frame deletion of codon K272 (supplemental Figure 5). We also observed focal deletions or inversions affecting DDX3X in 6 (5.7%) cases and splicing branch point mutations in 3 (2.8%) additional cases, all predicted to disrupt the reading frame. Overall, the size and breadth of our WGS data has allowed a more detailed description of the mutational landscape of BL.
Protein-altering mutations associated with tumor EBV status
We next identified whether mutations in individual BLGs or biologically related gene sets (ie, pathways) more strongly associate with clinical variant status or tumor EBV status (supplemental Table 10) and consistently found greater contrast on the basis of EBV status (supplemental Figure 4C). EBV-negative tumors, but not sBL tumors, more frequently had mutations in TP53 (Q = 0.0044, Fisher’s exact test), a difference that became more striking when considering a group comprising all BLGs with roles in apoptosis (Q = 0.00024). We also found differences in the mutation prevalence of SMARCA4 and CCND3 (Q < 0.1), but were unable to confidently resolve whether these relate to tumor EBV status or geographic origin. In contrast to a previous report,18 we did not identify any differentially mutated genes between tumors infected by EBV type 1 and EBV type 2 (Q > 0.1). To confirm our findings, we compared tumor EBV status and clinical variant status as predictors of mutation status for differentially mutated genes and pathways, which were determined without including the 12 discordant cases (supplemental Table 11). Among the genes/pathways that were mutated in at least 10% of the cases, SMARCA4, apoptosis, CCND3, and TP53 were differentially mutated (Q < 0.1, Fisher’s exact test). Tumor EBV status significantly outperformed clinical variant status in predicting the mutation status of the apoptosis pathway in the discordant cases (P = .0094, McNemar’s test). For the remaining genes, it remained inconclusive as to whether their mutation status in the discordant cases were significantly better predicted by EBV status or clinical variant status (P > .05). Together, these findings demonstrate that EBV-positive tumors are genetically defined by a paucity of mutations affecting apoptotic genes, supporting the long-standing hypothesis that EBV abrogates apoptosis in BL tumors.
Distinct driver mutation burden and genome-wide mutational signatures in EBV-positive cases
The total mutation load per genome was significantly higher in endemic or EBV-positive cases, even when mutations within and outside mutation peaks were considered separately (Q < 0.1, Mann-Whitney U test; Figure 5A). Similarly, the burden was higher for nonsynonymous mutations in endemic or EBV-positive cases for all protein-coding genes. In contrast, EBV-positive cases had significantly fewer mutated BLGs per tumor (P = .00053, Mann-Whitney U test), but there was no significant difference when eBL was compared with sBL (P = .13; Figure 5B). This difference can be attributed to the presence of EBV, strongly suggests an elevated accumulation of driver mutations in EBV-negative BLs, and further corroborates the role of EBV infection in promoting tumorigenesis.
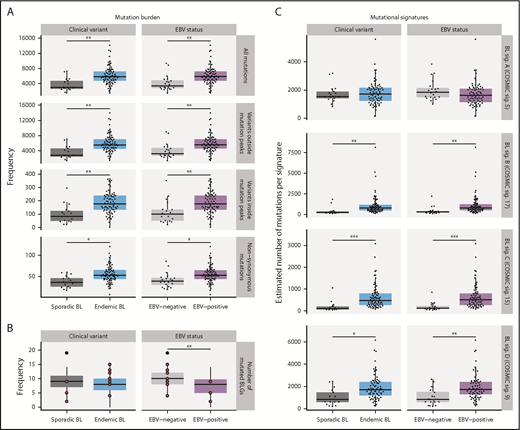
Mutational processes in BL. (A) Mutation frequency is shown for each disease subtype. From top to bottom, the following SSMs are considered in each tumor: all genome-wide SSMs, SSMs outside noncoding mutation peaks, SSMs within peaks, and nonsynonymous SSMs in all protein-coding genes. This analysis was restricted to WGS data from the BLGSP discovery cohort (N = 91). (B) Number of BLGs that are mutated in each BLGSP discovery and validation case (N = 120). All mutation types were considered, as displayed in Figure 4. Discordant cases are highlighted as red points. The number of mutated BLGs was compared using Mann-Whitney U tests (**P < .001). (C) Estimated number of single-nucleotide variants is shown per mutational signature for each disease subtype in the BLGSP discovery cohort (N = 91). The 4 de novo mutational signatures (BL sig.) are annotated with the associated COSMIC reference signature (COSMIC sig.). ICGC cases were excluded to avoid the possible confounding effect of lower sequencing coverage. Significance brackets (panels A and C): *Q < 0.1; **Q < 0.001; ***Q < 0.00001 (Mann-Whitney U test).
Mutational processes in BL. (A) Mutation frequency is shown for each disease subtype. From top to bottom, the following SSMs are considered in each tumor: all genome-wide SSMs, SSMs outside noncoding mutation peaks, SSMs within peaks, and nonsynonymous SSMs in all protein-coding genes. This analysis was restricted to WGS data from the BLGSP discovery cohort (N = 91). (B) Number of BLGs that are mutated in each BLGSP discovery and validation case (N = 120). All mutation types were considered, as displayed in Figure 4. Discordant cases are highlighted as red points. The number of mutated BLGs was compared using Mann-Whitney U tests (**P < .001). (C) Estimated number of single-nucleotide variants is shown per mutational signature for each disease subtype in the BLGSP discovery cohort (N = 91). The 4 de novo mutational signatures (BL sig.) are annotated with the associated COSMIC reference signature (COSMIC sig.). ICGC cases were excluded to avoid the possible confounding effect of lower sequencing coverage. Significance brackets (panels A and C): *Q < 0.1; **Q < 0.001; ***Q < 0.00001 (Mann-Whitney U test).
To investigate the underlying mutational processes shaping BL genomes, we inferred mutational signatures de novo,42 which yielded 4 signatures (supplemental Figure 7A,F). Each of these BL signatures was then paired with a COSMIC reference signature based on similarity to infer putative etiologies (supplemental Figure 7E).42,43 BL signatures A, B, C, and D were respectively paired with COSMIC signatures 5 (associated with age), 17 (unknown etiology), 15 (associated with defective DNA mismatch repair [MMR]), and 9 (associated with AICDA and polymerase η activity). The age-related BL signature A was correlated with age at diagnosis (Q = 5.5 × 10⁻⁹, Pearson correlation test), and the AICDA-related BL signature D was strongly correlated with AICDA expression (Q = 1.7 × 10⁻¹³). These correlations further lend credence to the robustness of our 4-signature solution, which was derived directly from the data (supplemental Figure 7B-D).
For each sample, the estimated number of mutations contributed by each signature was calculated (Figure 5C). In comparing EBV-positive and EBV-negative BL genomes, we found no difference in the age-related BL signature A. We found a significantly higher representation of BL signatures B, C, and D in EBV-positive or endemic tumors (Q < 0.1, Mann-Whitney U test). To isolate the source of this variation, we performed linear regression to describe the relationship between the estimated number of mutations per signature and potential covariates (supplemental Table 12). BL signature B, whose etiology remains unknown, did not associate with any of the covariates we considered (P > .05). In contrast, BL signature C was found to be significantly associated with tumor EBV status (P = .038), but not clinical variant status (P = .23), suggesting a link between EBV and DNA MMR. Last, consistent with an etiological link with AICDA, BL signature D was strictly associated with AICDA expression (P = .00098). Notably, neither BL signature B nor C correlated with AICDA expression, indicating that these do not have a significant contribution from AICDA (P = .18 and .34, respectively). In summary, we may partly attribute the increased mutational load in EBV-positive or endemic cases to defective DNA MMR and increased AICDA activity.
Discussion
We found a higher genome-wide mutation burden in EBV-positive or endemic cases (Figure 5A), and 3 de novo mutational signatures that can account for this difference (Figure 5C). BL signature B is mainly characterized by NTT > NGT transversions, reminiscent of COSMIC signature 17, which has no proposed etiology, although it has been observed in B-cell lymphomas. We found the MMR-associated BL signature C to be more strongly associated with tumor EBV status than geographic origin (supplemental Table 12). However, little is known about a functional link between EBV and the MMR pathway. In one study, EBV reportedly caused the loss of H3K4 tri-methylation of DNA repair signaling genes, among other targets, in nasopharyngeal epithelial cells.44 DNA methylation assays comparing EBV-positive and EBV-negative tumors may confirm whether this mechanism is also active in BL. In addition to potential defects in MMR, BL signature D revealed differential AICDA-mediated mutagenesis (supplemental Figure 7D; supplemental Table 12). Aberrant AICDA activity is thought to promote the double-strand breaks that lead to IG-MYC translocations and introduce mutations in some BL-associated genes such as ID3.15,45-49 Hence, our findings indicate a mutagenic role for EBV in promoting the accumulation of potential driver mutations in BL.
Despite a greater mutation burden, we found fewer putative driver mutations in EBV-positive BLs (Figure 5B). We can partially attribute this difference to a lack of mutations in SMARCA4 and CCND3 among EBV-positive or endemic cases (Figure 4), which has been reported previously.17,18 We also report a striking disparity in the prevalence of mutations affecting apoptotic genes that is strictly associated with tumor EBV status and not geographic origin. This novel finding may owe in part to our identification of USP7 as being recurrently mutated in BL. USP7 encodes a deubiquitinase that counteracts MDM2-mediated ubiquitination and degradation of TP5350 and, despite its status as an essential gene,51 has the mutational pattern of a tumor suppressor in BL. The interaction between TP53 and USP7 can be disrupted by the protein encoded by EBNA1,52 the only consistently expressed EBV protein in BL.3 We also cannot exclude the potential role of other EBV latency or lytic genes in disrupting apoptosis in vivo. Regardless of the mechanism, these findings are consistent with EBV suppressing apoptosis in BL cells, thereby alleviating the selective pressure for mutations affecting genes in this process.53
Our results extend the emerging theme of chromatin modifiers as recurrently mutated in B-cell non-Hodgkin lymphomas including BL.16,54 Notably, SIN3A, a novel candidate BL gene, mediates repression of MYC target genes through histone deacetylase complexes.55 The protein encoded by CHD8 can act as a repressor of transcription through chromatin regulation by recruiting histone H1 to target genes.56 With the exception of MYC, the SWI/SNF complex is the most commonly mutated group of functionally related genes in BL (Figure 4), and the only pathway with mutually exclusive mutations (Q = 2.3 × 10⁻⁵; supplemental Figure 4B). Mutual exclusivity between mutations affecting ARID1A and SMARCA4 supports the notion that these mutations are functionally redundant. Overall, mutations affecting these genes were uniformly observed between EBV-positive and EBV-negative cases, despite a significant enrichment of SMARCA4 mutations among the latter. The functional consequences of these mutations remain elusive and, given their high incidence across pediatric BL, warrant further investigation.
To fully leverage our data, we also searched for discrete regions enriched in noncoding mutations (Figure 2A). Most peaks of noncoding mutations were associated with known targets of SHM, and many were almost exclusively mutated in EBV-positive BL. This is consistent with our observation of elevated AICDA expression in EBV-positive tumors (Figure 2B-C). We also found regulatory elements such as the PVT1 promoter and a PAX5 enhancer are mutated in BL, indicating another potential role for AICDA (Figure 3). There is recent evidence that the PVT1 promoter acts as a tumor suppressor by insulating intragenic enhancers from inducing MYC expression, and that study showed PVT1 promoter mutations could enhance cancer cell growth.57 Although the mutations in BL target a different TSS of PVT1 than what was reported by Cho et al, it is unclear whether these have a similar functional effect, considering that MYC is already constitutively expressed in BL. A link between AICDA activity and EBV or malaria infection has long been hypothesized, but with a paucity of evidence from in vivo experiments.53 Our findings address this lack of data by showing increased AICDA expression in EBV-positive BL, which has been previously observed in vitro.58,59 Other studies have demonstrated similar increases in AICDA expression resulting from malaria infection.60-62 Further research is needed to confirm whether malaria plays an additional role in increasing AICDA expression.
In view of the importance of BCR signaling in BL,14 we identified V genes that encode clonal BCRs expressed in BL. Heavy chain V gene usage was not uniform, with IGHV4-34, IGHV3-30, and IGHV3-7 being the most commonly used, which is consistent with a previously published report and similar to what we found in DLBCL (Figure 1B).63 Of these, IGHV4-34 is the best characterized with an established role in autoreactivity.64,65 Among light chain V genes, IGKV3-20 was the most frequently used, encoding a clonal BCR in 21 (20%) tumors. Preferential IGKV3-20 usage has been observed in other B-cell non-Hodgkin lymphomas, especially in those linked to hepatitis C virus infection.66 We observed relatively higher IGKV3-20 usage in BL than in DLBCL (Figure 1B), although this difference was not significant. To our knowledge, this is the first time that disproportionate usage of IGKV3-20 is described in BL, which features one of the highest frequencies of IGKV3-20 usage among hepatitis C virus-negative B-cell malignancies.66 If an independent study confirms frequent IGKV3-20 usage in BL, this may suggest that patients with BL could benefit from emerging BCR-directed vaccines that target IGKV3-20 peptides.66 The remaining lesser known V genes that were overrepresented in our data set should be explored in future functional studies, given that their role in lymphoma pathology remains largely uncharacterized.
This study sheds new light on the mechanisms behind EBV carcinogenicity by leveraging the largest yet multidimensional data set comprising both EBV-positive and EBV-negative BLs. The clear genetic and molecular distinctions between EBV-positive and EBV-negative BL identified here reveal a multifaceted role for the virus in Burkitt lymphomagenesis and open new avenues to investigate treatment options. These results nominate EBV status as a more clinically relevant criterion for BL classification, given the pathogenic differences and associated implications for treatment. First, our findings highlight the potential utility of DNA-damaging chemotherapy in those patients with abrogated apoptosis or defective DNA MMR. Second, EBV-positive tumors appear reliant on EBV gene expression, which represents a potential vulnerability and nominates EBV as a therapeutic target. Third, the CDK4/6 inhibitor palbociclib would be predicted to be more effective in EBV-negative or sporadic BL as the result of an enhanced reliance on CCND3 mutations.14 Last, nonuniform V gene usage complements existing data showing a reliance on BCR signaling in BL, supporting the clinical use of inhibitors for PI3K, Syk, and Src family kinases.14
All molecular and clinical data used in this publication can be found on the National Cancer Institute’s Genome Data Commons Publication Page (https://gdc.cancer.gov/about-data/publications/CGCI-BLGSP-2019).
The online version of this article contains a data supplement.
The publication costs of this article were defrayed in part by page charge payment. Therefore, and solely to indicate this fact, this article is hereby marked “advertisement” in accordance with 18 USC section 1734.
Acknowledgments
The authors thank the Foundation for Burkitt Lymphoma Research Scientific Advisory Board for interesting discussions. The authors acknowledge the International Cancer Genome Consortium Molecular Mechanisms in Malignant Lymphoma by Sequencing project for openly sharing their raw sequencing data. The authors also acknowledge the African Field Epidemiology Network for coordinating EMBLEM fieldwork in Uganda. The authors thank Greg Rydzak and Laurie Buck at Information Management Systems and Janet Lawler-Heavner at Westat, Inc for coordinating the EMBLEM study. The authors acknowledge the Fred Hutchinson Cancer Research Center and the Uganda Cancer Institute for overseeing sample and data collection processes in Uganda. The authors acknowledge the St. Jude Biorepository and Flow Cytometry and Cell Sorting Shared Resource. The authors are grateful for the contribution from members of the various groups at Canada’s Michael Smith Genome Sciences Centre, including those from the Biospecimen, Quality Assurance, Library Construction, Instrumentation, Sequencing, Laboratory Information Management System (LIMS), Purchasing, Project Management, and Bioinformatics teams.
This work has been funded in part by the Foundation for Burkitt Lymphoma Research (http://www.foundationforburkittlymphoma.org) and in whole or in part with U.S. federal funds from the National Institutes of Health (NIH), National Cancer Institute, under contract HHSN261200800001E, and contracts HHSN261201100063C and HHSN261201100007I (Division of Cancer Epidemiology and Genetics). This work was supported by the Intramural Research Program, NIH, National Institute of Allergy and Infectious Diseases (S.J.R.); by a Terry Fox New Investigator Award (#1043); and by an operating grant from the Canadian Institutes for Health Research and a New Investigator Award from the Canadian Institutes for Health Research (R.D.M.). R.D.M. is a Michael Smith Foundation for Health Research Scholar. This work was supported by the Canadian Institutes for Health Research (FDN-143288) (M.A.M.), the American Lebanese Syrian Associated Charities of St. Jude Children’s Research Hospital, and the NIH, National Cancer Institute (R35-CA197695-01A1 to C.G.M.). Travel funds were provided by the Canadian Institutes for Health Research (#155017), the Canadian Cancer Society (#705613), and the John Bosdet Memorial Fund (B.M.G.).
The contents of this publication do not necessarily reflect the views of policies of the Department of Health and Human Services, nor does mention of trade names, commercial products, or organizations imply endorsement by the U.S. Government.
Authorship
Contribution: B.M.G. analyzed the data, produced the figures and tables, and with R.D.M., wrote the manuscript with assistance from D.S.G., K.B., J.B., C.C., T.C.G., N.L.H., E.S.J., N.K., S.M.M., C.G.M., A.J.M., A.N., G.W.W., and M.A.M.; A.J., L.C., N.K., C.G.M., C.K.R., G.W.W., and E.Y.Z. helped with data analyses; D.S.G., N.B.G., T.M.D., M.A.D., P.G., Y.H., Y.M., and K.N. managed the project and coordinated data deposition; J.S.A., T.B.A., L.W.A., J.M.B., K.B., C.C., J.K.C., T.G.G., P.K., F.E.L., S.M.M., C.G.M., C.N., A.N., M.D.O., A.O., J.O., S.J.R., and J.T.S. contributed samples to the study; H.A., J.B., J.M.G.-F., B.H., T.M.L., and C.T. collected sample metadata from tissue source sites and, with A.J.M., processed samples for sequencing; T.C.G., N.L.H., and E.S.J. performed consensus pathology review; C.C., T.G.G., E.S.J., and S.M.M. reviewed and advised on consensus anatomic site classification; D.S.G., J.D.I., J.P.M., M.-R.M., R.D.M., and L.M.S. designed the study; D.S.G., M.A.M., R.D.M., and L.M.S. directed the study; and all authors contributed to the interpretation of the data, reviewed the manuscript, and approved it for submission.
Conflict-of-interest disclosure: The authors declare no competing financial interests.
Correspondence: Ryan D. Morin, Department of Molecular Biology and Biochemistry, Simon Fraser University, 8888 University Dr, Burnaby, BC, V5A 1S6, Canada; e-mail: rdmorin@sfu.ca; and Louis M. Staudt, Lymphoid Malignancies Branch, Center for Cancer Research, National Cancer Institute, 9000 Rockville Pike, Bethesda, MD, 20892; e-mail: lstaudt@mail.nih.gov.

This feature is available to Subscribers Only
Sign In or Create an Account Close Modal