

Key Points
Error-corrected NGS-MRD can be applied to a majority of AML patients with high sensitivity.
NGS-MRD analysis in CR before alloHCT is highly predictive for outcome after alloHCT.

Abstract
Molecular measurable residual disease (MRD) assessment is not established in approximately 60% of acute myeloid leukemia (AML) patients because of the lack of suitable markers for quantitative real-time polymerase chain reaction. To overcome this limitation, we established an error-corrected next-generation sequencing (NGS) MRD approach that can be applied to any somatic gene mutation. The clinical significance of this approach was evaluated in 116 AML patients undergoing allogeneic hematopoietic cell transplantation (alloHCT) in complete morphologic remission (CR). Targeted resequencing at the time of diagnosis identified a suitable mutation in 93% of the patients, covering 24 different genes. MRD was measured in CR samples from peripheral blood or bone marrow before alloHCT and identified 12 patients with persistence of an ancestral clone (variant allele frequency [VAF] >5%). The remaining 96 patients formed the final cohort of which 45% were MRD+ (median VAF, 0.33%; range, 0.016%-4.91%). In competing risk analysis, cumulative incidence of relapse (CIR) was higher in MRD+ than in MRD− patients (hazard ratio [HR], 5.58; P < .001; 5-year CIR, 66% vs 17%), whereas nonrelapse mortality was not significantly different (HR, 0.60; P = .47). In multivariate analysis, MRD positivity was an independent negative predictor of CIR (HR, 5.68; P < .001), in addition to FLT3-ITD and NPM1 mutation status at the time of diagnosis, and of overall survival (HR, 3.0; P = .004), in addition to conditioning regimen and TP53 and KRAS mutation status. In conclusion, NGS-based MRD is widely applicable to AML patients, is highly predictive of relapse and survival, and may help refine transplantation and posttransplantation management in AML patients.
Introduction
Molecular predictors for relapse after allogeneic hematopoietic cell transplantation (alloHCT) are urgently needed because 16% to 51% of acute myeloid leukemia (AML) patients experience recurrence of disease after alloHCT depending on conditioning intensity and other factors.1 Measurable residual disease (MRD) monitoring for nucleophosmin 1 (NPM1) mutations has proven to be highly predictive for relapse in AML patients treated with or without alloHCT.2-6 However, a majority of AML patients undergoing alloHCT do not have the NPM1 marker, so alternative markers and techniques are required.7 As detailed in the recently published European LeukemiaNet (ELN) AML MRD consensus document, no uniform approach to detect these cells has yet been established in AML.8 Flow cytometry can be used for MRD detection (flow-MRD) in a majority of AML patients, but it is challenging to standardize this technique.8 In >90% of AML patients, molecular aberrations can be identified by next-generation sequencing (NGS),7 a technology that has found its way into clinical practice for the initial mutational screening at the time of AML diagnosis.9 Using NGS for MRD detection is appealing because its flexibility allows using almost every mutated gene as an MRD marker. In a pilot study, we tested NGS for MRD detection considering mutations in NPM1 and FLT3-ITD.10 There, we demonstrated the utility of NGS for MRD detection in these non–single-nucleotide variants (SNVs).10 The major problem of NGS-based MRD (NGS-MRD) detection lies in a sequencing error of up to 1% at each nucleotide position. This challenges the distinction of true mutations with low variant allele frequency (VAF) from sequencing errors. These errors primarily arise during library preparation and sequencing. Therefore, to reliably detect MRD with NGS, these problems need to be overcome by an error-corrected sequencing approach to detect small mutated clones with a VAF of ≤1% and to discriminate these from sequencing errors.
Mutations in many genes may arise in hematopoietic cells as part of age-related clonal hematopoiesis.11 The most frequently mutated gene in clonal hematopoiesis is DNMT3A, which did not predict relapse as an MRD marker in previous studies.12,13 However, the role of other genes less frequently associated with age-related clonal hematopoiesis in measuring MRD and predicting relapse risk is not clear and warrants further investigation.
We adapted the increasingly used concept of error-corrected sequencing in NGS-MRD and analyzed it for its ability to prognosticate relapse and survival after alloHCT.
Patients, materials, and methods
Patients
Patients were included if they were age ≥18 years, had a diagnosis of AML excluding acute promyelocytic leukemia, underwent alloHCT in complete morphologic remission (CR) between 1996 and 2016 at Hannover Medical School, and had DNA available at diagnosis and in CR just before alloHCT (median time from diagnosis to CR, 91 days; median time from sample to transplantation, 24 days; range, 5-71 days). A total of 116 patients were identified and underwent myeloid panel sequencing to identify a suitable molecular MRD marker, which could be a mutation in any gene except DNMT3A and NPM1, which we excluded from MRD markers because of the association of DNMT3A with clonal hematopoiesis14-17 and the established methodology to measure NPM1 MRD. DNA from the relapse sample was available for 20 patients and was analyzed by panel sequencing. Written informed consent was obtained according to the Declaration of Helsinki, and the study was approved by the institutional review board of Hannover Medical School (ethical vote 2179-2014).
NPM1 qRT-PCR for MRD assessment
Four adult AML patients with mutated NPM1 were included to quantify and compare NPM1-mutated transcript levels by quantitative real-time polymerase chain reaction (qRT-PCR) and our NGS-MRD assessment at diagnosis, in CR, and at relapse. NPM1 mutation–specific qRT-PCR was performed as previously described.2
Cytogenetic and molecular analyses
Pretreatment blood or bone marrow samples were studied centrally by G- and R-banding analyses. Chromosomal abnormalities were described according to the International System for Human Cytogenetic Nomenclature.18 DNA was extracted as described before using the Allprep DNA/RNA purification kit (Qiagen, Hilden, Germany).19 DNA sequencing libraries were prepared from samples at diagnosis (n = 116) and at relapse (n = 20) with a custom TruSight myeloid sequencing panel according to the manufacturer’s instructions (Illumina, San Diego, CA), which included 46 entire genes or hotspots recurrently found in myeloid leukemias (supplemental Table 1, available on the Blood Web site). All samples received individual dual indexes and were pooled at equimolar concentrations. Eighty samples per lane were sequenced on an Illumina HiSeq2500 sequencer using the HiSeq Rapid SBS Kit v2 (Illumina, San Diego, CA) for 251 cycles in both directions. The sequencing data were analyzed as described previously, with modifications as detailed in the supplement.20
Error-corrected sequencing for sensitive MRD detection
We established a custom amplicon sequencing approach for the MiSeq sequencer (Illumina) based on the previously developed method of error-corrected sequencing21 for sensitive detection of SNVs and indels (Figure 1), which is detailed in supplemental Methods. To reduce the sequencing error rate, we used a proofreading polymerase for PCR, introduced random barcodes to allow bioinformatic error correction, performed the initial PCR with only 5 PCR cycles, avoided identical multiplex identifier/gene combinations on consecutive MiSeq runs, and established a standardized approach of bioinformatic analysis with error correction (supplemental Methods).
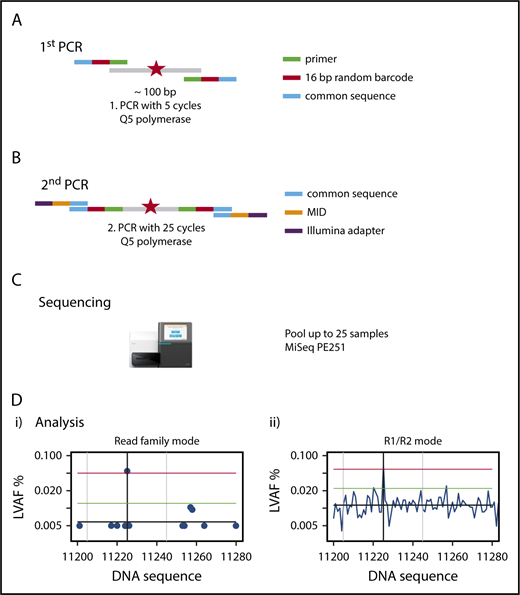
Outline of amplicon-based NGS-MRD analysis. (A) Primers containing the complementary sequence (green), a 16–base pair (bp) random unique molecular identifier (red), and a so-called common sequence (blue) are designed around a known mutation (red star) covering a nucleotide sequence of 87 to 155 bp. The first PCR is run for 5 cycles, with primers detailed in the graph, and the product is cleaned up and size selected. (B) The second PCR is run for 25 cycles, with primers containing a complementary sequence to the common sequence (blue), the multiplex identifier (MID; orange), and the Illumina adapter (purple), and the product is cleaned up and size selected. (C) Up to 25 samples are pooled and run on a MiSeq sequencing instrument with 251 cycles in both directions. (D) Sequencing reads are demultiplexed by their MIDs, aligned to the target region, and error corrected by reconstructing read families using the random barcodes introduced in the first PCR and by constructing R1/R2 consensus sequences. The x-axis shows nucleotides around the mutated target region; the y-axis shows the variant allele frequency. The left graph (i) shows the graphical representation of the RF analysis. A blue dot shows the largest variant allele frequency (LVAF) at the respective nucleotide position. The black vertical line indicates the base position of the target mutation and in this example shows a mutation clearly above the background sequencing error. The gray vertical lines indicate ±20 bp up- and downstream of the target peak. The black horizontal line indicates the mean background error calculated from LVAFs. The green horizontal line indicates the background error +3 standard deviations of the background error (the target LVAF should be above this line). The red horizontal line indicates the LVAF of the target −3 standard deviations of the background error (no other peak should be above this line within ±20 bp of the target LVAF). The right graph (ii) shows the graphical representation of the R1/R2 corrected analysis. LVAFs are plotted for each nucleotide position. Vertical and horizontal lines are defined as in the left panel. PE, paired end.
Outline of amplicon-based NGS-MRD analysis. (A) Primers containing the complementary sequence (green), a 16–base pair (bp) random unique molecular identifier (red), and a so-called common sequence (blue) are designed around a known mutation (red star) covering a nucleotide sequence of 87 to 155 bp. The first PCR is run for 5 cycles, with primers detailed in the graph, and the product is cleaned up and size selected. (B) The second PCR is run for 25 cycles, with primers containing a complementary sequence to the common sequence (blue), the multiplex identifier (MID; orange), and the Illumina adapter (purple), and the product is cleaned up and size selected. (C) Up to 25 samples are pooled and run on a MiSeq sequencing instrument with 251 cycles in both directions. (D) Sequencing reads are demultiplexed by their MIDs, aligned to the target region, and error corrected by reconstructing read families using the random barcodes introduced in the first PCR and by constructing R1/R2 consensus sequences. The x-axis shows nucleotides around the mutated target region; the y-axis shows the variant allele frequency. The left graph (i) shows the graphical representation of the RF analysis. A blue dot shows the largest variant allele frequency (LVAF) at the respective nucleotide position. The black vertical line indicates the base position of the target mutation and in this example shows a mutation clearly above the background sequencing error. The gray vertical lines indicate ±20 bp up- and downstream of the target peak. The black horizontal line indicates the mean background error calculated from LVAFs. The green horizontal line indicates the background error +3 standard deviations of the background error (the target LVAF should be above this line). The red horizontal line indicates the LVAF of the target −3 standard deviations of the background error (no other peak should be above this line within ±20 bp of the target LVAF). The right graph (ii) shows the graphical representation of the R1/R2 corrected analysis. LVAFs are plotted for each nucleotide position. Vertical and horizontal lines are defined as in the left panel. PE, paired end.
The Illumina Miseq reagent kit v3 (600 cycles) was used for sequencing and was run on the MiSeq sequencer aiming for a high coverage per sample (we obtained 75 804 to 937 653 aligned reads per marker with 251 sequencing cycles in both directions).
Bioinformatic and statistical analyses
Bioinformatic analyses of myeloid panel sequencing and error-corrected sequencing are described in detail in supplemental Methods. We developed a standardized algorithm for calling SNVs and small and large indels MRD+ or MRD− based on the number of read families (RFs; RF mode; error-corrected sequencing) or the number of matching forward (read 1 [R1]) and reverse (R2) reads (R1/R2 mode), considering the background error of the individual sample as limit of detection (details provided in supplemental Methods and supplemental Figure 1).
Median follow-up time for survival was calculated according to the method of Korn.22 Overall survival (OS) end points, measured from the date of alloHCT, were death (failure) and alive at last follow-up (censored). Relapse-free survival (RFS) end points, measured from the date of alloHCT, were relapse (failure), death in CR (failure), and alive in CR at last follow-up (censored). The Kaplan-Meier method and log-rank tests were used to estimate the distribution of OS and RFS and to compare differences between survival curves. The Gray test was used to compare and visually represent cumulative incidences of nonrelapse mortality (NRM) and cumulative incidence of relapse (CIR) as competing risks using R package cmprsk. Sixty categorized variables were considered in univariate analysis for OS, CIR, RFS, and NRM (supplemental Table 2 lists variables and definitions of variable categories). Details of multivariate analysis are described in supplemental Methods.
Comparisons of variables were performed using the Kolmogorov-Smirnov test and Student’s t test for continuous variables and the χ2 test for categorical variables for exploratory purposes. The positive predictive value (PPV) was calculated by the ratio of true-positive patients/(true-positive + false-positive patients). The negative predictive value (NPV) was calculated by the ratio of true-negative patients/(true-negative + false-negative patients).23
The two-sided level of significance was set at P < .05. The statistical analyses were performed with the statistical software package SPSS 24.0 (IBM Corporation, Armonk, NY), statistical program R using packages survival and cmprsk (R Foundation for Statistical Computing, Vienna, Austria), Microsoft Excel 2010 (Microsoft Corporation, Redmond, WA), and custom Linux scripts.
Results
Validation of the NGS-MRD approach
To validate the NGS-MRD approach, 4 NPM1-mutated AML patients were evaluated for MRD levels at diagnosis, in remission, and at molecular relapse by an established RT-PCR method2 and by our NGS-MRD approach with primers covering the NPM1 mutation hotspot. MRD positivity/negativity was concordant between both methods for all patients and time points (supplemental Figure 2), thus supporting sensitive, specific, and quantitative measurements of MRD by our NGS-MRD method. In addition, we analyzed the detection limit with dilution curves for IDH1- and IDH2-mutated AML samples with a VAF of 50% using DNA from HL60 cells as IDH1/2 wild-type control. By error-corrected sequencing (RF mode) analysis, we achieved a linear detection range down to the 10 000-fold dilution, corresponding to a limit of detection of 0.005%. The R1/R2 analysis mode showed a linear detection range down to the 3000-fold dilution, corresponding to a limit of detection of 0.017% (Figure 2). Furthermore, in 1 patient with CBFB-MYH11+ AML, we identified with qRT-PCR 56 copies of CBFB-MYH11 per 10 000 ABL copies (0.56%; MRD+). By NGS, we analyzed NRAS in the same patient and found the mutation at a VAF of 0.035% (MRD+). Thus, both methods identified MRD in this patient, supporting the validity of this NGS assay.
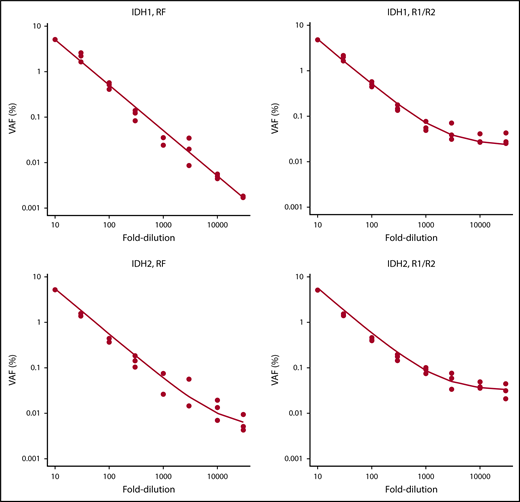
Serial dilution of IDH1- and IDH2-mutated cells with IDH1/IDH2 wild-type DNA.IDH1 and IDH2 samples were mutated at a VAF of 50%. Mutated DNA was diluted with DNA from IDH1/IDH2 wild-type cells up to 30 000-fold, and 8 different dilutions were tested in 3 independent replicates. RF approach indicates error-corrected sequencing analysis. R1/R2 indicates analysis by forward/reverse read correction.
Serial dilution of IDH1- and IDH2-mutated cells with IDH1/IDH2 wild-type DNA.IDH1 and IDH2 samples were mutated at a VAF of 50%. Mutated DNA was diluted with DNA from IDH1/IDH2 wild-type cells up to 30 000-fold, and 8 different dilutions were tested in 3 independent replicates. RF approach indicates error-corrected sequencing analysis. R1/R2 indicates analysis by forward/reverse read correction.
Patients and feasibility of NGS-MRD assessment
At diagnosis, 8 (7%) of 116 patients did not have any appropriate mutation in the myeloid panel analysis and were excluded from further analysis. Of the remaining 108 patients, the selected MRD mutation had a VAF >5% in the CR sample before alloHCT in 12 patients (10%), who were also excluded from primary analysis. The following 9 genes were found with high VAF in CR: ASXL2 (n = 1), CBL (n = 1), CUX1 (n = 1), ETV6 (n = 1), IDH1 (n = 2), IDH2 (n = 2), PPM1D (n = 1), STAG2 (n = 1), and TET2 (n = 2). The VAF ranged from 6.5% to 53.4%, and clinical characteristics of these patients are shown in supplemental Table 3. These variants may indicate persistence of the mutation in differentiated cells, preexisting clonal hematopoiesis, or germ line origin. Therefore, our main analysis cohort consisted of 96 patients, who had an evaluable MRD marker with a VAF of ≤5% at the time of CR before alloHCT. Ninety-one patients (95%) had undergone transplantation in first CR and 5 patients (5%) in second CR. Genomic DNA from peripheral blood (n = 56) or bone marrow (n = 40) was used to analyze 1 (n = 66), 2 (n = 28), or 3 (n = 2) mutations per patient for MRD in the pretransplantation CR sample. Mutations in the following 24 genes were used for MRD analysis in the indicated number of patients: IDH2 (n = 17), RUNX1 (n = 17), NRAS (n = 12), FLT3 (n = 11), TP53 (n = 8), IDH1 (n = 7), KRAS, SF3B1, or STAG2 (n = 6 each), EZH2 (n = 5), BCOR, BCORL1, PTPN11, TET2, or WT1 (n = 4 each), PHF6 (n = 3), RAD21 or ETV6 (n = 2 each), and CBL, DDX41, KDM6A, SETBP1, SMC3, or STAG1 (n = 1 each). One hundred mutations were SNVs, and 28 mutations were indels. In the NGS analysis, the mean number of aligned reads was 414 603 (range, 75 804-937 653), and the mean number of RFs was 74 640 (range 8964-305 795). Detailed results of MRD quantification are shown in supplemental Table 4. Background error and sensitivity threshold (background error + 3 standard deviations) of the assay were calculated for each mutation and reached a median LVAF of 0.0071% and 0.015%, respectively (supplemental Table 4; median of RF and R1/R2-corrected analyses).
Incidence of MRD and associated patient characteristics
Forty-three (45%) of 96 evaluable patients were MRD+, with a median VAF of 0.33% (range, 0.016%-4.91%; supplemental Table 4), whereas 53 patients (55%) were MRD−. MRD+ patients more often had an adverse cytogenetic profile according to MRC, more often had an adverse 2017 ELN risk9 and complex karyotype, and by trend more often had an HCT comorbidity index24 >2 (Table 1). Other clinical and transplantation-associated characteristics were similarly distributed between MRD+ and MRD− patients (Table 1). Importantly, the frequency of MRD positivity was similar whether MRD was determined in peripheral blood or bone marrow (43% and 48%, respectively). Molecular aberrations showed no significant differences between MRD+ and MRD− patients, apart from more frequent TP53 and SF3B1 mutations and less frequent NPM1 mutations and a trend toward less frequent U2AF1 mutations in MRD+ patients (supplemental Table 5).
Comparison of clinical characteristics between MRD+ (n = 43) and MRD− AML patients (n = 53)
| Characteristic | MRD+ (n = 43) | MRD− (n = 53) | P* |
|---|---|---|---|
| Age, y | .89 | ||
| Median | 50.1 | 51.7 | |
| Range | 18.8-67.7 | 21.1-69.9 | |
| Sex, n (%) | .23 | ||
| Male | 15 (35) | 25 (47) | |
| Female | 28 (65) | 28 (53) | |
| ECOG performance status at diagnosis, n (%) | .13 | ||
| 0 | 11 (26) | 10 (19) | |
| 1 | 31 (72) | 36 (68) | |
| 2 | 1 (2) | 7 (13) | |
| FAB subtype, n (%) | .70 | ||
| M0 | 7 (16) | 7 (13) | |
| M1 | 4 (9) | 11 (21) | |
| M2 | 9 (21) | 6 (11) | |
| M4 | 9 (21) | 13 (25) | |
| M5 | 6 (14) | 3 (6) | |
| M6 | 0 (0) | 3 (6) | |
| M7 | 1 (2) | 0 (0) | |
| Missing data | 7 (16) | 10 (19) | |
| Type of AML, n (%) | .71 | ||
| De novo | 31 (72) | 40 (75) | |
| Secondary† | 12 (28) | 13 (25) | |
| Cytogenetic risk group, n (%)‡ | .02 | ||
| Favorable | 2 (5) | 1 (2) | |
| Intermediate | 24 (56) | 44 (83) | |
| Adverse | 17 (40) | 8 (15) | |
| 2017 ELN risk group,9 n (%) | .006 | ||
| Favorable | 5 (12) | 15 (28) | |
| Intermediate | 11 (26) | 19 (36) | |
| Adverse | 27 (63) | 19 (36) | |
| Complex karyotype, n (%) | .003 | ||
| No | 31 (72) | 50 (94) | |
| Yes | 12 (28) | 3 (6) | |
| WBC count, ×109/L | .57 | ||
| Median | 8 | 19 | |
| Range | 0.8-227 | 0.7-200.9 | |
| Hemoglobin, g/dL | .32 | ||
| Median | 9.5 | 9.7 | |
| Range | 4.7-15 | 4.6-13.7 | |
| Platelet count, ×109/L | .25 | ||
| Median | 52 | 63 | |
| Range | 4-402 | 11-427 | |
| N of chemotherapy cycles before alloHCT, n (%) | .19 | ||
| 1 | 8 (19) | 3 (6) | |
| 2 | 26 (60) | 37 (70) | |
| 3 | 9 (21) | 13 (25) | |
| Type of CR sample for MRD, n (%) | .825 | ||
| Peripheral blood | 25 (58) | 32 (60) | |
| Bone marrow | 18 (42) | 21 (40) | |
| Donor match, n (%) | .33 | ||
| MR | 14 (33) | 15 (28) | |
| MU | 23 (53) | 27 (51) | |
| MMR | 1 (2) | 1 (2) | |
| MMU | 4 (9) | 10 (19) | |
| Missing data | 1 (2) | 0 (0) | |
| Type of conditioning regimen, n (%) | .84 | ||
| Myeloablative | 22 (51) | 26 (49) | |
| Reduced intensity | 21 (49) | 27 (51) | |
| Stem-cell source, n (%) | .58 | ||
| Peripheral blood | 40 (93) | 49 (92) | |
| Bone marrow | 2 (5) | 4 (8) | |
| Bissing data | 1 (2) | 0 (0) | |
| Remission status, n (%) | .83 | ||
| CR1 | 41 (95) | 50 (94) | |
| CR2 | 2 (5) | 3 (6) | |
| HCT comorbidity index score before transplantation,24 n (%) | .07 | ||
| 0-2 | 28 (65) | 44 (83) | |
| >2 | 14 (33) | 9 (17) | |
| Missing data | 1 (2) | 0 (0) | |
| Donor sex, n (%) | .35 | ||
| Male | 15 (35) | 24 (45) | |
| Female | 27 (63) | 29 (55) | |
| Missing data | 1 (2) | 0 (0) | |
| CMV status, n (%) | .24 | ||
| Donor−, patient− | 15 (35) | 13 (25) | |
| Any other combination | 27 (63) | 40 (75) | |
| Missing data | 1 (2) | 0 (0) |
CMV, cytomegalovirus; ECOG, Eastern Cooperative Oncology Group; FAB, French-American-British; MMR, mismatched related; MMU, mismatched unrelated; MR, matched related; MU, matched unrelated; WBC, white blood cell.
P value from 2-sided χ2 tests for categorical variables and from 2-sided Student’s t or Kolmogorov-Smirnov tests for continuous variables.
Secondary AML meaning leukemia secondary to chemo- or radiotherapy or an antecedent hematologic disease;
Cytogenetic risk group is defined according to Medical Research Council criteria.43
Prognostic effect of NGS-MRD
The median follow-up of the 96 evaluable patients was 6.2 years; 27 (63%) of 43 MRD+ patients and 8 (15%) of 53 MRD− patients relapsed after alloHCT. By competing risk analysis for CIR and NRM, MRD+ patients had a significantly higher CIR than MRD− patients (hazard ratio [HR], 5.58; 95% confidence interval [CI], 2.47-12.60; P < .001; 5-year CIR, 66% vs 17%), whereas NRM was not different (HR, 0.61; 95% CI, 0.15-2.37; P = .47; 5-year NRM, 9% vs 11%; Figure 3; Table 2; supplemental Table 6). RFS and OS were significantly shorter in MRD+ compared with MRD− patients (RFS: HR, 3.56; 95% CI, 1.86-6.81; P < .001; 5-year RFS, 31% vs 74%; OS: HR, 3.06; 95% CI, 1.53-6.12; P = .002; 5-year OS, 41% vs 78%; Figure 3; Table 2). For multivariate analysis, 60 variables were considered in univariate analysis for OS, RFS, CIR, and NRM and were included in a multivariate model if P ≤ .1 (supplemental Table 6; FLT3-ITD and NPM1 were included despite P > .1). In multivariate analysis, MRD positivity was an independent predictor of CIR (HR, 5.67; 95% CI, 2.30-14.0; P < .001), in addition to DNMT3A, NPM1, and FLT3-ITD mutation status, and of OS (HR, 3.0; 95% CI, 1.41-6.38; P = .004), in addition to conditioning regimen and KRAS and TP53 mutation status (Table 2). MRD positivity was also an independent predictor of RFS (HR, 3.41; 95% CI, 1.72-6.75; P = .001), in addition to patient age and TP53 and KRAS mutation status, whereas it had no effect on NRM (Table 2). KRAS-mutated patients had a high risk of NRM, and therefore, KRAS mutation was also predictive for OS and RFS but not for CIR. We investigated correlation between the time to relapse and the VAF in MRD+ patients who relapsed after alloHCT. There was a negative correlation (Spearman’s rank correlation coefficient, −0.352; P = .072), indeed suggesting that time to relapse was longer in patients with lower pretransplantation MRD load (supplemental Figure 3). On the basis of Cox regression analysis using VAF or log10 VAF as a continuous variable, the hazard of relapse increased with an HR of 1.44 per 1% increase in VAF (95% CI, 1.12-1.86; P = .004); using log10 VAF, the hazard of relapse increased with an HR of 1.94 per 10-fold increase in VAF (95% CI, 1.11-3.38; P = .019).
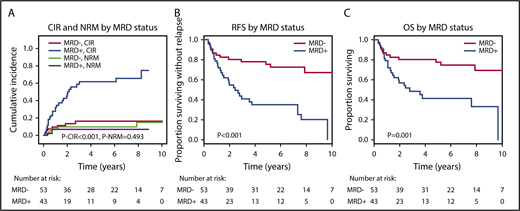
CIR, NRM, RFS, and OS for MRD+and MRD−patients. (A) CIR and NRM by competing risk analysis for MRD+ (n = 43) and MRD− patients (n = 53). (B) RFS for MRD+ positive (n = 43) and MRD− patients (n = 53). (C) OS for MRD+ (n = 43) and MRD− patients (n = 53).
CIR, NRM, RFS, and OS for MRD+and MRD−patients. (A) CIR and NRM by competing risk analysis for MRD+ (n = 43) and MRD− patients (n = 53). (B) RFS for MRD+ positive (n = 43) and MRD− patients (n = 53). (C) OS for MRD+ (n = 43) and MRD− patients (n = 53).
Univariate and multivariate analyses for CIR, NRM, RFS, and OS in AML patients (n = 96)
| End point | Univariate analysis | Multivariate analysis | ||||
|---|---|---|---|---|---|---|
| HR* | 95% CI | P | HR* | 95% CI | P | |
| CIR | ||||||
| MRD+ vs MRD− | 5.58 | 2.47-12.59 | <.001 | 5.67 | 2.30-14.0 | <.001 |
| DNMT3A mutant vs wild type | 0.41 | 0.17-0.97 | .042 | 0.33 | 0.12-0.89 | .029 |
| FLT3-ITD present vs absent | 0.91 | 0.38-2.15 | .828 | 3.70 | 1.36-10.10 | .011 |
| NPM1 mutant vs wild type | 0.19 | 0.04-0.81 | .025 | 0.22 | 0.06-0.77 | .018 |
| NRM | ||||||
| AML type secondary vs de novo AML | 6.25 | 1.58-24.63 | .009 | 5.64 | 1.80-17.65 | .003 |
| Age >60 vs 18-60 y | 3.93 | 1.07-14.43 | .039 | 7.13 | 1.75-29.16 | .006 |
| KRAS mutant vs wild type | 5.44 | 1.6-18.46 | .007 | 19.4 | 3.32-113 | .001 |
| NPM1 mutant vs wild type | 1.92 | 0.48-7.73 | .356 | 4.42 | 1.70-11.52 | .002 |
| RFS | ||||||
| MRD+ vs MRD− | 3.56 | 1.86-6.81 | <.001 | 3.41 | 1.72-6.75 | .001 |
| Age >60 vs 18-60 y | 1.89 | 1.02-3.49 | .043 | 2.23 | 1.15-4.33 | .017 |
| KRAS mutant vs wild type | 2.13 | 1.03-4.39 | .041 | 3.51 | 1.64-7.50 | .001 |
| TP53 mutant vs wild type | 2.74 | 1.30-5.79 | .008 | 2.26 | 1.09-4.70 | .029 |
| OS | ||||||
| MRD+ vs MRD− | 3.06 | 1.54-6.12 | .002 | 3.00 | 1.41-6.38 | .004 |
| Conditioning MAC vs RIC | 0.54 | 0.28-1.02 | .056 | 0.37 | 0.20-0.69 | .002 |
| KRAS mutant vs wild type | 2.84 | 1.33-6.05 | .007 | 5.58 | 2.68-11.62 | <.001 |
| TP53 mutant vs wild type | 3.57 | 1.67-7.61 | .001 | 3.97 | 1.90-8.29 | <.001 |
MAC, myeloablative conditioning; RIC, reduced-intensity conditioning.
HRs >1 or <1 indicate an increased or decreased risk, respectively.
The prognostic effect of MRD on CIR and OS after alloHCT was largely preserved when the analysis was restricted to patients in whom MRD was measured in either peripheral blood or bone marrow (Figure 4). We also analyzed paired peripheral blood and bone marrow samples from 8 patients with available DNA and found very good concordance between the 2 tissues. Seven of 8 patients were positive in both tissues, and 1 patient was positive in bone marrow but negative in peripheral blood (supplemental Figure 4). CIR and OS remained separated by MRD into prognostic subgroups when the cutoff for MRD positivity was changed to 0.1% or 1.0% (supplemental Figure 5). By changing the MRD cutoff to 0.1% and 1%, the proportion of MRD+ patients decreased from 45% to 29% and 16%, respectively. We also found that MRD status was prognostic for CIR, RFS, and OS in the favorable and adverse ELN risk categories, with a trend in the intermediate-risk category (supplemental Figures 6-8) and when looking at SNVs and indels separately (supplemental Figures 9-10).
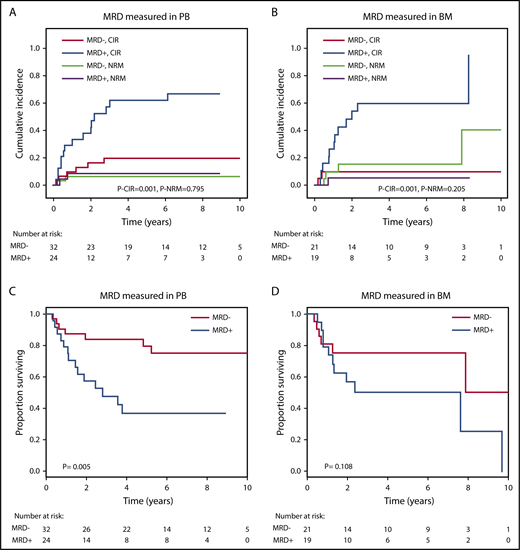
Prognostic effect of MRD on CIR, NRM, and OS if measured in peripheral blood (PB) or in bone marrow (BM). (A) CIR and NRM by competing risk analysis for MRD+ positive (n = 24) and MRD− patients (n = 32) in whom MRD was quantified in PB. (B) CIR and NRM by competing risk analysis for MRD+ (n = 19) and MRD− patients (n = 21) in whom MRD was quantified in BM. (C) OS for MRD+ (n = 24) and MRD− patients (n = 32) in whom MRD was quantified in PB. (D) OS for MRD+ (n = 19) and MRD− patients (n = 21) in whom MRD was quantified in BM.
Prognostic effect of MRD on CIR, NRM, and OS if measured in peripheral blood (PB) or in bone marrow (BM). (A) CIR and NRM by competing risk analysis for MRD+ positive (n = 24) and MRD− patients (n = 32) in whom MRD was quantified in PB. (B) CIR and NRM by competing risk analysis for MRD+ (n = 19) and MRD− patients (n = 21) in whom MRD was quantified in BM. (C) OS for MRD+ (n = 24) and MRD− patients (n = 32) in whom MRD was quantified in PB. (D) OS for MRD+ (n = 19) and MRD− patients (n = 21) in whom MRD was quantified in BM.
In addition, we evaluated the clinical course of the 12 patients with a VAF >5% in the CR sample before alloHCT, who were initially excluded from analysis. Baseline characteristics and genetic profiles were similar among these patients and the remaining 96 patients and were similar when compared with the 43 MRD+ and 53 MRD− patients (supplemental Tables 7 and 8). CIR and NRM of these 12 patients were similar to those of MRD+ patients (8 patients relapsed after alloHCT), whereas OS had an intermediate course between MRD+ and MRD− patients (supplemental Figure 11). Combining the 43 MRD+ patients and the 12 patients with a VAF >5% in CR into 1 group and comparing these 55 patients with the 53 MRD− patients confirmed the strong negative prognostic effect of persisting mutations in CR before alloHCT (supplemental Figure 12; supplemental Tables 9 and 10).
In a subset analysis of 19 patients, we used DNMT3A as an MRD marker. DNMT3A was positive in 15 patients and negative in 4 patients. All positive patients had VAFs >5% (range, 6%-46.8%). Of the 15 DNMT3A+ patients, 9 were positive using the alternative MRD marker, and only 5 of the 15 patients relapsed. CIR/NRM, RFS, and OS were similar between patients with and without persistence of DNMT3A in CR before alloHCT (data not shown). In summary, NGS-MRD positivity was associated with a poor prognosis independently of other prognostic risk factors.
Accuracy of NGS-MRD and clonal evolution
The overall PPV and NPV of the MRD results to predict relapse were 62.8% and 84.9% in our cohort of 96 patients, respectively, with an overall accuracy of 75%. The lower PPV may reflect the fact that patients received an aggressive treatment after the MRD test, which may have eradicated disease in some patients. Previous studies showed that mutations in some genes are more stable between diagnosis and relapse than in other genes.25,26 To determine which genes might be preferred over others as MRD markers, we compared the PPV and NPV for genes that were studied in at least 6 patients. IDH1, IDH2, STAG1/STAG2, and KRAS were associated with a high NPV, suggesting that a negative MRD result for these genes reliably predicts a low risk of relapse. KRAS, NRAS, SF3B1, and TP53 mutations were associated with a moderate to high PPV, suggesting that an MRD+ result for these genes reliably predicts a high risk of relapse (supplemental Table 11).
Sixteen patients were MRD+ in CR before alloHCT but did not relapse after a median follow-up of 3.43 years (range, 0.33-8.9 years). In 9 of these patients, MRD was measured in peripheral blood, and in 7 patients, it was measured in bone marrow before alloHCT. AlloHCT may have eradicated residual disease in these patients, whose characteristics are listed in supplemental Table 12. This explanation was supported by evaluating the MRD marker at day 90 after alloHCT; in 13 relapse-free patients with an available sample after alloHCT, the MRD marker was negative at day 90 after alloHCT (data not shown).
To identify potential markers of MRD+ patients that may predict sensitivity to alloHCT, we compared clinical and molecular characteristics of the 16 MRD+ patients who never relapsed after alloHCT with those of all other patients. MRD+ patients who never relapsed after alloHCT more often had received only 1 cycle of chemotherapy before alloHCT, suggesting that 1 cycle of chemotherapy was not sufficient to eradicate MRD in these patients, as it would be expected, whereas these patients were chemotherapy sensitive and cleared their residual disease with the additional chemotherapy applied during conditioning treatment. MRD+ patients who never relapsed after alloHCT more often had an HCT comorbidity index score >2 and by trend a lower WBC count and a higher platelet count at diagnosis (supplemental Table 13). They also more often had mutations in BCOR, RUNX1, SETBP1, and SMC3 and by trend less frequently had mutations in FLT3-ITD compared with all other patients (supplemental Table 14).
Eight patients were MRD− in CR but relapsed after alloHCT (patients with false-negative MRD results; patient characteristics are shown in supplemental Table 15). The relapse sample was available for 6 of these patients. In 5 patients (83%), the reason for false-negative MRD was clonal evolution leading to loss of the MRD marker at relapse (supplemental Figure 13). For 1 patient, the MRD marker (FLT3) was missed in CR, but it was present at relapse.
In summary, our MRD analysis had a higher NPV than PPV, suggesting that patients with a low risk of relapse can be more reliably detected by an MRD− result. Patients who received only 1 cycle of chemotherapy before alloHCT were more often MRD+ than patients who received 2 or 3 cycles of chemotherapy. Residual leukemic clones with BCOR, RUNX1, SETBP1, and SMC3 mutations seemed sensitive to alloHCT.
Discussion
We provide evidence that NGS-MRD monitoring can be applied to a large proportion of AML patients using almost any available molecular aberration and that it is highly predictive of relapse and survival when assessed in CR before alloHCT.
This error-corrected sequencing approach allowed us to decrease the lower limit of detection to 0.005% (eg, mutant IDH1) and showed a median background error of 0.0071% and a median sensitivity threshold of 0.015%. Prior published studies using NGS for MRD or mutational clearance monitoring examined a detection level that was significantly higher (eg, VAF, 2%-2.5%).27-29 A few recent studies have also optimized the NGS detection level to <2%.30-33 It was shown that ultrasensitive NGS improves relapse prediction.30 To overcome the general NGS error rate of up to 1% and reliably increase the sensitivity of NGS below that level, we had to adjust and refine the NGS approach. These refinements included the use of NGS-grade PCR primers with random barcodes for error correction,19,21,34 a proof-reading polymerase, avoidance of barcode contamination in consecutive sequencing runs, and standardized bioinformatic approaches for error correction that could be automated (Figure 1). Compared with MRD with multiparametric flow cytometry, the NGS-based approach can be more easily standardized, which is important for routine clinical use.35 Getta et al29 showed that flow-MRD performed similarly to NGS-MRD, using a 5% VAF cutoff. However, a recent study in adult AML also proved that NGS was more sensitive compared with flow-MRD.32
Our analysis included peripheral blood and bone marrow as specimens for MRD assessment. We received a similar percentage of MRD+ patients irrespective of the specimen type, suggesting that peripheral blood could also be used for NGS-MRD monitoring, as already shown for NPM1.3 However, additional studies directly comparing both specimen types are needed to assess the level of achievable sensitivity.
A high sensitivity of error-corrected NGS-MRD assessment was confirmed by comparing NGS-MRD with the current gold standard of qRT-PCR in NPM1-mutated patients. NGS-MRD may become useful for rare NPM1 mutations, because only 1 primer pair is required to cover all potential NPM1 mutations. More importantly, this technique can be applied in the large group of AML patients who do not carry a NPM1 mutation. Ninety-three percent of our patients had at least 1 mutation other than NPM1 or DNMT3A using a custom myeloid sequencing panel with 46 genes. This is consistent with other reports7,36 but may be improved to nearly 100% by exome sequencing.37 In 10% of our patients, the MRD marker persisted in morphologic CR with a VAF >5%, which may indicate persistence of the mutation in differentiated leukemic cells,38 preexisting clonal hematopoiesis,14-17 or germ line origin.39 We excluded DNMT3A mutations upfront because they are often associated with persistence of an ancestral clone19,40 and are not predictive for MRD analysis.12,13,32,41 Other genes, which had been associated with persistence of an ancestral clone with leukemic potential, persisted with high VAF in our analysis (VAF >5% in CR before alloHCT: ASXL2, CBL, IDH1, IDH2, PPM1D, STAG2, and TET2), whereas other persisting gene mutations previously had not been associated with clonal hematopoiesis (CUX1 and ETV6).11 We and others have proven that patients with persistence of an ancestral clone had clonal hematopoiesis several years before AML was diagnosed.19,40 However, mutations in IDH1, IDH2, and TET2 were reliable MRD markers in other patients in our cohort, suggesting that mutations in genes associated with clonal hematopoiesis may provide important information about the disease course. This underscores that clonal hematopoiesis influences MRD detection in a complex manner.41 Additional studies are needed to guide us on how to interpret persistence of an ancestral clone with leukemic potential for MRD detection. The introduction of treatments leading to maturation of leukemic blasts (eg, IDH inhibitors) might further complicate the VAF cutoff. More data are needed to assess whether genes that indicate the persistence of an ancestral clone with leukemic potential may be used as MRD markers in cases where no other mutations are available. Our study is limited by the use of only 1 to 3 MRD markers per patient rather than the whole gene panel to monitor clonal evolution.42 However, we focused on a high detection sensitivity, aiming at a read depth of 1 million reads per marker, corresponding to one-twentieth of a high-quality MiSeq run. Generally, NGS-MRD is advantageous because it is flexible, applicable to many patients, and easy to standardize. Limitations of this technique are currently clonal evolution of the cells and the need to further increase the sensitivity of the assay. Although the ideal turnaround time for this technique is 5 days, in real life, several factors including number of samples can influence the time for analysis, leading to a realistic turnaround time of 2 to 3 weeks. Germ line mutations and clonal persistence can be clearly identified and do not pose major hurdles.
In summary, we show that sensitive NGS-MRD is widely applicable to AML patients, is highly predictive of relapse and survival when measured in CR before alloHCT, and may help refine transplantation and posttransplantation management in AML patients.
The online version of this article contains a data supplement.
The publication costs of this article were defrayed in part by page charge payment. Therefore, and solely to indicate this fact, this article is hereby marked “advertisement” in accordance with 18 USC section 1734.
Acknowledgments
The authors thank Elke Dammann, Patricia Hanel, Silvia Horter, Monika Krappe, Marlene Reuter, and Melanie Drenker for technical assistance.
This study was supported by the German Federal Ministry of Education and Research grant 01EO0802 (Integrated Research and Treatment Center Transplantation); grants 110284 and 110292 from Deutsche Krebshilfe; grant DJCLS R13/14 from the Deutsche José Carreras Leukämie-Stiftung e.V.; Deutsches Forschungszentrum für Gesundheit und Umwelt grants HE 5240/5-1, HE 5240/6-1, Sonderforschungsbereich 1074 project B3, and Heisenberg-Professur BU 1339/8-1; European Research Council grant 638035 under the European Union Horizon 2020 Research and Innovation Programme; and grants from Dieter-Schlag Stiftung.
Authorship
Contribution: F.T. and M.H. designed and performed research, analyzed and interpreted data, and wrote the manuscript; R.G. performed research, analyzed and interpreted data, and wrote the manuscript; A.L., P.K., J.S., C. Kandziora, M.F., M.P., M.W., B.N., K.B., B.H., and S.K. performed research and analyzed and interpreted data; and L.H., M.S., C. Koenecke, A.C., A.K., G.G., B.S., V.I.G., L.B., W.F., A.H., I.H., M.E., J.K., R.F.S., P.P., K.D., H.D., and A.G. analyzed and interpreted data.
Conflict-of-interest disclosure: The authors declare no competing financial interests.
Correspondence: Michael Heuser, Department of Hematology, Hemostasis, Oncology, and Stem Cell Transplantation, Hannover Medical School, Carl-Neuberg Str 1, 30625 Hannover, Germany; e-mail: heuser.michael@mh-hannover.de; Felicitas Thol, Department of Hematology, Hemostasis, Oncology, and Stem Cell Transplantation, Hannover Medical School, Carl-Neuberg Str 1, 30625 Hannover, Germany; e-mail: thol.felicitas@mh-hannover.de.

This feature is available to Subscribers Only
Sign In or Create an Account Close Modal