

Key Points
TIGIT expression is upregulated on CD8+ T cells during MM progression and is associated with impaired effector functions.
TIGIT deficiency or blockade protects mice against MM and improves effector functions of myeloma patient CD8+ T cells.

Abstract
Immune-based therapies hold promise for the treatment of multiple myeloma (MM), but so far, immune checkpoint blockade targeting programmed cell death protein 1 has not proven effective as single agent in this disease. T-cell immunoglobulin and ITIM domains (TIGIT) is another immune checkpoint receptor known to negatively regulate T-cell functions. In this study, we investigated the therapeutic potential of TIGIT blockade to unleash immune responses against MM. We observed that, in both mice and humans, MM progression was associated with high levels of TIGIT expression on CD8+ T cells. TIGIT+ CD8+ T cells from MM patients exhibited a dysfunctional phenotype characterized by decreased proliferation and inability to produce cytokines in response to anti-CD3/CD28/CD2 or myeloma antigen stimulation. Moreover, when challenged with Vk*MYC mouse MM cells, TIGIT-deficient mice showed decreased serum monoclonal immunoglobulin protein levels associated with reduced tumor burden and prolonged survival, indicating that TIGIT limits antimyeloma immune responses. Importantly, blocking TIGIT using monoclonal antibodies increased the effector function of MM patient CD8+ T cells and suppressed MM development. Altogether our data provide evidence for an immune-inhibitory role of TIGIT in MM and support the development of TIGIT-blocking strategies for the treatment of MM patients.
Introduction
Multiple myeloma (MM) is a largely incurable hematological cancer characterized by the expansion of malignant plasma cells in the bone marrow (BM) that secrete circulating monoclonal immunoglobulin proteins (M-proteins).1 Immunotherapies are now being explored in MM and bring hope for a potential cure.2 Inhibitors of immune checkpoints have emerged as a powerful strategy to overcome tumor-induced immunosuppression.3 In particular, monoclonal antibodies (mAbs) blocking programmed cell death protein 1 (PD-1)–programmed cell death ligand 1 interaction have shown significant clinical efficacy in a number of malignancies.4 However, as a single agent, the anti–PD-1 mAb nivolumab failed to show efficacy in a cohort of 27 relapsed/refractory patients with MM,5 indicating that additional immune checkpoints might restrain immune responses against MM.
T-cell immunoglobulin and ITIM domains (TIGIT) is an inhibitory molecule expressed on lymphocytes that competes with the activating receptor DNAX-accessory molecule 1 (CD226) and the inhibitory receptors CD96 and CD112R for the binding of CD155 and CD112.6,7 TIGIT recently emerged as an attractive target for cancer immunotherapy8,9 and anti-TIGIT mAbs are currently being tested in phase 1 clinical trial in patients with advanced or metastatic tumors (www.clinicaltrials.gov; NCT02794571). In this study, we investigated the therapeutic potential of targeting TIGIT in MM.
Study design
Mice
C57BL/6 wild-type (WT) mice were purchased from the Walter and Eliza Hall Institute for Medical Research. C57BL/6 Tigit−/− mice10 were kindly provided by Bristol-Myers Squibb. C57BL/KaLwRijHsd mice were kindly provided by Peter Croucher (Garvan Institute of Medical Research, Darlinghurst, Australia). Mice were bred and maintained at QIMR Berghofer Medical Research Institute and used when 8 to 20 weeks old. All experiments were approved by the QIMR Berghofer Medical Research Institute Animal Ethics Committee.
Preclinical MM models
Experiments with Vk*MYC MM cell lines11 (Vk12653 and Vk12598) and a 5TGM1 MM cell line12 were performed as previously described.13 For some experiments, mice were treated with blocking anti-TIGIT mAbs (4B1, Bristol-Myers Squibb) and anti–PD-1 mAbs (RMP1-14; Bio X Cell) or depleting anti-CD8β mAbs (53-5.8; Bio X Cell), as indicated.
MM patient samples
All patients gave written informed consent and collection was approved by Institut Universitaire du Cancer de Toulous–Oncopole and the Centre Hospitalier Universitaire–Toulouse review boards. Fresh BM aspirates from patients with MM were collected at the time of diagnosis or relapse in the Institut Universitaire du Cancer de Toulous–Toulouse (France) were depleted of malignant plasma cells using anti–CD138-coated magnetic beads (Miltenyi Biotec, France). Fresh BM aspirates from healthy donors were purchased from Lonza.
Human T-cell functional assays
CD138− BM cells or sorted CD8+ T cells (MoFLo Astrios cell sorter, Beckman Coulter) were stimulated with anti-CD3/CD28/CD2 microbeads (T-cell activation/expansion kit, Miltenyi Biotec) or NY-ESO-1157-165 analog (SLLMWITQA, Peptide 2.0 Inc, 1 μg/mL) with or without anti-TIGIT blocking mAbs (10 μg/mL, MBSA43, eBioscience). Intracellular cytokine staining was performed after 6 hours in the presence of antigen-presenting cell–conjugated anti-CD107a (H4A3, BD Biosciences) and GolgiPlug (BD Biosciences). Cytokine levels were measured in the cell culture supernatants by CBA (BD Biosciences) after 24 hours. Alternatively, cells were stained with Cell Trace Violet (CTV, Thermo Fisher Scientific) before anti-CD3/CD28/CD2 microbead stimulation followed by CTV dilution assessment 5 days later.
Flow cytometry
Single-cell suspensions were stained according to standard protocols with previously described anti-mouse antibodies,13 anti-mouse TIGIT (1G9), or anti-human CD3 (HIT3a), CD8α (SK1), CD45RA (HI100), CD62L (DREG-56), CD69 (FN50), CD107a (H4A3), TIGIT (MBSA43), LAG-3 (3DS223H), PD1 (EH12.1), CTLA-4 (BNI3), Tim-3 (7D3), anti–interferon-γ (IFN-γ [B27]), or anti–tumor necrosis factor-α (TNF-α [MAB11]). MM patient CD8+ T cells were stained with phycoerythrin-labeled HLA-A2/NY–ESO-1157-165 (SLLMWITQA) multimers as described previously.14 Antibodies were purchased from eBioScience, BioLegend, or BD Biosciences. Data were collected with LSR Fortessa Flow Cytometer (Becton Dickinson) and analyzed with FlowJo (Tree Star).
Statistics
Statistical analyses were performed with GraphPad Prism software using the indicated test. Data were considered to be statistically significant when P ≤ .05.
Results and discussion
First, we analyzed TIGIT expression on immune cells in C57BL/6 WT mice. Although TIGIT was undetectable on BM CD8+ T cells in naïve mice, it was induced following challenge with Vk12653 MM cells and the percentages of TIGIT+ CD8+ T cells correlated with myeloma burden (Figure 1A-B). We also observed TIGIT expression on 30% to 40% of BM CD4+FoxP3+ Tregs in both naïve and MM-bearing mice, but TIGIT was undetectable on FoxP3− CD4+ effector T and natural killer cells (data not shown). BM CD8+ T cells from newly diagnosed or relapsed patients with MM expressed higher levels of TIGIT than healthy donors (Figure 1C). By contrast, natural killer cells and CD4+ T cells expressed moderate levels of TIGIT (data not shown). Compared with other inhibitory molecules, TIGIT was more frequently expressed on MM patient CD8+ T cells (Figure 1D), suggesting that TIGIT represents a major immune checkpoint in MM. TIGIT was preferentially expressed on memory CD8+ T cells (Figure 1E) and was associated with higher PD-1, CD244, and KLRG1 and lower CD226 expression (data not shown). Of note, no correlation was observed between TIGIT and other inhibitory receptors CD96, CD112R, LAG-3, CTLA-4, or Tim-3 or its ligands CD155 and CD112 on human MM cells (data not shown).15 Altogether our observations suggest a role for TIGIT-CD155/CD112 interactions in MM pathology.

TIGIT expression on CD8+T cells increases during MM development and is associated with decreased effector cell functions. (A) TIGIT expression on BM CD8+ T cells was analyzed by flow cytometry in naïve C57BL/6 WT mice (N) and 1, 2, 3, and 4 weeks after IV challenge with 2 × 10⁶ Vk12653 MM cells. Data are presented as mean ± standard error of the mean (SEM) of 2 pooled experiments with n = 6 to 14 mice per group. (B) Percentages of BM TIGIT+CD8+ T cells from Vk12653-MM–challenged mice shown in panel A were plotted against percentages of BM MM cells in these mice. (C) Graphs showing the mean ± standard deviation percentage of TIGIT+ CD8+ T cells in BM CD8+ T cells from healthy donors (HDs) (n = 20) and MM patients at diagnosis (n = 86) or after relapse (n = 32). (D) The expression of immune checkpoints was analyzed on MM patient BM CD8+ T cells by flow cytometry. Graphs show mean ± SEM from n = 16 to 26 patients with MM. (E) Representative histogram showing the expression of TIGIT on MM patient BM CD8+ T-cell subsets TN (CD62L+CD45RA+), TCM (CD62L+CD45RA−), TEM (CD62L−CD45RA−), and TEMRA (CD62L−CD45RA+) and graph recapitulating the percentage of TIGIT+ cells shown as mean ± SEM from n = 59 MM patients. (F) MM patient CD138− BM cells were stimulated with anti-CD3/CD28/CD2 microbeads for 6 hours. Activation (CD69), intracellular TNF-α, and IFN-γ content and degranulation (CD107a) of TIGIT− and TIGIT+ CD8+ T cells was determined by flow cytometry. Representative dot plots are shown as well as graphs displaying mean ± SEM from n = 31 patients with MM. (G) MM patient CD138− BM cells were stained with CTV and stimulated with anti-CD3/CD28/CD2 microbeads for 5 days. Representative histogram showing the proliferation of TIGIT− (dark red) and TIGIT+ (light red) CD8+ T cells and graph recapitulating the percentage of divided TIGIT− and TIGIT+ CD8+ T cells from the same culture (n = 20 MM patients). (H) TIGIT− and TIGIT+ CD8+ T cells were sorted by flow cytometry and stimulated with anti-CD3/CD28/CD2 microbeads for 6 hours. TNF-α and IFN-γ production as well as degranulation were determined by flow cytometry. Data shown are from n = 8 to 12 MM patients. (I) Representative dot plot of CD8+ BM T cells from HLA-A*02+ patients with MM stained with HLA-A*02-NYESO1-PE multimers (left) and histogram showing the TIGIT expression in NY-ESO1–specific CD8+ T cells (right). (J) MM patient CD138− BM cells were stimulated with HLA-A*02-NY-ESO-1–specific peptide (1 μg/mL) for 6 hours. Representative dot plots as well as pooled data from n = 6 HLA-A2+ MM patients with positive NY-ESO response are shown. Statistical differences between multiple groups were determined by (A,D-E) 1-way analysis of variance (ANOVA) with Tukey posttest analysis, (B) correlations were assessed using a Pearson rank correlation test, and (C) analyses between 2 groups were performed using a Mann-Whitney U test or (F-H,J) Wilcoxon matched-pairs signed rank test. *P < .05, **P < .01, ***P < .001, ****P < .0001. TCM, central memory; TEM, effector memory; TEMRA, terminal effector memory; TN, naïve.
TIGIT expression on CD8+T cells increases during MM development and is associated with decreased effector cell functions. (A) TIGIT expression on BM CD8+ T cells was analyzed by flow cytometry in naïve C57BL/6 WT mice (N) and 1, 2, 3, and 4 weeks after IV challenge with 2 × 10⁶ Vk12653 MM cells. Data are presented as mean ± standard error of the mean (SEM) of 2 pooled experiments with n = 6 to 14 mice per group. (B) Percentages of BM TIGIT+CD8+ T cells from Vk12653-MM–challenged mice shown in panel A were plotted against percentages of BM MM cells in these mice. (C) Graphs showing the mean ± standard deviation percentage of TIGIT+ CD8+ T cells in BM CD8+ T cells from healthy donors (HDs) (n = 20) and MM patients at diagnosis (n = 86) or after relapse (n = 32). (D) The expression of immune checkpoints was analyzed on MM patient BM CD8+ T cells by flow cytometry. Graphs show mean ± SEM from n = 16 to 26 patients with MM. (E) Representative histogram showing the expression of TIGIT on MM patient BM CD8+ T-cell subsets TN (CD62L+CD45RA+), TCM (CD62L+CD45RA−), TEM (CD62L−CD45RA−), and TEMRA (CD62L−CD45RA+) and graph recapitulating the percentage of TIGIT+ cells shown as mean ± SEM from n = 59 MM patients. (F) MM patient CD138− BM cells were stimulated with anti-CD3/CD28/CD2 microbeads for 6 hours. Activation (CD69), intracellular TNF-α, and IFN-γ content and degranulation (CD107a) of TIGIT− and TIGIT+ CD8+ T cells was determined by flow cytometry. Representative dot plots are shown as well as graphs displaying mean ± SEM from n = 31 patients with MM. (G) MM patient CD138− BM cells were stained with CTV and stimulated with anti-CD3/CD28/CD2 microbeads for 5 days. Representative histogram showing the proliferation of TIGIT− (dark red) and TIGIT+ (light red) CD8+ T cells and graph recapitulating the percentage of divided TIGIT− and TIGIT+ CD8+ T cells from the same culture (n = 20 MM patients). (H) TIGIT− and TIGIT+ CD8+ T cells were sorted by flow cytometry and stimulated with anti-CD3/CD28/CD2 microbeads for 6 hours. TNF-α and IFN-γ production as well as degranulation were determined by flow cytometry. Data shown are from n = 8 to 12 MM patients. (I) Representative dot plot of CD8+ BM T cells from HLA-A*02+ patients with MM stained with HLA-A*02-NYESO1-PE multimers (left) and histogram showing the TIGIT expression in NY-ESO1–specific CD8+ T cells (right). (J) MM patient CD138− BM cells were stimulated with HLA-A*02-NY-ESO-1–specific peptide (1 μg/mL) for 6 hours. Representative dot plots as well as pooled data from n = 6 HLA-A2+ MM patients with positive NY-ESO response are shown. Statistical differences between multiple groups were determined by (A,D-E) 1-way analysis of variance (ANOVA) with Tukey posttest analysis, (B) correlations were assessed using a Pearson rank correlation test, and (C) analyses between 2 groups were performed using a Mann-Whitney U test or (F-H,J) Wilcoxon matched-pairs signed rank test. *P < .05, **P < .01, ***P < .001, ****P < .0001. TCM, central memory; TEM, effector memory; TEMRA, terminal effector memory; TN, naïve.
Next, we stimulated CD138− BM cells from patients with MM with anti-CD3/CD28/CD2 microbeads and compared effector functions of TIGIT+ and TIGIT− CD8+ T cells. Although CD69 expression revealed that both subsets were activated, TIGIT+ CD8+ T cells produced limited amounts of TNFα and IFNγ (Figure 1F). The terminally differentiated phenotype of TIGIT+ T cells in patients with MM and their decreased capacity to produce cytokines were reminiscent of the features of exhausted TIGIT+ CD8+ T cells previously reported in patients with acute myeloid leukemia16 However, in contrast with observations in acute myeloid leukemia,16 MM patient TIGIT+ CD8+ T cells also exhibited decreased CD107a expression, indicating poor killing capability (Figure 1F) as well as reduced proliferative capacity (Figure 1G). Similar results were obtained when TIGIT+ and TIGIT− CD8+ T cells were sorted before stimulation, demonstrating that differences were not caused by modulation of TIGIT expression during the assay (Figure 1H). TIGIT+ and TIGIT− populations were also present among NY-ESO-1 MM antigen-specific CD8+ T cells (Figure 1I), and TIGIT expression was again associated with reduced TNFα production of CD8+ T cells upon stimulation with NY-ESO-1 peptide (Figure 1J). Although these results demonstrate that a significant fraction of TIGIT+ CD8+ T cells within the BM of patients with MM have antimyeloma reactivity, we cannot firmly exclude that TIGIT upregulation on CD8+ T cells might be a more general phenomenon and the consequence of chronic exposure to inflammatory mediators frequently associated with myeloma development.17,18 Still, these results establish that in MM, TIGIT expression defines a subset of exhausted CD8+ T cells with severely impaired effector function.
To investigate TIGIT’s role in MM pathogenesis in vivo, WT and Tigit−/− mice were challenged with Vk12653 MM cells. After 6 weeks, M-protein levels were significantly higher in the sera of WT mice (Figure 2A); this was associated with improved survival of Tigit−/− mice (Figure 2B). The advantage conferred by host TIGIT deficiency against MM was confirmed with another MM cell line, Vk12598 (Figure 2C). Interestingly, depletion of CD8+ T cells strongly increased MM burden in Tigit−/− mice (Figure 2D-F), demonstrating that CD8+ T cells play a crucial role in the protection of Tigit−/− mice against MM. Finally, we analyzed the therapeutic potential of blocking TIGIT function. Treatment with an anti-TIGIT mAbs significantly reduced tumor burden in an aggressive Vk12653 MM model (Figure 2G-H) and prolonged the survival of VK12598 MM-bearing mice in a CD8+ T cell–dependent manner (Figure 2I-J). This effect was significant compared with anti–PD-1 mAb therapy (Figure 2I) and comparable to what we had previously reported when targeting CD137 in the same MM model.13 Anti-TIGIT mAbs treatment was also efficient in the preclinical 5TGM1 MM model (Figure 2K) and in the context of stem cell transplantation.19 Moreover, mAbs blocking TIGIT function significantly improved cytokine production and degranulation of MM patient CD8+ T cells (Figure 2L-M).
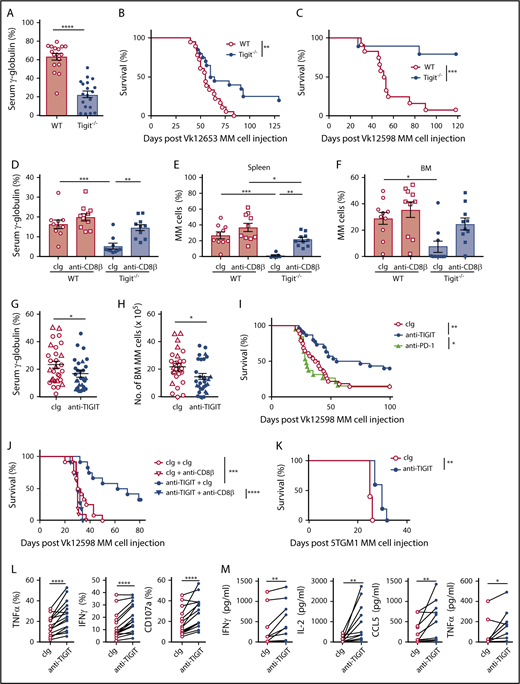
TIGIT blockade improves MM patient CD8+T-cell effector functions and protects mice against MM. (A-B) C57BL/6 WT and Tigit−/− mice were challenged IV with 2 × 10⁶ Vk12653 MM cells. M-protein levels were determined (A) by serum electrophoresis at week 6 post-MM cell injection; (B) survival was monitored overtime. Data are pooled from 2 independent experiments with n = 17 to 19 mice per group. (C) C57BL/6 WT and Tigit−/− mice were challenged IV with 4 × 10⁵ Vk12598 MM cells and monitored for survival. Data shown are from 1 experiment representative of 2, with n = 10 to 12 mice per group. (D-F) C57BL/6 WT and Tigit−/− mice were challenged IV with 1.6 × 10⁶ Vk12653 cells on day 0 and treated with anti-CD8β mAbs or cIg (100 μg, IP) on days −1, 0, 7, 14, 21, and 28. At week 4 after MM inoculation, M-protein levels were determined by serum electrophoresis and myeloma burden in (E) spleen and (F) BM was determined by flow cytometry by gating on B220−CD138+CD155+ MM cells. Data are from 1 experiment with n = 10 mice per group. (G,H) C57BL/6 WT mice were challenged with 1.5 × 10⁶ (triangles) or 2.0 × 10⁶ (circles) Vk12653 MM cells, treated with anti-TIGIT mAbs or cIg (200 μg, IP) twice per week for 4 weeks. Graphs showing the (G) serum γ-globulin levels and (H) number of BM MM cells. Data are presented from 3 independent experiments with n = 29 per group. (I-J) C57BL/6 WT were challenged with 4 × 10⁵ Vk12598 MM cells, treated with anti-TIGIT mAbs, anti-PD-1 mAbs, or cIg (200 μg, IP) twice per week for 4 weeks and monitored for survival. (I) Data are pooled from 3 independent experiments with n = 19 to 30 mice per group. (J) Mice were treated with anti-CD8β mAbs or cIg (100 μg) days −1, 0, 7, 14, 21, and 28 (n = 11 to 12 per group). (K) C57BL/KaLwRijHsd mice (n = 5 per group) were challenged with 2 × 10⁶ 5TGM1 MM cells, treated with anti-TIGIT mAbs or cIg (200 μg, IP) twice per week for 4 weeks and monitored for survival. (L) MM patient CD138− BM cells were stimulated by anti-CD3/CD28/CD2 microbeads for 6 hours in the presence of anti-TIGIT mAbs (10 μg/mL) or cIg. Graphs showing the frequencies of TNFα-, IFNγ-, and CD107a-positive CD8+ T cells (n = 16 MM patients). (M) Graphs showing the concentrations of the indicated cytokines in the supernatants of purified MM patient BM CD8+ T cells stimulated by anti-CD3/CD28/CD2 microbeads for 24 hours in the presence of anti-TIGIT mAbs (10 μg/mL) or cIg (n = 11 patients with MM). (A,D-H) Data are presented as mean ± SEM, with each symbol representing an individual mouse. Statistical differences between multiple group were determined by 1-way ANOVA (D-F) with Tukey posttest analysis; differences between 2 groups were assessed using a (A) Mann-Whitney U, 2-way ANOVA (G-H), or (L-M) Wilcoxon matched-pairs signed rank test; (B-C,I-K) Differences in survival were determined by log-rank sum test. *P < .05; **P < .01, ***P < .001, ****P < .0001. cIg, control immunoglobulin; IP, intraperitoneal.
TIGIT blockade improves MM patient CD8+T-cell effector functions and protects mice against MM. (A-B) C57BL/6 WT and Tigit−/− mice were challenged IV with 2 × 10⁶ Vk12653 MM cells. M-protein levels were determined (A) by serum electrophoresis at week 6 post-MM cell injection; (B) survival was monitored overtime. Data are pooled from 2 independent experiments with n = 17 to 19 mice per group. (C) C57BL/6 WT and Tigit−/− mice were challenged IV with 4 × 10⁵ Vk12598 MM cells and monitored for survival. Data shown are from 1 experiment representative of 2, with n = 10 to 12 mice per group. (D-F) C57BL/6 WT and Tigit−/− mice were challenged IV with 1.6 × 10⁶ Vk12653 cells on day 0 and treated with anti-CD8β mAbs or cIg (100 μg, IP) on days −1, 0, 7, 14, 21, and 28. At week 4 after MM inoculation, M-protein levels were determined by serum electrophoresis and myeloma burden in (E) spleen and (F) BM was determined by flow cytometry by gating on B220−CD138+CD155+ MM cells. Data are from 1 experiment with n = 10 mice per group. (G,H) C57BL/6 WT mice were challenged with 1.5 × 10⁶ (triangles) or 2.0 × 10⁶ (circles) Vk12653 MM cells, treated with anti-TIGIT mAbs or cIg (200 μg, IP) twice per week for 4 weeks. Graphs showing the (G) serum γ-globulin levels and (H) number of BM MM cells. Data are presented from 3 independent experiments with n = 29 per group. (I-J) C57BL/6 WT were challenged with 4 × 10⁵ Vk12598 MM cells, treated with anti-TIGIT mAbs, anti-PD-1 mAbs, or cIg (200 μg, IP) twice per week for 4 weeks and monitored for survival. (I) Data are pooled from 3 independent experiments with n = 19 to 30 mice per group. (J) Mice were treated with anti-CD8β mAbs or cIg (100 μg) days −1, 0, 7, 14, 21, and 28 (n = 11 to 12 per group). (K) C57BL/KaLwRijHsd mice (n = 5 per group) were challenged with 2 × 10⁶ 5TGM1 MM cells, treated with anti-TIGIT mAbs or cIg (200 μg, IP) twice per week for 4 weeks and monitored for survival. (L) MM patient CD138− BM cells were stimulated by anti-CD3/CD28/CD2 microbeads for 6 hours in the presence of anti-TIGIT mAbs (10 μg/mL) or cIg. Graphs showing the frequencies of TNFα-, IFNγ-, and CD107a-positive CD8+ T cells (n = 16 MM patients). (M) Graphs showing the concentrations of the indicated cytokines in the supernatants of purified MM patient BM CD8+ T cells stimulated by anti-CD3/CD28/CD2 microbeads for 24 hours in the presence of anti-TIGIT mAbs (10 μg/mL) or cIg (n = 11 patients with MM). (A,D-H) Data are presented as mean ± SEM, with each symbol representing an individual mouse. Statistical differences between multiple group were determined by 1-way ANOVA (D-F) with Tukey posttest analysis; differences between 2 groups were assessed using a (A) Mann-Whitney U, 2-way ANOVA (G-H), or (L-M) Wilcoxon matched-pairs signed rank test; (B-C,I-K) Differences in survival were determined by log-rank sum test. *P < .05; **P < .01, ***P < .001, ****P < .0001. cIg, control immunoglobulin; IP, intraperitoneal.
In conclusion, this study highlights a predominant inhibitory role of TIGIT in anti-MM CD8+ T-cell responses. Our data demonstrate for the first time that blocking the TIGIT pathway prolongs survival in preclinical MM models and improves MM patients’ CD8+ T-cell functions, thereby providing a strong rationale for the evaluation of anti-TIGIT mAbs to treat MM.
The publication costs of this article were defrayed in part by page charge payment. Therefore, and solely to indicate this fact, this article is hereby marked “advertisement” in accordance with 18 USC section 1734.
Acknowledgments
The authors thank Liam Town and Kate Elder for breeding, genotyping, maintenance, and care of the mice used in this study; the animal house and flow cytometry facilities at QIMR Berghofer Medical Research Institute and Cancer Research Center of Toulouse; members of Immunology in Cancer and Infection Laboratory and Cancer Immunoregulation and Immunotherapy Laboratory for helpful suggestions and discussion; and Nathalie Rufer for providing phycoerythrin-labeled NY-ESO-1 multimers.
This study was supported by grants from the University of Queensland (UQ) International Postgraduate Research Scholarship (H.H.); UQ Australian Postgraduate Award and QIMR Berghofer Top-Up awards (H.H. and S.A.M.); National Health and Medical Research Council of Australia Early Career Fellowship (grant 1107417) and a PdCCRS grant from Cure Cancer Australia and Can Too (grant 1122183) (C.G.); Naito Foundation and QIMR Berghofer Seed Grant (K.N.); French National Cancer Institute (grant R16100BB) and Institut Universitaire du Cancer de Toulous–Oncopole translational research program (L.M.); Fondation ARC pour la Recherche sur le Cancer (grant PGA1*20160203788) (Centre de Recherches en Cancérologie de Toulouse team 13), NH&MRC Program Grant (grant 1132519), Project Grant (grant 1098960), and a Senior Principal Research Fellowship (grant 1078671) (M.J.S.); and NH&MRC Program Grant (grant 1071822) and Research Fellowship (grant 1107797) (G.R.H.).
Authorship
Contribution: Study conception and design undertaken by C.G., K.N., L.M., and M.J.S. Data acquired by C.G., H.H., N.C., K.N., Y.Y., M.W., M.C., S.K., T.T., K.M., S.K., K.S., and L.M. Data analyzed and interpreted by C.G., H.H., N.C., K.N., S.K., T.T., L.M., and M.J.S. Manuscript was drafted by C.G. and H.H. Critical revision and editing undertaken by S.K., K.N., S.A.M., G.R.H., W.C.D., H.A.-L., M.W.L.T., L.M., and M.J.S. Supervision done by M.J.S., L.M., G.R.H., and M.W.L.T.
Conflict-of-interest disclosure: M.J.S. has research agreements with Bristol Myers Squibb, Tizona Therapeutics, and Aduro Biotech. W.C.D. has received a speaker’s honorarium from AMGEN. The remaining authors declare no competing financial interests.
Correspondence: Camille Guillerey, QIMR Berghofer Medical Research Institute, 300 Herston Rd, Herston, QLD 4006, Australia; e-mail: camille.guillerey@qimrberghofer.edu.au; and Mark J. Smyth, QIMR Berghofer Medical Research Institute, 300 Herston Rd, Herston, QLD 4006, Australia; e-mail: mark.smyth@qimrberghofer.edu.au.

This feature is available to Subscribers Only
Sign In or Create an Account Close Modal