

Key Points
Myeloma promotes CD8+ T-cell exhaustion and IL-10 secretion from dendritic cells.
PD-1 and TIGIT-targeted checkpoint inhibition is effective after SCT.

Abstract
Autologous stem cell transplantation (SCT) remains a standard of care for multiple myeloma (MM) patients and prolongs progression-free survival. A small cohort of patients achieve long-term control of disease, but the majority of patients ultimately relapse, and the mechanisms permitting disease progression remain unclear. In this study, we used a preclinical model of autologous SCT for myeloma where the disease either progressed (MM relapsed) or was controlled. In the bone marrow (BM), inhibitory receptor expression on CD8+ T cells correlated strongly with myeloma progression after transplant. In conjunction, the costimulatory/adhesion receptor CD226 (DNAM-1) was markedly downregulated. Interestingly, DNAM-1− CD8+ T cells in MM-relapsed mice had an exhausted phenotype, characterized by upregulation of multiple inhibitory receptors, including T-cell immunoglobulin and ITIM domains (TIGIT) and programmed cell death protein 1 (PD-1) with decreased T-bet and increased eomesodermin expression. Immune checkpoint blockade using monoclonal antibodies against PD-1 or TIGIT significantly prolonged myeloma control after SCT. Furthermore, CD8+ T cells from MM-relapsed mice exhibited high interleukin-10 (IL-10) secretion that was associated with increased TIGIT and PD-1 expression. However, while donor-derived IL-10 inhibited myeloma control post-SCT, this was independent of IL-10 secretion by or signaling to T cells. Instead, the donor myeloid compartment, including colony-stimulating factor 1 receptor–dependent macrophages and an IL-10–secreting dendritic cell population in the BM, promoted myeloma progression. Our findings highlight PD-1 or TIGIT blockade in conjunction with SCT as a potent combination therapy in the treatment of myeloma.
Introduction
Multiple myeloma (MM), a largely incurable hematological malignancy, is characterized by clonal expansion of malignant plasma cells in the bone marrow (BM) that produce monoclonal immunoglobulin (M-band).1 In eligible patients, treatment utilizes combinations of immunomodulators, proteasome inhibitors, steroids, and alkylating agents until maximal disease response is documented. This is followed by high-dose chemotherapy and autologous stem cell transplant (auto-SCT).2,3 Auto-SCT remains standard of care and improves progression-free survival; in fact, a small cohort of patients achieve long-term disease control after auto-SCT.4-6 Nevertheless, despite the availability of new therapeutic agents used in combination with auto-SCT, the majority of patients with MM eventually relapse and succumb to disease.
We have developed a preclinical system demonstrating that the therapeutic benefit of auto-SCT lies with the generation of antigen-specific CD8+ T cells that are able to control myeloma progression. However, as in the clinic, a large proportion of mice still relapse. Exhausted T cells have been implicated in disease progression in a number of cancer models7 ; however, the presence of exhausted T cells in myeloma patients has remained controversial.8,9 Moreover, a clinical trial using nivolumab, an anti–programmed cell death protein 1 (PD-1) monoclonal antibody (mAb), as a single agent had limited efficacy in multiply relapsed MM patients.10 Importantly, the activity of immune checkpoint blockade in combination with SCT has not been reported, and the role of immune suppression in facilitating myeloma relapse after SCT has not been addressed in preclinical models. We identify a population of exhausted CD8+ T cells and interleukin-10 (IL-10)–producing myeloid cells in mice with relapsed myeloma after SCT that provide a logical strategy for promoting immune-mediated control of myeloma and improving clinical outcomes.
Materials and methods
Mice
C57BL/6 (B6.WT; CD45.2) and Ptprca (CD45.1) mice were purchased from the Animal Resources Centre (Perth, Western Australia, Australia). B6.IL-10−/− and B6.IL-10-GFPxFoxP3-RFP reporters were bred in-house (QIMR Berghofer Medical Research Institute; Brisbane, Queensland, Australia). CD4cre × IL-10Rfl/fl, CD4cre × IL-10fl/fl, and CD11c cre × IL-10fl/fl mice were provided by C.E. (QIMR Berghofer Medical Research Institute). mApple–colony-stimulating factor 1 receptor (CSF-1R) reporter mice, provided by David Hume (Translational Research Institute. Brisbane, Australia), have been recently described.11 Mice were housed in sterile microisolator cages and received acidified (pH 2.5) autoclaved water and normal chow. All animal procedures were performed in accordance with protocols approved by the institutional animal ethics committee.
Antibodies
Phycoerythrin (PE)–conjugated antibodies to CD155 (4.24.1), CD138 (281-2), LAG-3 (C9B7W), CD45.1 (A20), CD80 (16-10A1), and rat immunoglobulin G2a (IgG2a) and mouse IgG1 isotype controls; AF647-conjugated antibody to CD226 (TX42.1) and CD101 (RM101); fluorescein isothiocyanate (FITC)–conjugated antibody to CD69 (H1.2F3); AF700-conjugated antibodies to F4/80 (BM8), CD62L (MEL-14), and Ly6C (HK1.4); allophycocyanin (APC)–conjugated antibodies to CD11c (N418), CD274 (10F.9G2), and rat IgG2a isotype control; APC-Cy7–conjugated antibodies to CD19 (6D5), Ly6G (1A8), CD38 (90), and CD8 (53-6.7); PerCpCy5.5-conjugated antibody to CD11b (M1/70); BV421-conjugated antibodies to PD-1 (29F.1A12), CD138 (281-2), CD44 (IM7), and rat IgG1 isotype control; BV605-conjugated antibodies to CD90.2 (53-2.1), CD11c (N418), and CD4 (RM4-5); PE-Cy7–conjugated antibodies to CD64 (X54-5/7.1) and PD-1(RMPI-30); Pacific blue–conjugated antibody to major histocompatibility complex (MHC) class II (M5/114.15.2) were purchased from BioLegend. PE-conjugated antibodies to T-bet (ebio4B10), CD135 (A2F10), and TIM3 (RMT3-23); PE-Cy7–conjugated antibody to Eomes (Dan11mag); PE-eFluor610–conjugated antibody to NKp46 (29A1.4); and PerCp-eFluor710–conjugated antibody to TIGIT (GIGD7) were purchased from eBioscience. PerCpCy5.5-conjugated antibody to CD8 (53-6.7), PE-CF594-conjugated antibodies to CD19 (1D3) and CD3 (145-2C11), V450-conjugated antibodies to CD107a (1D4B), and rat IgG2a were purchased from BD Biosciences. FITC-conjugated antibody to CD4 (GK1.5) was produced in-house.
Stem cell transplantation
The Vk*MYC myeloma clone, Vk12653, which originated from Vk*MYC transgenic mice,12,13 was propagated in B6.WT mice. Recipient mice were injected IV with Vk12653 2 weeks prior to SCT (1 × 10⁶ CD138+CD19− cells; MM-bearing mice). MM-bearing recipients were transplanted as described previously14 and illustrated in Figure 1A. Fortnightly serum samples were collected from MM-bearing recipients and M-band was quantified as previously described12 using a Sebia Hydrasys serum protein electrophoresis system (Hydrasys 2 Scan). Briefly, Hydrasys gels were stained with amido black and scanned by an onboard densitometer, and the γ and albumin fractions were quantified to generate a γ/albumin ratio (G/A), hereafter referred to as M-band. Recipients were monitored daily for up to 120 days post-SCT and sacrificed when hindlimb paralysis occurred or clinical scores reached ≥6.15 For some experiments, mice were treated with blocking anti-CSF-1R (M279, Amgen), anti-IL-10R (1B1.3A BioXCell), anti-PD-1 mAb (RMP1-14, Leinco), anti-TIGIT mAbs (4B1, Bristol Myers Squibb), or the appropriate isotype controls (cIg) rat IgG1 (Mac49 produced in-house), rat IgG (Sigma), rat IgG2a (Mac4, produced in-house), and mouse IgG2a (anti-KLH, BMS), respectively. Blocking antibodies and isotypes were administered intraperitoneally twice a week as described in the figure legends.
![CD8+T-cell exhaustion correlates with tumor burden in mice with relapsed myeloma after SCT. MM-bearing or naive (MM-free; green) B6 recipients were lethally irradiated (total body irradiation [TBI], 1000 cGy) and transplanted with B6 donor cells (10 × 106 BM; 5 × 10⁶ T cells). MM-bearing mice were categorized as MM relapsed (above threshold; purple) or MM controlled (below threshold; orange) at 8 weeks after SCT. Mice were sacrificed, BM was harvested, and CD8+ T cells were analyzed using flow cytometry. (A) Illustration of experimental design. (B) Representative histograms and frequency of expression of DNAM-1, TIGIT, PD-1, LAG-3, and TIM-3 (n = 16-21 for MM relapsed; n = 19 for DNAM-1, TIGIT, and PD-1 for MM controlled and MM-free; n = 3-12 for LAG-3 and TIM-3 for MM controlled and MM-free; data are combined from 2 to 7 experiments [LAG-3 MM-free from 1 experiment]). (C) Spearman r correlation of DNAM-1, PD-1, and TIGIT expression on CD8+ T cells with MM cell (CD138+CD19−) number in the BM of MM-bearing mice (n = 36 combined from 7 experiments). (D) Ratio of CD45.1 splenocytes to CFSE-labeled MM (CTL index) was determined in BM of MM-controlled and MM-free mice at 18 hours after transfer of 25 × 106 purity adjusted cells at 3 weeks after SCT (n = 3-4). FACS plots show MM frequency within CFSE+ cells. (E) Histograms and Spearman r correlation of CD107a+ (n = 7 from 1 experiment), IFN-γ+ (n = 14 from 3 experiments), and Ki67+ (n = 7 from 1 experiment) CD8+ T cells in BM with MM cell number. Control represents isotype control staining for CD107a and IFNγ, and staining of myeloma-free mice for Ki67. Data represent mean ± SEM. *P < .05, **P < .01, ***P < .001 (Mann-Whitney U test).](https://ash.silverchair-cdn.com/ash/content_public/journal/blood/132/16/10.1182_blood-2018-01-825240/5/m_blood825240f1.png?Expires=1769115047&Signature=Fav3leqqiQS6EGRmVucH3J59CiqsmLJtkBNORZPqSRpxAqAAudUu5oHWk0HCkaeWgkvmUSp21lkGn9WtIqgfRtIdDkemftHHVU6f4WpBZGnmr-MkNO7QpD6Z9X4v-gHo8HFqQQc76lHyD0ojEtw5o56tcpZSN4~IC4xemPk7oohUHW-SI4Xrgn5y5Lnld53up1GSABMO3awOLbc454B~2VB06JLZEOgA3Jsb6Nn9Pqt-H37-mNVRWtyfA6m0V-mpldp0isEcIaWwbD58pGbWYPuCRg1Hf6Va3R~8TMsgvWq1N7Auf3sNskriY1qTHYXCEIih56gum2rEPsnfFOJ8ig__&Key-Pair-Id=APKAIE5G5CRDK6RD3PGA)
CD8+T-cell exhaustion correlates with tumor burden in mice with relapsed myeloma after SCT. MM-bearing or naive (MM-free; green) B6 recipients were lethally irradiated (total body irradiation [TBI], 1000 cGy) and transplanted with B6 donor cells (10 × 106 BM; 5 × 10⁶ T cells). MM-bearing mice were categorized as MM relapsed (above threshold; purple) or MM controlled (below threshold; orange) at 8 weeks after SCT. Mice were sacrificed, BM was harvested, and CD8+ T cells were analyzed using flow cytometry. (A) Illustration of experimental design. (B) Representative histograms and frequency of expression of DNAM-1, TIGIT, PD-1, LAG-3, and TIM-3 (n = 16-21 for MM relapsed; n = 19 for DNAM-1, TIGIT, and PD-1 for MM controlled and MM-free; n = 3-12 for LAG-3 and TIM-3 for MM controlled and MM-free; data are combined from 2 to 7 experiments [LAG-3 MM-free from 1 experiment]). (C) Spearman r correlation of DNAM-1, PD-1, and TIGIT expression on CD8+ T cells with MM cell (CD138+CD19−) number in the BM of MM-bearing mice (n = 36 combined from 7 experiments). (D) Ratio of CD45.1 splenocytes to CFSE-labeled MM (CTL index) was determined in BM of MM-controlled and MM-free mice at 18 hours after transfer of 25 × 106 purity adjusted cells at 3 weeks after SCT (n = 3-4). FACS plots show MM frequency within CFSE+ cells. (E) Histograms and Spearman r correlation of CD107a+ (n = 7 from 1 experiment), IFN-γ+ (n = 14 from 3 experiments), and Ki67+ (n = 7 from 1 experiment) CD8+ T cells in BM with MM cell number. Control represents isotype control staining for CD107a and IFNγ, and staining of myeloma-free mice for Ki67. Data represent mean ± SEM. *P < .05, **P < .01, ***P < .001 (Mann-Whitney U test).
CD8+T-cell exhaustion correlates with tumor burden in mice with relapsed myeloma after SCT. MM-bearing or naive (MM-free; green) B6 recipients were lethally irradiated (total body irradiation [TBI], 1000 cGy) and transplanted with B6 donor cells (10 × 106 BM; 5 × 10⁶ T cells). MM-bearing mice were categorized as MM relapsed (above threshold; purple) or MM controlled (below threshold; orange) at 8 weeks after SCT. Mice were sacrificed, BM was harvested, and CD8+ T cells were analyzed using flow cytometry. (A) Illustration of experimental design. (B) Representative histograms and frequency of expression of DNAM-1, TIGIT, PD-1, LAG-3, and TIM-3 (n = 16-21 for MM relapsed; n = 19 for DNAM-1, TIGIT, and PD-1 for MM controlled and MM-free; n = 3-12 for LAG-3 and TIM-3 for MM controlled and MM-free; data are combined from 2 to 7 experiments [LAG-3 MM-free from 1 experiment]). (C) Spearman r correlation of DNAM-1, PD-1, and TIGIT expression on CD8+ T cells with MM cell (CD138+CD19−) number in the BM of MM-bearing mice (n = 36 combined from 7 experiments). (D) Ratio of CD45.1 splenocytes to CFSE-labeled MM (CTL index) was determined in BM of MM-controlled and MM-free mice at 18 hours after transfer of 25 × 106 purity adjusted cells at 3 weeks after SCT (n = 3-4). FACS plots show MM frequency within CFSE+ cells. (E) Histograms and Spearman r correlation of CD107a+ (n = 7 from 1 experiment), IFN-γ+ (n = 14 from 3 experiments), and Ki67+ (n = 7 from 1 experiment) CD8+ T cells in BM with MM cell number. Control represents isotype control staining for CD107a and IFNγ, and staining of myeloma-free mice for Ki67. Data represent mean ± SEM. *P < .05, **P < .01, ***P < .001 (Mann-Whitney U test).
Cell preparation for flow cytometry
Recipient mice were sacrificed 4 to 8 weeks after transplant, and cells from BM and spleen were harvested. For surface phenotyping, isolated cells were stained with antibodies and analyzed via flow cytometry. For intracellular staining, cells were surface labeled, fixed, and permeabilized (FoxP3 Transcription Factor Staining Buffer Kit; eBioscience) prior to intracellular staining. To measure cytokine production, cells were stimulated for 4 hours at 37°C with phorbol myristate acetate (PMA; 5 μg/mL) and ionomycin (50 μg/mL) (Sigma-Aldrich) with brefeldin A (BioLegend). To measure CD107a expression, cells were stimulated with PMA/ionomycin in with brefeldin A, monensin (BioLegend), and V450-conjugated CD107a antibody (BD Biosciences) for 5 hours at 37°C. All samples were acquired on a BD LSR Fortessa (BD Biosciences) and analyzed using FlowJo software (v10).
In vivo cytotoxicity assay
An in vivo cytotoxic T lymphocyte (CTL) assay was adapted from a protocol previously described.16 MM-bearing recipients were transplanted and 3 weeks later injected with CD45.1 splenocytes and carboxyfluorescein succinimidyl ester (CFSE; Sigma)–labeled myeloma cells harvested from nontransplanted mice from the same recipient cohorts. Mice were sacrificed 18 hours later, BM was analyzed via flow cytometry, and a ratio of CD45.1 splenocytes to CSFE-myeloma was calculated to generate a CTL index.
Statistical analysis
Data are presented as mean ± standard error of the mean (SEM), and P < .05 was considered significant. Survival curves were plotted using Kaplan-Meier estimates and compared by log-rank (Mantel-Cox) test. Correlations were determined using Spearman r calculations. We assessed tumor growth by modeling log M-band over time using mixed-effects models with random intercepts. To compare tumor growth between groups, we performed least-squares means contrasts, and all contrasts were adjusted for multiple comparisons using Tukey’s honest significant difference test. We empirically estimated the M-band at which mice inevitably progressed. This was derived by assessing whether mice had “progressed” or “not progressed” at each fortnightly bleed. The M-band that maximized the Youden criteria was chosen as the optimal cut point, and this was further internally cross-validated. Across all mice, the optimal M-band for determining progression was 0.282, with a sensitivity and specificity of ∼90% each.
Results
Inhibitory receptor expression on CD8+ T cells correlates with myeloma burden
We used a preclinical model of syngeneic transplant utilizing Vk*MYC myeloma where recipients were either naive (MM-free) or injected with Vk12653 (MM bearing) and were irradiated (TBI; 1000 cGy) and transplanted with syngeneic grafts containing BM and T cells 2 weeks later (Figure 1A). Recipients were sacrificed 8 weeks after SCT, and MM-bearing mice were divided into those that had controlled disease (MM controlled; M-band <0.28) and those that had relapsed (MM relapsed; M-band >0.28), a threshold level as defined in the statistical analysis section of Materials and methods. Interestingly, CD8+ T cells from the BM of MM-relapsed mice had a decreased frequency of DNAM-1 expression and increased frequency of TIGIT, PD-1, LAG-3, and TIM-3 (Figure 1B). There was also a small decrease in DNAM-1 and increase in PD-1 expression in MM-controlled mice compared with MM-free mice; however, no other inhibitory markers were upregulated, and these changes are thus suggestive of T-cell activation by myeloma rather than exhaustion. Importantly, DNAM-1 expression negatively correlated with myeloma cell number in the BM, while TIGIT and PD-1 expression were both positively correlated with myeloma burden (Figure 1C). To understand whether mice transplanted in the presence of myeloma generated a specific immune response to the malignancy, we adapted a previously described16 in vivo CTL assay. This suggested that clearance of myeloma was indeed enhanced in mice with controlled myeloma after transplant (Figure 1D). Furthermore, while T cells in mice with relapsed myeloma after SCT were characterized by CD107a and interferon γ (IFN-γ) expression, the number of these cells in BM was inversely proportional to myeloma burden (Figure 1E). These data suggest that myeloma is promoting a tumor-specific response that is characterized by the downregulation of DNAM-1 and enhanced expression of inhibitory receptors as the disease progresses.
Mice with progressive myeloma harbor exhausted CD8+ T cells defined by the absence of DNAM-1 expression
To further characterize exhaustion in MM-relapsed mice, we used CD62L and CD44 to identify memory and effector CD8+ T-cell subsets in the BM. The CD8+CD62L−CD44+ effector/effector memory T-cell (TEFF/EM) compartment was dramatically expanded in the BM of MM-relapsed mice, to the detriment of both the naive and central memory (CD44+CD62L+) compartments (supplemental Figure 1A, available at the Blood Web site). Furthermore, expression of inhibitory receptors was largely limited to CD8+ TEFF/EM cells (Figure 2A). An important marker of T-cell exhaustion rather than activation is the expression of multiple inhibitory receptors.17 We thus quantified the expression of TIGIT and PD-1 in MM-relapsed mice and found that ∼24% of CD8+ T-cells expressed both receptors while ∼19% expressed TIGIT or PD-1 alone (Figure 2B). Furthermore, 71% of PD-1+ CD8+ T-cells expressed TIM-3 and/or LAG-3 (Figure 2C). We also confirmed that the exhaustion phenotype was irreversible in MM-relapsed mice, as there was an increased frequency of CD101+CD38+CD8+ T cells, which indicates permanent T-cell dysfunction,18 and this was associated with expression of multiple inhibitory receptors (Figure 2D-E). These data demonstrate that CD8+ T cells from MM-relapsed mice express multiple inhibitory receptors and are irreversibly exhausted.
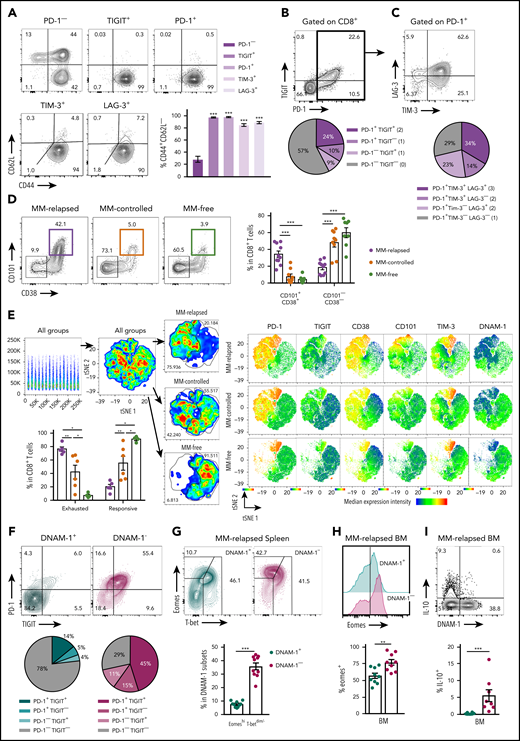
Exhausted CD8+T cells can be defined by lack of DNAM-1 expression in mice with relapsed myeloma after SCT. MM-bearing or naive (MM-free; green) recipients were transplanted as previously described with BM+T grafts from B6 donors. MM-bearing mice were categorized as MM relapsed (purple) or MM controlled (orange) at 6 or 8 weeks after SCT. Mice were sacrificed, BM and spleen were harvested, and CD8+ T cells were analyzed using flow cytometry. FACS plots and histograms are representative. (A-C) Phenotyping performed on CD8+ T cells from BM of MM-relapsed mice. (A) CD44 and CD62L populations in PD-1− or TIGIT+ or PD-1+ or LAG-3+ or TIM-3+ subsets. Frequency of TEFF/EM (CD44+CD62L−) cells within each positive subset was compared with PD-1− cells (n = 5-11 combined from 2 to 4 experiments). (B) Frequency of TIGIT and PD-1 coexpression (n = 13-18 combined from 5 experiments). (C) Frequency of TIM-3 and LAG-3 coexpression on PD-1+ CD8+ T cells from BM of MM-relapsed mice (n = 11 combined from 4 experiments). (D) Frequency of CD101+CD38+ and CD101−CD38− CD8+ T cells (n = 8-11 from 2 experiments) and (E) t-distributed stochastic neighbor embedding (tSNE) analysis and frequency of exhausted and responsive CD8+ T-cell phenotypes in BM of MM-relapsed, MM-controlled, and MM-free mice (n = 4-8; representative of 2 independent experiments). (F) Frequency of PD-1 and TIGIT expression on DNAM-1+ (teal) and DNAM-1− (magenta) subsets (n = 16 combined from 6 experiments). (G) Frequency of EomeshiT-betdim/− CD8+ T cells in DNAM-1+ and DNAM-1− subsets from MM-relapsed mice (n = 10 combined from 2 experiments). (H) Frequency of Eomes expression within DNAM-1+ and DNAM-1− subsets from BM of MM-relapsed mice (n = 10 combined from 2 experiments). (I) Recipients were transplanted with FoxP3-RFP × IL-10-GFP reporter donors. Frequency of IL-10 producing CD8+ T-cells within DNAM-1+ and DNAM-1− subsets in BM of MM-relapsed mice (n = 8 combined from 3 experiments). Data represent mean ± SEM. Mann-Whitney U test. **P < .01, ***P < .001.
Exhausted CD8+T cells can be defined by lack of DNAM-1 expression in mice with relapsed myeloma after SCT. MM-bearing or naive (MM-free; green) recipients were transplanted as previously described with BM+T grafts from B6 donors. MM-bearing mice were categorized as MM relapsed (purple) or MM controlled (orange) at 6 or 8 weeks after SCT. Mice were sacrificed, BM and spleen were harvested, and CD8+ T cells were analyzed using flow cytometry. FACS plots and histograms are representative. (A-C) Phenotyping performed on CD8+ T cells from BM of MM-relapsed mice. (A) CD44 and CD62L populations in PD-1− or TIGIT+ or PD-1+ or LAG-3+ or TIM-3+ subsets. Frequency of TEFF/EM (CD44+CD62L−) cells within each positive subset was compared with PD-1− cells (n = 5-11 combined from 2 to 4 experiments). (B) Frequency of TIGIT and PD-1 coexpression (n = 13-18 combined from 5 experiments). (C) Frequency of TIM-3 and LAG-3 coexpression on PD-1+ CD8+ T cells from BM of MM-relapsed mice (n = 11 combined from 4 experiments). (D) Frequency of CD101+CD38+ and CD101−CD38− CD8+ T cells (n = 8-11 from 2 experiments) and (E) t-distributed stochastic neighbor embedding (tSNE) analysis and frequency of exhausted and responsive CD8+ T-cell phenotypes in BM of MM-relapsed, MM-controlled, and MM-free mice (n = 4-8; representative of 2 independent experiments). (F) Frequency of PD-1 and TIGIT expression on DNAM-1+ (teal) and DNAM-1− (magenta) subsets (n = 16 combined from 6 experiments). (G) Frequency of EomeshiT-betdim/− CD8+ T cells in DNAM-1+ and DNAM-1− subsets from MM-relapsed mice (n = 10 combined from 2 experiments). (H) Frequency of Eomes expression within DNAM-1+ and DNAM-1− subsets from BM of MM-relapsed mice (n = 10 combined from 2 experiments). (I) Recipients were transplanted with FoxP3-RFP × IL-10-GFP reporter donors. Frequency of IL-10 producing CD8+ T-cells within DNAM-1+ and DNAM-1− subsets in BM of MM-relapsed mice (n = 8 combined from 3 experiments). Data represent mean ± SEM. Mann-Whitney U test. **P < .01, ***P < .001.
We next explored the relationship between the absence of DNAM-1 and the expression of inhibitory receptors on CD8+ T cells. In MM-relapsed mice, we found that 78% of DNAM-1+ cells did not express TIGIT or PD-1, while the reverse was true for DNAM-1− cells, where 71% expressed one or both inhibitory receptors (Figure 2F). Changes in the expression of transcription factors eomesodermin (Eomes) and T-bet have also been associated with CD8+ T-cell exhaustion,19,20 with EomeshiT-betdim subsets shown to be terminally exhausted.21 Consistent with this, there was a significantly increased frequency of EomeshiT-betdim CD8+ T cells in the spleen of MM-relapsed mice (supplemental Figure 1B). Interestingly, there was a significant increase in the frequency of EomeshiT-betdim cells in MM-relapsed mice within the CD8+ DNAM-1− T-cell subset, and conversely, DNAM-1+ T cells resembled those from MM-controlled mice (Figure 2G). Furthermore, there was a significantly increased frequency of Eomes expression in DNAM-1− CD8+ T-cells compared with DNAM-1+ in the BM (Figure 2H) and spleen (data not shown) of MM-relapsed mice. IL-10, which can also be associated with exhausted T cells,22,23 is known to be induced by Eomes,24 and consistent with this, the expression of IL-10 was restricted to DNAM-1− CD8+ T cells (Figure 2I). These data suggest that absence of DNAM-1 could function as a surface marker for exhausted CD8+ T cells in MM-relapsed mice and confirms the presence of functionally exhausted T cells in these mice.
T-cell–derived IL-10 is increased in progressive myeloma and is associated with TIGIT and PD-1 expression
Since IL-10 is known to play a role in CD8+ T-cell exhaustion,21 we analyzed IL-10 secretion from T cells in MM-relapsed mice. We transplanted MM-bearing and naive recipients with grafts from IL-10-GFP × FoxP3-RFP donors (whereby GFP is expressed in IL-10–producing cells and RFP expression identifies FoxP3+ cells) and phenotyped BM and splenocytes at 8 weeks after transplant. There was a marked increase in the frequency of IL-10–producing CD8+ T cells from BM and spleen of MM-relapsed compared with MM-controlled and MM-free mice, and this strongly correlated with disease progression in the BM (Figure 3A-C). The same was true for CD4+ T cells, although the correlation with disease progression in the BM was less striking (Figure 3A,D-E). In MM-relapsed mice, the expression of TIGIT and PD-1 was increased on IL-10+ compared with IL-10− conventional CD4+ (FoxP3−), regulatory CD4+ (FoxP3+), and CD8+ T cells (Figure 3F-G), confirming an association between inhibitory receptor expression and IL-10 production in progressive myeloma.
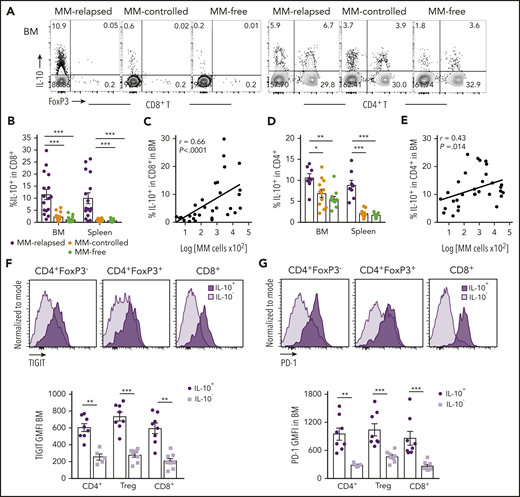
T-cell–derived IL-10 is increased in mice that have relapsed after SCT and is associated with exhaustion. MM-bearing or naive (MM-free; green) recipients were transplanted as previously described with BM+T grafts from FoxP3-RFP × IL-10-GFP reporter B6 donors. MM-bearing mice were categorized as MM-relapsed (purple) or MM-controlled (orange) at 8 weeks after SCT. Mice were sacrificed, BM and spleen were harvested, and T cells were analyzed using flow cytometry. (A) Representative FACS plots of IL-10 and FoxP3 expression in CD8+ and CD4+ T cells in the BM. (B) Frequency of IL-10–producing CD8+ T cells in BM and spleen (n = 16-17 combined from 4 experiments). (C) Spearman r correlation of IL-10+CD8+ T cells with MM burden in BM (n = 32 combined from 4 experiments). (D) Frequency of IL-10–producing CD4+ T cells in BM and spleen (n = 8 – 12 combined from 3 experiments). (E) Spearman r correlation of IL-10+CD4+ T cells with MM burden in BM (n = 32 combined from 4 experiments). (F-G) Concatenated histograms of TIGIT and PD-1 expression on IL-10+ and IL-10− cells in CD4+FoxP3−, CD4+FoxP3+ (Treg) and CD8+ T-cell subsets. Geometric mean fluorescence intensity of TIGIT (F) and PD-1 (G) in BM of MM-relapsed mice (n = 8 combined from 3 experiments). Data represent mean ± SEM. *P < .05, **P < .01, ***P < .001 (Mann-Whitney U test).
T-cell–derived IL-10 is increased in mice that have relapsed after SCT and is associated with exhaustion. MM-bearing or naive (MM-free; green) recipients were transplanted as previously described with BM+T grafts from FoxP3-RFP × IL-10-GFP reporter B6 donors. MM-bearing mice were categorized as MM-relapsed (purple) or MM-controlled (orange) at 8 weeks after SCT. Mice were sacrificed, BM and spleen were harvested, and T cells were analyzed using flow cytometry. (A) Representative FACS plots of IL-10 and FoxP3 expression in CD8+ and CD4+ T cells in the BM. (B) Frequency of IL-10–producing CD8+ T cells in BM and spleen (n = 16-17 combined from 4 experiments). (C) Spearman r correlation of IL-10+CD8+ T cells with MM burden in BM (n = 32 combined from 4 experiments). (D) Frequency of IL-10–producing CD4+ T cells in BM and spleen (n = 8 – 12 combined from 3 experiments). (E) Spearman r correlation of IL-10+CD4+ T cells with MM burden in BM (n = 32 combined from 4 experiments). (F-G) Concatenated histograms of TIGIT and PD-1 expression on IL-10+ and IL-10− cells in CD4+FoxP3−, CD4+FoxP3+ (Treg) and CD8+ T-cell subsets. Geometric mean fluorescence intensity of TIGIT (F) and PD-1 (G) in BM of MM-relapsed mice (n = 8 combined from 3 experiments). Data represent mean ± SEM. *P < .05, **P < .01, ***P < .001 (Mann-Whitney U test).
Non–T-cell-derived IL-10 promotes myeloma progression after SCT
We next determined if there was a relationship between IL-10, T-cell exhaustion, and myeloma relapse after SCT. Firstly, we identified a functional role for IL-10 by transplanting MM-bearing recipients with donor grafts deficient in IL-10 (IL-10−/−). Recipients of IL-10−/− grafts had significantly reduced tumor burden and improved survival compared with wild-type (WT) recipients (Figure 4A). To determine whether IL-10 was directly promoting CD8+ T-cell exhaustion, we transplanted MM-bearing recipients with donor grafts in which both CD4+ and CD8+ T cells were unable to signal through the IL-10R (CD4cre+ × IL-10Rfl/fl). Surprisingly, PD-1 and TIM-3 expression on CD8+ T cells from MM-relapsed mice was unaffected by IL-10 signaling (Figure 4B) and indeed myeloma control was not improved in recipients of CD4cre+ × IL-10Rfl/fl grafts (Figure 4C). Furthermore, there was no survival benefit in MM-bearing recipients of donor grafts where the T cells were unable to produce IL-10 (CD4cre+ × IL-10fl/fl) (Figure 4D). These data suggest that T-cell–derived IL-10 does not contribute to myeloma relapse after SCT.
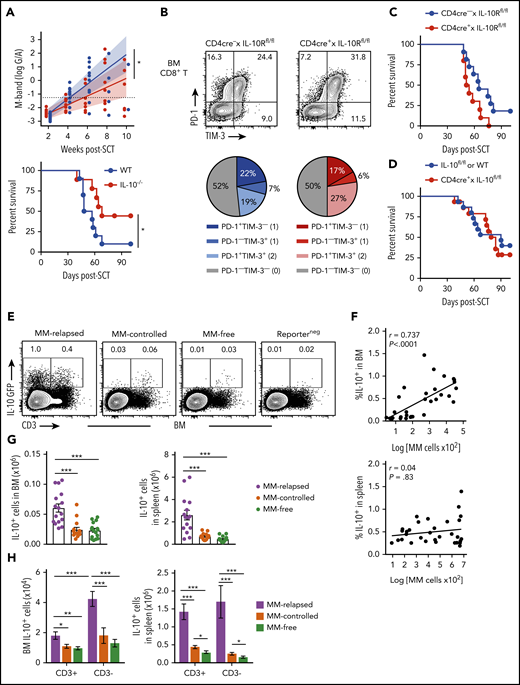
Non–T-cell-derived IL-10 production promotes loss of immune control after SCT. Recipients were transplanted as previously described with BM+T grafts from B6 donors. (A) MM-bearing recipients of WT (blue) or IL-10–deficient (IL-10−/−; red) grafts were monitored for survival and bled to quantify tumor burden using M-band (G/A). M-bands were modeled over time to calculate a predictive rate of tumor growth (indicated by solid line), with confidence intervals shaded and M-band relapse threshold shown as dotted line (n = 9-10 combined from 2 experiments). (B) Frequency of TIM-3 and PD-1 expression on CD8+ T cells from BM of MM-bearing recipients transplanted with grafts from CD4cre+ × IL-10Rfl/fl (red) or Cre-negative littermate control (blue) donors. FACS plots are representative. BM was harvested from MM-relapsed mice at 6 to 7 weeks after transplant (n = 7 combined from 2 experiments). (C-D) Survival of MM-bearing recipients transplanted with BM+T from (C) CD4cre+ × IL-10Rfl/fl (red) or Cre-negative littermate control (blue) donors (n = 10-11 combined from 2 experiments) and (D) CD4cre+ × IL-10fl/fl (red) or Cre-negative littermate control or WT (blue) donors (n = 15 combined from 2 experiments). (E-H) Recipients were transplanted with grafts from FoxP3-RFP × IL-10-GFP reporter donors. WT donors (Reporterneg) were used to define the IL-10+ gating strategy. Recipients were sacrificed 8 weeks after transplant, BM and spleen were harvested, and cells were analyzed using flow cytometry. (E) Representative FACS plots in BM. (F) Spearman r correlation of frequency of IL-10+ cells with MM burden in BM and spleen of MM-bearing mice (n = 32 combined from 4 experiments). (G-H) Total number of IL-10+ cells (G) and number of CD3+ and CD3− IL-10–producing cells (H) in the BM and spleen of MM-relapsed, MM-controlled, and MM-free mice (n = 16-17 combined from 4 experiments). To determine statistical significance, tumor burden was plotted using longitudinal mixed-effects linear models, and survival was analyzed using a log-rank test. A Mann-Whitney U test was used for numerical values and data are presented as mean ± SEM. *P < .05, **P < .01, ***P < .001.
Non–T-cell-derived IL-10 production promotes loss of immune control after SCT. Recipients were transplanted as previously described with BM+T grafts from B6 donors. (A) MM-bearing recipients of WT (blue) or IL-10–deficient (IL-10−/−; red) grafts were monitored for survival and bled to quantify tumor burden using M-band (G/A). M-bands were modeled over time to calculate a predictive rate of tumor growth (indicated by solid line), with confidence intervals shaded and M-band relapse threshold shown as dotted line (n = 9-10 combined from 2 experiments). (B) Frequency of TIM-3 and PD-1 expression on CD8+ T cells from BM of MM-bearing recipients transplanted with grafts from CD4cre+ × IL-10Rfl/fl (red) or Cre-negative littermate control (blue) donors. FACS plots are representative. BM was harvested from MM-relapsed mice at 6 to 7 weeks after transplant (n = 7 combined from 2 experiments). (C-D) Survival of MM-bearing recipients transplanted with BM+T from (C) CD4cre+ × IL-10Rfl/fl (red) or Cre-negative littermate control (blue) donors (n = 10-11 combined from 2 experiments) and (D) CD4cre+ × IL-10fl/fl (red) or Cre-negative littermate control or WT (blue) donors (n = 15 combined from 2 experiments). (E-H) Recipients were transplanted with grafts from FoxP3-RFP × IL-10-GFP reporter donors. WT donors (Reporterneg) were used to define the IL-10+ gating strategy. Recipients were sacrificed 8 weeks after transplant, BM and spleen were harvested, and cells were analyzed using flow cytometry. (E) Representative FACS plots in BM. (F) Spearman r correlation of frequency of IL-10+ cells with MM burden in BM and spleen of MM-bearing mice (n = 32 combined from 4 experiments). (G-H) Total number of IL-10+ cells (G) and number of CD3+ and CD3− IL-10–producing cells (H) in the BM and spleen of MM-relapsed, MM-controlled, and MM-free mice (n = 16-17 combined from 4 experiments). To determine statistical significance, tumor burden was plotted using longitudinal mixed-effects linear models, and survival was analyzed using a log-rank test. A Mann-Whitney U test was used for numerical values and data are presented as mean ± SEM. *P < .05, **P < .01, ***P < .001.
To determine whether total IL-10 production was altered during myeloma progression, we used IL-10-GFP × FoxP3-RFP reporter donors and investigated the predominant IL-10 source at 8 weeks after SCT. There was a significant increase in the number of IL-10+ cells in the BM and spleen of MM-relapsed mice compared with MM-controlled and MM-free mice, and the frequency of IL-10+ cells correlated with myeloma burden in the BM (Figure 4E-G). Furthermore, in accordance with our finding that T-cell–derived IL-10 was not directly promoting relapse, we demonstrated that significantly more IL-10 was derived from CD3− cells than from CD3+ cells in the BM of relapsed mice (Figure 4H). These data suggest that a non–T-cell is likely contributing to myeloma progression after SCT via the production of IL-10.
CD11chiMHC class IIlow cells are the major source of IL-10 during myeloma progression
We next sought to determine which myeloid populations were producing IL-10 in the BM of MM-relapsed mice. IL-10 was predominantly produced by CD11c+ dendritic cells (DCs) and CD64+ macrophages (Figure 5A). The CD11chi DCs were predominantly a MHC class II (MHCII)low/− population that expressed PD-L1 (Figure 5B-C). The CD64+ macrophages were increased in frequency, but not total number, in MM-relapsed mice (Figure 5D) and expressed high levels of F4/80 (Figure 5E) while downregulating MHC class II expression (Figure 5F). The CD11chi cells were CD11b+, did not express markers for plasmacytoid DCs (supplemental Figure 2), and were significantly expanded in the BM of MM-relapsed compared with MM-controlled and MM-free mice (Figure 5G). As noted, myeloma relapse was associated with low MHC class II expression (Figure 5H), and these cells, like conventional DCs (cDCs), were Flt3+ and expressed CD80 (Figure 5I). In the BM, cDCs are a rare population representing <1% of total white blood cells, yet there was a small increase in both frequency and number of cDCs in MM-relapsed mice (Figure 5G). Furthermore, there was a significant increase in IL-10 production in the MHCIIlow/− DCs and cDCs of MM-relapsed mice compared with MM-controlled and MM-free mice (Figure 5J). These data demonstrate that MM relapse promotes IL-10 secretion by DCs and that these cells accumulate in the BM during disease progression.
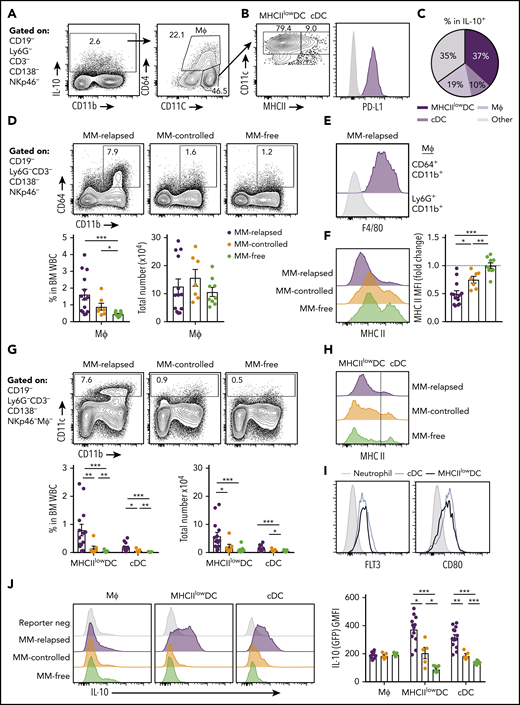
CD11chiMHCIIlowDCs are the major source of myeloid-derived IL-10 in the BM of MM-relapsed mice. MM-bearing and naive (MM-free) recipients were transplanted as previously described with BM+T grafts from FoxP3-RFP × IL-10-GFP reporter donors. Recipients were sacrificed 8 weeks after SCT, BM and spleen were harvested, and cells were analyzed using flow cytometry. FACS plots are representative. (A) Gating strategy for IL-10–producing myeloid cells. (B) Expression of MHC class II (MHC II) and PD-L1 on CD11chiCD64− DCs. (C) Frequency of MHCIIlow/− DCs, cDCs and macrophages (CD64+CD11b+) within IL-10+ cells from the BM of MM-relapsed mice (n = 10 combined from 2 experiments). (D) Gating strategy and quantification of frequency and number of macrophages from the BM of MM-relapsed, MM-controlled, and MM-free mice and (E) F4/80 expression on BM macrophages and neutrophils (negative control) from MM-relapsed mice and (F) MHC II expression on BM macrophages from MM-relapsed, MM-controlled, and MM-free mice (n = 7-14 combined from 2 experiments). (G) Gating strategy and quantification of frequency and number and (H) histogram of MHC II expression on MHCIIlow/− DCs and cDCs from the BM of MM-relapsed, MM-controlled, and MM-free mice (n = 7-14 combined from 2 experiments). (I) FLT3 (n = 4 from 1 experiment) and CD80 (n = 7 combined from 2 experiments) expression on MHCIIlow/− DCs and cDCs from BM of MM-bearing mice. (J) Representative histograms of IL-10 production and geometric mean fluorescence intensity from macrophages, MHCIIlow/− DCs, and cDCs from the BM of MM-relapsed, MM-controlled, and MM-free mice (n = 5-13 combined from 2 experiments). Data represent mean ± SEM. * P < .05, ** P < .01, *** P < .001 (Mann-Whitney U test). MΦ, macrophage; WBC, white blood cell.
CD11chiMHCIIlowDCs are the major source of myeloid-derived IL-10 in the BM of MM-relapsed mice. MM-bearing and naive (MM-free) recipients were transplanted as previously described with BM+T grafts from FoxP3-RFP × IL-10-GFP reporter donors. Recipients were sacrificed 8 weeks after SCT, BM and spleen were harvested, and cells were analyzed using flow cytometry. FACS plots are representative. (A) Gating strategy for IL-10–producing myeloid cells. (B) Expression of MHC class II (MHC II) and PD-L1 on CD11chiCD64− DCs. (C) Frequency of MHCIIlow/− DCs, cDCs and macrophages (CD64+CD11b+) within IL-10+ cells from the BM of MM-relapsed mice (n = 10 combined from 2 experiments). (D) Gating strategy and quantification of frequency and number of macrophages from the BM of MM-relapsed, MM-controlled, and MM-free mice and (E) F4/80 expression on BM macrophages and neutrophils (negative control) from MM-relapsed mice and (F) MHC II expression on BM macrophages from MM-relapsed, MM-controlled, and MM-free mice (n = 7-14 combined from 2 experiments). (G) Gating strategy and quantification of frequency and number and (H) histogram of MHC II expression on MHCIIlow/− DCs and cDCs from the BM of MM-relapsed, MM-controlled, and MM-free mice (n = 7-14 combined from 2 experiments). (I) FLT3 (n = 4 from 1 experiment) and CD80 (n = 7 combined from 2 experiments) expression on MHCIIlow/− DCs and cDCs from BM of MM-bearing mice. (J) Representative histograms of IL-10 production and geometric mean fluorescence intensity from macrophages, MHCIIlow/− DCs, and cDCs from the BM of MM-relapsed, MM-controlled, and MM-free mice (n = 5-13 combined from 2 experiments). Data represent mean ± SEM. * P < .05, ** P < .01, *** P < .001 (Mann-Whitney U test). MΦ, macrophage; WBC, white blood cell.
Effects of IL-10 and macrophages on myeloma progression after SCT
We next analyzed the effect of donor-derived IL-10 by transplanting MM-bearing recipients with broadly IL-10–deficient grafts and noted enhanced T-cell activation (CD69+DNAM-1+) in this setting (Figure 6A) and a reduction in CD8+ T-cell exhaustion (DNAM-1-TIGIT+PD-1+TIM-3+) (Figure 6B). Interestingly, the deletion of IL-10 specifically from CD11c+ DCs improved myeloma survival (Figure 6C), while broad inhibition of IL-10 receptor signaling with mAb did not (Figure 6D), consistent with the pleotropic nature of this cytokine in both augmenting and suppressing immune responses, depending on the cell of origin (eg, recipient stroma vs donor myeloid or lymphoid cells), cognate signaling, and dose-dependent effects.25-27 Since these results suggested IL-10 inhibition would seem unlikely to be clinically useful, as would targeting DCs that are important in initiating tumor-specific immunity, we analyzed the effects of macrophages that were also modulated by myeloma. We demonstrated that CD64+ macrophages in the BM were CSF-1Rhi and expression was enhanced by myeloma (Figure 6E). Finally, we administered a CSF-1R mAb (M279) known to block cognate cytokine signaling that prevents tumor-associated macrophage accumulation and increases T-cell activation but does not deplete DCs.28,29 This strategy indeed improved myeloma control and enhanced survival (Figure 6F), making CSF-1R neutralization an attractive strategy to target suppressive myeloid populations in the marrow microenvironment.
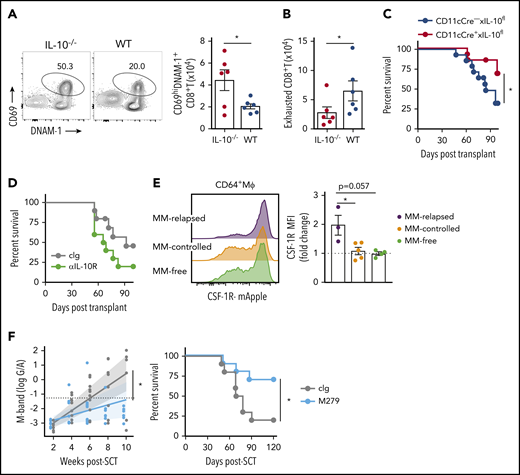
DC-derived IL-10– and CSF-1R–dependent macrophages promote myeloma relapse after SCT. MM-bearing recipients were transplanted as previously described with BM+T grafts from B6 donors. (A-B) MM-bearing recipients were transplanted with IL-10–deficient (IL-10−/−; red) or WT (blue) grafts and CD8+ T cell phenotype was assessed in the BM 4 weeks after SCT. (A) Representative FACS plot and number of activated (CD69+DNAM-1+) and (B) exhausted (DNAM-1−TIGIT+TIM-3+PD-1+) CD8+ T cells (n = 6 from 1 experiment). (C) Survival of MM-bearing recipients transplanted with BM grafts from donors either deficient in CD11c-derived IL-10 (CD11cCre+ × IL-10fl/fl; red) or littermate controls (CD11cCre− × IL-10fl/fl; blue) and sorted WT T cells (n = 13 combined from 2 experiments). (D) Survival of MM-bearing recipients treated with 500 μg cIg (gray) or anti-IL-10R (green) twice a week from week 2 to week 6 after SCT (n = 10 combined from 2 experiments). (E) MM-bearing and MM-free recipients were transplanted with BM+T from CSF-1R-mApple reporter mice. CSF-1R expression on macrophages (CD64+Mϕ) was determined 6 weeks after SCT in the BM (n = 3-5 from 1 experiment). (F) M-band and survival of MM-bearing recipients treated with 400 μg cIg (gray) or anti-CSF-1R (M279; light blue) twice a week from week 2 to week 6 post-SCT (n = 10 combined from 2 experiments). Survival was analyzed using a log-rank test, and M-bands were modeled as described. Data represent mean ± SEM and a Mann-Whitney U test was used for numerical values. *P < .05.
DC-derived IL-10– and CSF-1R–dependent macrophages promote myeloma relapse after SCT. MM-bearing recipients were transplanted as previously described with BM+T grafts from B6 donors. (A-B) MM-bearing recipients were transplanted with IL-10–deficient (IL-10−/−; red) or WT (blue) grafts and CD8+ T cell phenotype was assessed in the BM 4 weeks after SCT. (A) Representative FACS plot and number of activated (CD69+DNAM-1+) and (B) exhausted (DNAM-1−TIGIT+TIM-3+PD-1+) CD8+ T cells (n = 6 from 1 experiment). (C) Survival of MM-bearing recipients transplanted with BM grafts from donors either deficient in CD11c-derived IL-10 (CD11cCre+ × IL-10fl/fl; red) or littermate controls (CD11cCre− × IL-10fl/fl; blue) and sorted WT T cells (n = 13 combined from 2 experiments). (D) Survival of MM-bearing recipients treated with 500 μg cIg (gray) or anti-IL-10R (green) twice a week from week 2 to week 6 after SCT (n = 10 combined from 2 experiments). (E) MM-bearing and MM-free recipients were transplanted with BM+T from CSF-1R-mApple reporter mice. CSF-1R expression on macrophages (CD64+Mϕ) was determined 6 weeks after SCT in the BM (n = 3-5 from 1 experiment). (F) M-band and survival of MM-bearing recipients treated with 400 μg cIg (gray) or anti-CSF-1R (M279; light blue) twice a week from week 2 to week 6 post-SCT (n = 10 combined from 2 experiments). Survival was analyzed using a log-rank test, and M-bands were modeled as described. Data represent mean ± SEM and a Mann-Whitney U test was used for numerical values. *P < .05.
Checkpoint blockade in combination with SCT prolongs survival
The presence of exhausted CD8+ T cells and an immunosuppressive microenvironment in mice with relapsed myeloma suggested that immunotherapy could be used to prevent relapse after SCT. We thus treated MM-bearing mice with anti-PD-1 mAb and noted a marked improvement in survival compared with isotype control (cIg)–treated recipients (supplemental Figure 3A). Furthermore, mice treated with anti-TIGIT, a novel therapeutic target, also had improved survival and a reduced rate of tumor growth compared with cIg-treated mice (Figure 7A). Anti-TIGIT–treated mice also had a reduced number of myeloma cells in the BM and increased number of CD8+ and CD4+ T cells (Figure 7B-C). Hallmarks of T-cell exhaustion were also reduced in anti-TIGIT–treated mice with increased DNAM-1 and decreased PD-1 and TIM-3 expression on BM CD8+ T cells (Figure 7D-E). Furthermore, there was reduced Eomes expression in BM CD8+ T cells in anti-TIGIT–treated mice (Figure 7F). Importantly, the number of IFN-γ–producing CD8+ and CD4+ T cells was significantly increased in response to TIGIT blockade (Figure 7G) and, surprisingly, an increase in IFN-γ+CD8+ and CD107a+CD8+ T cells positively correlated with myeloma cell number in the BM of anti-TIGIT-treated mice (Figure 7H), something not seen in the absence of TIGIT inhibition (Figure 1E). It is important to note that the M-band in these anti-TIGIT–treated animals was below the threshold that defined impending relapse in the majority (16 of 19) of animals, consistent with myeloma control by this activated T-cell phenotype. IFN-γ production was also increased in splenic CD8+ T cells, but not CD4+ T cells, in anti-TIGIT–treated mice (supplemental Figure 3B). TIGIT inhibition also reduced the proportion of pathogenic IL-10–secreting DCs (Figure 7I). Finally, the CD8+ TCM compartment was significantly expanded in anti-TIGIT–treated mice compared with cIg-treated mice, and CD122 expression was increased in this population (Figure 7J-K). Thus, when used in combination with SCT, TIGIT blockade prolonged survival in MM-bearing mice and promoted CD8+ T cell IFN-γ production and memory formation, providing a rationale for the use of this therapy early posttransplant to maximize immune control of any residual disease and prevent relapse.
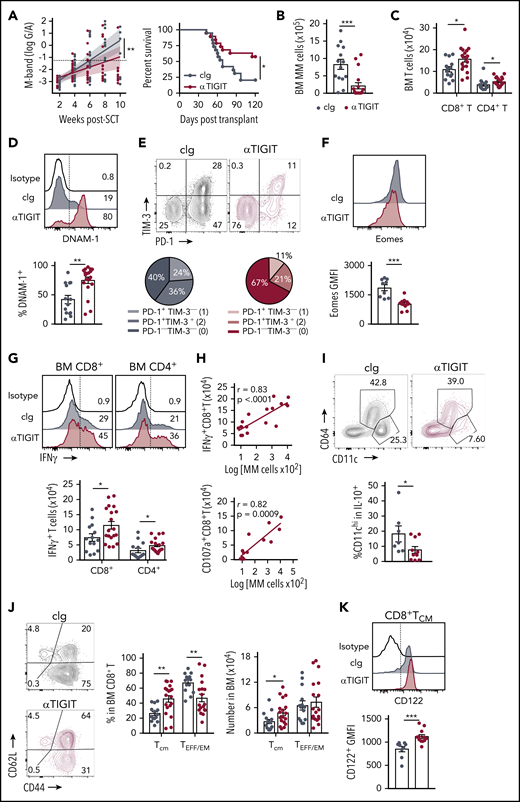
TIGIT blockade promotes myeloma control after SCT. MM-bearing recipients were transplanted as previously described with BM+T grafts from B6 donors. Recipients were treated immediately after transplant with 100 μg anti-TIGIT or cIg per mouse twice a week for 6 weeks. (A) Tumor burden and survival of anti-TIGIT (maroon) – or cIg (gray)–treated mice (n = 19 combined from 3 experiments). Survival was analyzed using a log-rank test, and M-bands were modeled as described. (B-K) MM-bearing recipients were sacrificed 6 weeks after transplant after completion of treatment, and BM and spleen were harvested and analyzed using flow cytometry. FACS plots and histograms are representative. (B) Myeloma (CD19−CD155hi) and (C) CD8+ and CD4+ T-cell numbers in BM. (D) Histogram and frequency of DNAM-1+CD8+ T cells in BM. (E) FACS plot and frequency of TIM-3 and PD-1 expression on CD8+ T cells in the BM. (F) Histogram and geometric mean fluorescence intensity (GMFI) of Eomes expression in BM CD8+ T cells. (G-H) Whole BM was stimulated and IFN-γ and CD107a production was measured by intracellular staining. (G) Histogram and number of IFN-γ+ CD8+ and CD4+ T cells in cIg- and anti-TIGIT–treated mice, and (H) correlation of IFN-γ+ (n = 18 from 3 experiments) and CD107a+ (n = 13 from 2 experiments) CD8+ T-cell number with myeloma cell number in anti-TIGIT–treated mice. (I) Frequency of CD11chiCD64− cells within IL-10-GFP+ myeloid cells in the BM (n = 7-10 from 2 experiments). (J) FACS plots showing CD62L and CD44 expression, and graph showing frequency of TCM (CD44+CD62L+) and TEFF/EM (CD44+CD62L−) CD8+ T cells in the BM. (K) Histogram and graph of CD122 GMFI on CD122+CD8+TCM cells in the BM. In panels B-E, G, and J, n = 14-18 combined from 3 experiments; in panels F and K, n = 9-12 combined from 2 experiments. Data represent mean ± SEM. *P < .05, **P < .01 , ***P < .001 (Mann-Whitney U test).
TIGIT blockade promotes myeloma control after SCT. MM-bearing recipients were transplanted as previously described with BM+T grafts from B6 donors. Recipients were treated immediately after transplant with 100 μg anti-TIGIT or cIg per mouse twice a week for 6 weeks. (A) Tumor burden and survival of anti-TIGIT (maroon) – or cIg (gray)–treated mice (n = 19 combined from 3 experiments). Survival was analyzed using a log-rank test, and M-bands were modeled as described. (B-K) MM-bearing recipients were sacrificed 6 weeks after transplant after completion of treatment, and BM and spleen were harvested and analyzed using flow cytometry. FACS plots and histograms are representative. (B) Myeloma (CD19−CD155hi) and (C) CD8+ and CD4+ T-cell numbers in BM. (D) Histogram and frequency of DNAM-1+CD8+ T cells in BM. (E) FACS plot and frequency of TIM-3 and PD-1 expression on CD8+ T cells in the BM. (F) Histogram and geometric mean fluorescence intensity (GMFI) of Eomes expression in BM CD8+ T cells. (G-H) Whole BM was stimulated and IFN-γ and CD107a production was measured by intracellular staining. (G) Histogram and number of IFN-γ+ CD8+ and CD4+ T cells in cIg- and anti-TIGIT–treated mice, and (H) correlation of IFN-γ+ (n = 18 from 3 experiments) and CD107a+ (n = 13 from 2 experiments) CD8+ T-cell number with myeloma cell number in anti-TIGIT–treated mice. (I) Frequency of CD11chiCD64− cells within IL-10-GFP+ myeloid cells in the BM (n = 7-10 from 2 experiments). (J) FACS plots showing CD62L and CD44 expression, and graph showing frequency of TCM (CD44+CD62L+) and TEFF/EM (CD44+CD62L−) CD8+ T cells in the BM. (K) Histogram and graph of CD122 GMFI on CD122+CD8+TCM cells in the BM. In panels B-E, G, and J, n = 14-18 combined from 3 experiments; in panels F and K, n = 9-12 combined from 2 experiments. Data represent mean ± SEM. *P < .05, **P < .01 , ***P < .001 (Mann-Whitney U test).
Discussion
T-cell exhaustion and local immune suppression remain key mediators of clinical outcomes and responses to immunotherapy for cancer patients. Here, we demonstrate that BM-infiltrating CD8+ T cells are phenotypically and functionally exhausted in relapsed myeloma after SCT, and this is associated with increased IL-10 production. Importantly, the myeloid compartment produced the majority of donor-derived IL-10 in the BM of mice with relapsed myeloma, and the absence of donor DC–derived IL-10 enhanced myeloma control and prolonged overall survival after SCT. In addition, PD-1 or TIGIT blockade significantly prolonged survival of MM-bearing mice with similar potency when used in combination with SCT and may be further enhanced by combinational strategies, with or without the targeting of suppressive myeloid populations.
In myeloma, the pathogenesis of IL-10 has been eluded to, since increased IL-10 in the serum of myeloma patients is associated with poor prognosis30 and IL-10 was shown to directly promote myeloma growth.31,32 In our study, we used the Vk12653 clone to interrogate the role of IL-10 in myeloma relapse, as this clone has been reported to form a more immunosuppressive microenvironment than the other widely used Vk12598 clone.33 We identified macrophages, cDCs, and MHCIIlow/− DCs as the 3 major sources of IL-10 in the BM of MM-relapsed mice. Notably, all three populations have described roles in tumor progression and express the targetable CSF-1R (colony-stimulating factor 1 receptor).34-38 Dysfunctional CD11chi MHCIIlow DCs expressing high levels of IL-10 have been identified in vitro after BM cells were stimulated with myeloma conditioned media.39 Our study is the first to report the expansion of these cells in vivo in BM of mice with relapsing myeloma. Our data demonstrating that myeloma control is improved when IL-10 is removed from DCs, but not when IL-10 or its receptor is removed from T cells, confirm that the effects of this cytokine on T-cell phenotypes after SCT are indirect, possibly via effects on antigen presentation or the tumor microenvironment. Treatment with a CSF-1R blocking antibody has been reported in a myeloma cell line mouse model; however, unlike this study with primary myeloma, a survival advantage was only conferred when anti-CSF-1R was used in combination with bortezomib.40 The clinical efficacy of CSF-1R blocking antibodies in preventing myeloma relapse after SCT remains to be determined but appears to be an attractive therapeutic strategy for targeting immunosuppressive myeloid populations directly, either alone or in combination with checkpoint inhibition, and requires further study.
The role of T-cell exhaustion in myeloma progression has been indirectly assessed in myeloma patients with little consensus on whether CD8+ T cells are senescent or exhausted.8,9,41 T-cell exhaustion has also been explored in animal models utilizing myeloma cell lines, such as the 5T33 line, where injected cells concurrently infiltrate the liver, spleen, and BM,42 and success of checkpoint blockade has only been achieved with combining multiple therapies (eg, DC vaccination and targeting multiple checkpoints).43-45 In our model, CD8+ T cells displayed hallmarks of exhaustion with expression of multiple inhibitory receptors,17 reduced T-bet,20 and increased Eomes19 expression and production of IL-10.22 Whether myeloma results in T-cell exhaustion after SCT directly, by virtue of high PD-L1 and CD155 expression, or indirectly via effects on suppressive myeloid populations is difficult to ascertain, since the malignancy cannot be propagated in vitro and modified by standard gene editing tools. Since the depletion of suppressive IL-10+ DCs or CSF1R+ macrophages improves myeloma control, the prevention of T-cell exhaustion seen in this setting cannot be determined to be a primary phenomenon related to these myeloid populations or secondary to the improved control of myeloma. We are attempting to generate VK*MYC myeloma on CD155−/− and PD-L1−/− backgrounds to address this definitively. In any case, single-agent immunotherapy was sufficient to significantly prolong disease control in our model when used early posttransplant. Of note, a study using the same Vk*MYC mouse model showed no efficacy of anti-PD-1 in a nontransplant setting,46 and an early clinical trial in relapsed/refractory myeloma patients was unsuccessful.10 It has been suggested that combining checkpoint blockade with immunomodulatory drugs might provide added benefit; however, a recent clinical trial combining pembrolizumab, an anti-PD-1 mAb, with pomalidomide, an immunomodulatory drugs, was placed on clinical hold due to adverse effects in the anti-PD-1–treated arm despite an objective response rate of 60%.47 These data, coupled with our findings and another recent clinical study suggesting that the optimal timing of immunotherapy may be early posttransplant,41 have major implications for the timing and integration of anti-PD-1 treatment in myeloma patients who are transplant eligible. Auto-SCT provides a unique window of opportunity for immunotherapy in that it allows for substantial tumor debulking and, in the case of myeloma specifically, disruption of the tumor microenvironment. Furthermore, T cells in the donor graft are exposed to an inflammatory, lymphodeplete microenvironment in the presence of tumor antigen, maximizing potential antimyeloma T-cell responses.
The role of TIGIT blockade in myeloma has yet to be explored in the clinical setting; however, it is known that CD155, a ligand for TIGIT and DNAM-1, is expressed on human myeloma cells,48 and there are preliminary reports of TIGIT expression on CD8+ T cells from patients with myeloma.49 Furthermore, exhausted T cells expressing TIGIT have been observed in acute myeloid leukemia patients,50 and Guillerey et al51 (see accompanying article beginning on page 1689) report high levels of TIGIT expression on exhausted CD8+ T cells from the BM of MM patients. One of the first studies to characterize TIGIT in CD8+ T cells reported antitumor responses with anti-TIGIT mAb only when used in combination with a PD-L1 blocking mAb.52 In contrast, our study has demonstrated anti-myeloma activity when anti-TIGIT mAb was administered as a single agent after SCT. Importantly, TIGIT blockade was sufficient to prevent T-cell exhaustion and promote IFN-γ and CD107a secretion in response to low-level myeloma, which was opposite to that seen with increasing tumor burden in untreated mice. Furthermore, TIGIT blockade reduced pathogenic DC-derived IL-10, putatively by preventing its interaction with CD155 on DCs,53 suggesting that the mechanism of action following TIGIT inhibition likely includes both direct effects on the T cell and indirect effects via DCs. Interestingly, despite expansion of a TEFF/EM population, TIGIT blockade also promoted the maintenance and/or expansion of a CD8+ TCM population similar to that seen in mice that control myeloma long-term in the absence of checkpoint inhibition and thus appear to be responsible for long-term myeloma control.
We have shown that T-cell exhaustion is independent of direct IL-10 signaling to T cells and that IL-10, produced by DCs, acts to promote relapse after SCT. We also identify functionally exhausted CD8+ T cells in the BM of mice with relapsing myeloma after SCT and highlight the importance of early TIGIT-based checkpoint inhibition after transplant to prevent T-cell exhaustion and thus maintain long-term immunological control of myeloma.
The online version of this article contains a data supplement.
The publication costs of this article were defrayed in part by page charge payment. Therefore, and solely to indicate this fact, this article is hereby marked “advertisement” in accordance with 18 USC section 1734.
Acknowledgments
This work was supported by research grants from the Cancer Council Queensland and the National Health and Medical Research Council of Australia (NHMRC). G.R.H. is a NHMRC Senior Principal Research Fellow. M.J.S. was funded by a NHMRC program grant (1132519), project grant (1098960), and senior principal research fellowship (1078671). C.G. is supported by an NHMRC early career fellowship (1107417) and a project grant from Cure Cancer Australia (1122183). K.A.M. is a Queensland Health Clinical Research Fellow. S.A.M. is supported by an Australian postgraduate award and a QIMR Berghofer top-up scholarship. A.W. is supported by an Australian postgraduate award.
Authorship
Contribution: S.A.M. designed and performed experiments and wrote the manuscript; K.H.G. analyzed data; R.D.K., A.N.W., L.S., and S.V. performed experiments; P.Z., C.G., C.E., M.J.S., K.P.A.M., K.A.M., and S.V. provided essential reagents and/or discussion and experimental advice; and G.R.H. conceived and designed experiments and wrote the manuscript.
Conflict-of-interest disclosure: M.J.S. has research agreements with Bristol-Myers Squibb, Tizona Therapeutics, and Aduro Biotech. The remaining authors declare no competing financial interests.
The current affiliation for G.R.H. is Fred Hutchinson Cancer Research Center, Seattle, WA.
Correspondence: Geoffrey R. Hill, Fred Hutchinson Cancer Research Center, 1100 Fairview Ave N, Seattle, WA 98109; e-mail: grhill@fredhutch.org.

This feature is available to Subscribers Only
Sign In or Create an Account Close Modal