

The colors denoting αTIGIT and cIg in Figure 7A, left panel (page 1685), and αPD-1 and cIg in supplemental Figure 3A, right panel, were reversed. The corrected Figure 7 is shown below. The references to and interpretation of these data in the article text are correct. The errors have been corrected in the online version of the article and in the supplemental file.
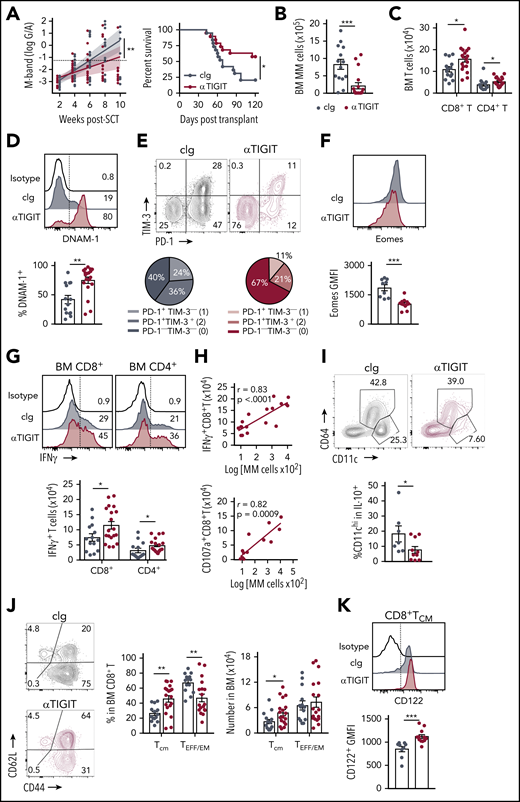
TIGIT blockade promotes myeloma control after SCT. MM-bearing recipients were transplanted as previously described with BM+T grafts from B6 donors. Recipients were treated immediately after transplant with 100 μg anti-TIGIT or cIg per mouse twice a week for 6 weeks. (A) Tumor burden and survival of anti-TIGIT (maroon)– or cIg (gray)–treated mice (n = 19 combined from 3 experiments). Survival was analyzed using a log-rank test, and M-bands were modeled as described. (B-K) MM-bearing recipients were sacrificed 6 weeks after transplant after completion of treatment, and BM and spleen were harvested and analyzed using flow cytometry. FACS plots and histograms are representative. (B) Myeloma (CD19−CD155hi) and (C) CD8+ and CD4+ T-cell numbers in BM. (D) Histogram and frequency of DNAM-1+CD8+ T cells in BM. (E) FACS plot and frequency of TIM-3 and PD-1 expression on CD8+ T cells in the BM. (F) Histogram and geometric mean fluorescence intensity (GMFI) of Eomes expression in BM CD8+ T cells. (G-H) Whole BM was stimulated and IFN-γ and CD107a production was measured by intracellular staining. (G) Histogram and number of IFN-γ+ CD8+ and CD4+ T cells in cIg- and anti-TIGIT–treated mice, and (H) correlation of IFN-γ+ (n = 18 from 3 experiments) and CD107a+ (n = 13 from 2 experiments) CD8+ T-cell number with myeloma cell number in anti-TIGIT–treated mice. (I) Frequency of CD11chiCD64− cells within IL-10-GFP+ myeloid cells in the BM (n = 7-10 from 2 experiments). (J) FACS plots showing CD62L and CD44 expression, and graph showing frequency of TCM (CD44+CD62L+) and TEFF/EM (CD44+CD62L−) CD8+ T cells in the BM. (K) Histogram and graph of CD122 GMFI on CD122+CD8+TCM cells in the BM. In panels B-E, G, and J, n = 14-18 combined from 3 experiments; in panels F and K, n = 9-12 combined from 2 experiments. Data represent mean ± SEM. *P < .05, **P < .01, ***P < .001 (Mann-Whitney U test).
TIGIT blockade promotes myeloma control after SCT. MM-bearing recipients were transplanted as previously described with BM+T grafts from B6 donors. Recipients were treated immediately after transplant with 100 μg anti-TIGIT or cIg per mouse twice a week for 6 weeks. (A) Tumor burden and survival of anti-TIGIT (maroon)– or cIg (gray)–treated mice (n = 19 combined from 3 experiments). Survival was analyzed using a log-rank test, and M-bands were modeled as described. (B-K) MM-bearing recipients were sacrificed 6 weeks after transplant after completion of treatment, and BM and spleen were harvested and analyzed using flow cytometry. FACS plots and histograms are representative. (B) Myeloma (CD19−CD155hi) and (C) CD8+ and CD4+ T-cell numbers in BM. (D) Histogram and frequency of DNAM-1+CD8+ T cells in BM. (E) FACS plot and frequency of TIM-3 and PD-1 expression on CD8+ T cells in the BM. (F) Histogram and geometric mean fluorescence intensity (GMFI) of Eomes expression in BM CD8+ T cells. (G-H) Whole BM was stimulated and IFN-γ and CD107a production was measured by intracellular staining. (G) Histogram and number of IFN-γ+ CD8+ and CD4+ T cells in cIg- and anti-TIGIT–treated mice, and (H) correlation of IFN-γ+ (n = 18 from 3 experiments) and CD107a+ (n = 13 from 2 experiments) CD8+ T-cell number with myeloma cell number in anti-TIGIT–treated mice. (I) Frequency of CD11chiCD64− cells within IL-10-GFP+ myeloid cells in the BM (n = 7-10 from 2 experiments). (J) FACS plots showing CD62L and CD44 expression, and graph showing frequency of TCM (CD44+CD62L+) and TEFF/EM (CD44+CD62L−) CD8+ T cells in the BM. (K) Histogram and graph of CD122 GMFI on CD122+CD8+TCM cells in the BM. In panels B-E, G, and J, n = 14-18 combined from 3 experiments; in panels F and K, n = 9-12 combined from 2 experiments. Data represent mean ± SEM. *P < .05, **P < .01, ***P < .001 (Mann-Whitney U test).

This feature is available to Subscribers Only
Sign In or Create an Account Close Modal