Key Points
Genetic or pharmacologic inhibition of MEK4 and MEK2 enhances prednisolone-induced cell death in ALL models.
MAPK signaling cascades are activated at relapse compared to diagnosis in ALL samples and have enhanced response to MEK inhibition.
Abstract
The outcome for pediatric acute lymphoblastic leukemia (ALL) patients who relapse is dismal. A hallmark of relapsed disease is acquired resistance to multiple chemotherapeutic agents, particularly glucocorticoids. In this study, we performed a genome-scale short hairpin RNA screen to identify mediators of prednisolone sensitivity in ALL cell lines. The incorporation of these data with an integrated analysis of relapse-specific genetic and epigenetic changes allowed us to identify the mitogen-activated protein kinase (MAPK) pathway as a mediator of prednisolone resistance in pediatric ALL. We show that knockdown of the specific MAPK pathway members MEK2 and MEK4 increased sensitivity to prednisolone through distinct mechanisms. MEK4 knockdown increased sensitivity specifically to prednisolone by increasing the levels of the glucocorticoid receptor. MEK2 knockdown increased sensitivity to all chemotherapy agents tested by increasing the levels of p53. Furthermore, we demonstrate that inhibition of MEK1/2 with trametinib increased sensitivity of ALL cells and primary samples to chemotherapy in vitro and in vivo. To confirm a role for MAPK signaling in patients with relapsed ALL, we measured the activation of the MEK1/2 target ERK in matched diagnosis-relapse primary samples and observed increased phosphorylated ERK levels at relapse. Furthermore, relapse samples have an enhanced response to MEK inhibition compared to matched diagnosis samples in xenograft models. Together, our data indicate that inhibition of the MAPK pathway increases chemosensitivity to glucocorticoids and possibly other agents and that the MAPK pathway is an attractive target for prevention and/or treatment of relapsed disease.
Introduction
Acute lymphoblastic leukemia (ALL) is the most common form of pediatric cancer and the leading cause of cancer-related death in children in the United States. Although survival rates have risen dramatically, up to 20% of patients relapse, and their prognoses are dismal.1 Resistance to glucocorticoid (GC) agonists is a hallmark of relapsed ALL and a strong predictor of outcome at diagnosis.2-4 Compared to leukemia blasts at diagnosis, relapsed leukemia blasts are significantly more resistant to prednisolone and dexamethasone.5 Furthermore, subgroups of ALL patients with poor prognosis, such as infant ALL and Philadelphia chromosome–positive ALL, tend to have poor clinical response to GC agonists.6,7
GC agonists initiate their antileukemic affects by activating transcription via the GC receptor (GR).8 In the absence of ligand, the GR is sequestered in the cytoplasm, bound to chaperone proteins.9 Upon ligand binding, the GR translocates into the nucleus where it can activate or repress transcription of target genes.10-12 Despite the importance of GCs in the treatment of ALL, the biological mechanisms that lead to the effective eradication of leukemic cells and acquired resistance to GCs at relapse are poorly understood.
We have previously characterized the genomic landscape of relapsed ALL by determining genes differentially expressed, genes with altered cytosine guanine dinucleotide promoter methylation, and genes with copy number changes at relapse compared to diagnosis in primary samples, with the goal of identifying candidate genes responsible for the acquisition of chemoresistance in relapsed ALL.13 To ascertain mediators of drug resistance among these candidate lesions, we performed a genome-scale short hairpin (sh)RNA screen to identify genes involved in mediating the response to the GC agonist prednisolone. Integration of the functional screen with data from paired diagnosis and relapse samples13 allowed us to determine genes and pathways likely to mediate the response to prednisolone in patients.
Our previous analyses suggested a role for several signaling pathways in relapsed pediatric ALL,13,14 including the mitogen-activated protein kinase (MAPK) cascades. However, the functional relevance of these data remained undetermined. We have now documented increased ERK activation at relapse in primary patient samples, further indicating that the MAPK pathway is likely involved in resistance to chemotherapy in children with ALL. Through our functional genomic screen, we identified multiple components of the MAPK pathway, including MEK2 and MEK4, which mediate sensitivity to GC agonists. MEK4 knockdown increases sensitivity specifically to GC agonists by increasing the levels of the GR. In contrast, MEK2 knockdown increases sensitivity to multiple clinically relevant agents, including prednisolone, doxorubicin, etoposide, and 6-thioguanine, and is dependent on increased levels of p53 observed in the MEK2-knockdown cell lines. Furthermore, inhibition of MEK1/2 with the US Food and Drug Administration–approved inhibitor trametinib results in increased sensitivity to chemotherapy in cell lines, primary samples, and xenograft models. In aggregate, these studies indicate that the MAPK pathway is an attractive target in the prevention and treatment of recurrent ALL.
Materials and methods
Cells and reagents
The B-lineage leukemia cells RS4;11 and Reh (American Type Culture Collection [ATCC]), 697 (generous gift from Dr Jun Yang, St Jude Children’s Research Hospital), and UOCB115 were grown in RPMI 1640 medium. Each leukemia line was validated by short tandem repeat analysis through ATCC. UOCB1 cells were validated through cytogenetic analysis. Cytogenetic analysis of the UOCB1 cell line revealed similar aberrations as described in the original report, including del(19)t(17q;19p), del(12)t(1q;12q), add(12q), t(7q;11q), and loss of a normal X, 1, 6, and a number of marker chromosomes. HEK293T and HS-516 cells (ATCC) were grown in Dulbecco’s modified Eagle medium. Cell lines were supplemented with 10% fetal bovine serum, 10 mM N-2-hydroxyethylpiperazine-N′-2-ethanesulfonic acid buffer, and 1% penicillin/streptomycin under 5% carbon dioxide at 37°C. Trametinib (Santa Cruz Biotechnology) and etoposide (Sigma-Aldrich) were prepared in dimethylsulfoxide. Doxorubicin (Sigma-Aldrich) was prepared in double-distilled water. Methyl-prednisolone sodium succinate (prednisolone; Pharmacia) was suspended in 0.9% sodium chloride. 6-Thioguanine (Sigma-Aldrich) was prepared in 1 M sodium hydroxide. Drugs were diluted in RPMI 1640 and added to the cultured cells at the indicated concentrations for 24 to 48 hours.
Patient samples
Phospho flow cytometry was performed on a total of 7 cryopreserved matched pairs of patient diagnosis and relapse samples (peripheral blood or bone marrow) obtained from the Children’s Oncology Group tissue bank. Previously banked specimens (peripheral blood or bone marrow) from patients treated on Children’s Hospital of Philadelphia or Children’s Oncology Group protocols were used to create xenografts for drug efficacy studies. Informed consent for the use of diagnostic specimens for future research was obtained from patients or their guardians according to the Declaration of Helsinki, and protocols were approved by the National Cancer Institute and institutional review boards of participating institutions. Additional banked matched pairs originated from the University of California San Francisco, University of Southern California–Children’s Hospital Los Angeles, and University of Texas MD Anderson Cancer Center.
Additional methods
Viral preparation, genome-wide shRNA screening,17 real-time quantitative polymerase chain reaction,18 apoptosis assays,18 cell viability assays,18 immunoblots,18 phospho flow cytometry,19 and xenograft models20-23 were all performed as previously described with additional details and modifications available in the supplemental Methods, found on the Blood Web site.
Results
Genome-scale shRNA screen identifies genes that mediate ALL cell response to prednisolone
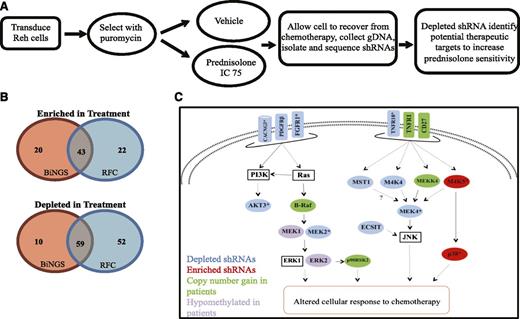
To determine genes responsible for the acquisition of resistance to GC agonists in ALL, we performed a genome-scale shRNA screen in vehicle and the prednisolone-treated B-precursor ALL cell line Reh (Figure 1A). Unsupervised hierarchical clustering demonstrated that shRNA representation is dependent on prednisolone exposure (supplemental Figure 1). The shRNA representation in the prednisolone treatment condition was compared to the shRNA representation in vehicle treatment to determine whether shRNAs were enriched or depleted upon prednisolone treatment (supplemental Figure 1). Conceptually, shRNAs that enhance prednisolone-mediated cell death are depleted by treatment and therefore likely target genes conferring resistance to prednisolone.
Genome-scale shRNA screen identifies mediators of resistance to prednisolone. (A) Reh cells were transduced with a genome-wide shRNA library and treated for 48 hours with vehicle or prednisolone at a concentration to yield a 75% inhibitory concentration (IC 75). After recovery from chemotherapy treatment, shRNA tags were isolated and quantified by deep sequencing. (B) Venn diagram illustrating the number of genes identified as hits through Bioinformatics for Next-Generation Sequencing (BiNGS), redundancy and fold-change (RFC), or both. (C) Diagrammatic representation of the MAPK pathway genes, with shRNA identified as depleted (blue) or enriched (red) in the shRNA screen. Genes identified by both BiNGS and RFC analyses are indicated by an asterisk. These data were integrated with genes identified to be upregulated by copy number gains (green) or hypomethylated at cytosine guanine dinucleotide promoter regions (purple) at relapse in primary pediatric ALL samples.
Genome-scale shRNA screen identifies mediators of resistance to prednisolone. (A) Reh cells were transduced with a genome-wide shRNA library and treated for 48 hours with vehicle or prednisolone at a concentration to yield a 75% inhibitory concentration (IC 75). After recovery from chemotherapy treatment, shRNA tags were isolated and quantified by deep sequencing. (B) Venn diagram illustrating the number of genes identified as hits through Bioinformatics for Next-Generation Sequencing (BiNGS), redundancy and fold-change (RFC), or both. (C) Diagrammatic representation of the MAPK pathway genes, with shRNA identified as depleted (blue) or enriched (red) in the shRNA screen. Genes identified by both BiNGS and RFC analyses are indicated by an asterisk. These data were integrated with genes identified to be upregulated by copy number gains (green) or hypomethylated at cytosine guanine dinucleotide promoter regions (purple) at relapse in primary pediatric ALL samples.
To identify hits from the screen, we applied 2 established methods for high throughput screening: Bioinformatics for Next-Generation Sequencing24 and redundancy and fold-change.17 These analyses revealed 206 genes involved in modulating the cellular response to prednisolone in ALL, including 102 identified by both analyses (P < 1 × 10⁻³⁰; Figure 1B). Complete lists of genes identified by each analysis method and their overlap are provided in supplemental Tables 3-5.
Integrated analysis reveals MAPK pathway involvement in prednisolone resistance in ALL
To determine pathways likely involved in prednisolone resistance, we performed gene ontology analysis using Database for Annotation, Visualization, and Integrated Discovery Bioinformatics25,26 (supplemental Figure 2). Notably, genes associated with kinase signaling were the most enriched category, many of which are associated with MAPK signaling cascades (Figure 1D and supplemental Figure 2). When we compared data from our functional screen, we noted that several of the genes and signaling pathways that were suggested to mediate GC sensitivity (including those in the MAPK pathways) were also altered in expression level or methylation status or were mutated in relapse samples from children with ALL, as compared to diagnosis samples (Figure 1C and supplemental Figure 3). We chose to validate 2 genes identified in the screen: MEK4, which is directly upstream of JNK, and MEK2, which activates ERK.
MEK4 knockdown increases sensitivity to prednisolone by increasing GR levels
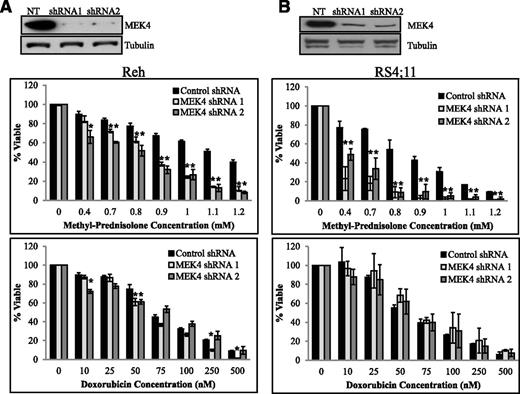
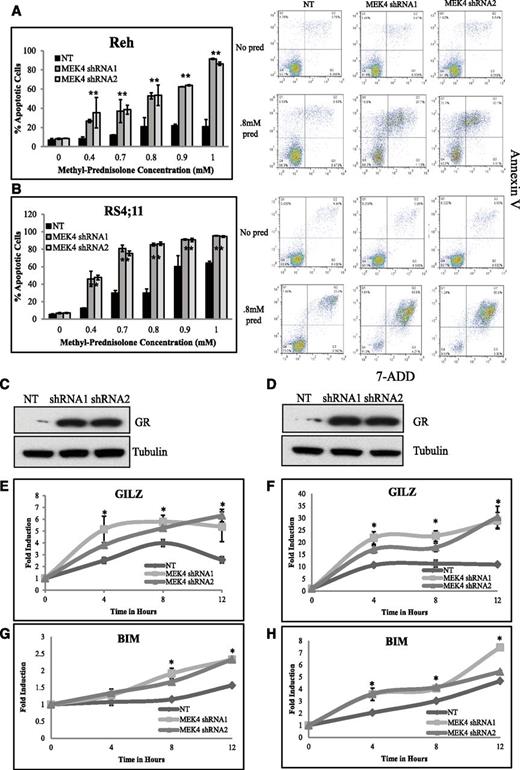
To validate the MAPK pathway’s involvement in mediating GC agonist sensitivity, we knocked down MEK4 using 2 shRNAs in the cell lines Reh (Figure 2A) and RS4;11 (Figure 2B) and measured cell viability upon chemotherapy treatment. MEK4 knockdown resulted in increased sensitivity to prednisolone treatment compared to the control non (mammalian)-targeting shRNA (NT) cell line (Figure 2) but did not alter the cellular response to doxorubicin (Figure 2), etoposide, or 6-thioguanine (supplemental Figure 4). To confirm that MEK4 knockdown increased sensitivity to prednisolone-induced cell death, we measured the percentage of apoptotic cells in control and knockdown cells upon prednisolone treatment. We observed an increased level of apoptotic cells upon prednisolone treatment in MEK4-knockdown Reh (Figure 3A) and RS4;11 cells (Figure 3B) compared to control cells using the NT, and no changes in baseline cell death without treatment with prednisolone.
MEK4 knockdown increases sensitivity to prednisolone. Western blot for MEK4 in the control NT cell line and in the shRNA-expressing Reh (A, top) or RS4;11 cell line (B, top). NT and MEK4-targeting shRNA Reh (A) and RS4;11 cells (B) were treated with increasing concentrations of prednisolone (middle) or doxorubicin (bottom) for 24 hours. Cell viability was measured by CellTiter-Glo assay. *P ≤ .05. NT, non(mammalian)-targeting shRNA.
MEK4 knockdown increases sensitivity to prednisolone. Western blot for MEK4 in the control NT cell line and in the shRNA-expressing Reh (A, top) or RS4;11 cell line (B, top). NT and MEK4-targeting shRNA Reh (A) and RS4;11 cells (B) were treated with increasing concentrations of prednisolone (middle) or doxorubicin (bottom) for 24 hours. Cell viability was measured by CellTiter-Glo assay. *P ≤ .05. NT, non(mammalian)-targeting shRNA.
MEK4 knockdown increases prednisolone-induced apoptosis by increasing GR levels. Percentage of apoptotic cells upon prednisolone treatment in control cells compared to MEK4-knockdown Reh (A) and RS4;11 cells (B). Representative scatter plots of annexin V staining (y-axis) and 7-aminoactinomycin D (7-ADD; x-axis) are shown for NT and MEK4-knockdown cells treated with no drug or 0.8 mM of prednisolone (pred) for 24 hours are shown adjacent to the apoptosis bar graphs. Western blot for the GR in control NT and in MEK4-knockdown cell lines Reh (C) and RS4;11 (D). Fold induction of GR target genes GILZ and BIM at 4, 8, and 12 hours after prednisolone exposure in Reh (E,G) and RS4;11 cells (F,H). Mean values of 3 replicate experiments are depicted, with error bars representing standard deviation. *P ≤ .05.
MEK4 knockdown increases prednisolone-induced apoptosis by increasing GR levels. Percentage of apoptotic cells upon prednisolone treatment in control cells compared to MEK4-knockdown Reh (A) and RS4;11 cells (B). Representative scatter plots of annexin V staining (y-axis) and 7-aminoactinomycin D (7-ADD; x-axis) are shown for NT and MEK4-knockdown cells treated with no drug or 0.8 mM of prednisolone (pred) for 24 hours are shown adjacent to the apoptosis bar graphs. Western blot for the GR in control NT and in MEK4-knockdown cell lines Reh (C) and RS4;11 (D). Fold induction of GR target genes GILZ and BIM at 4, 8, and 12 hours after prednisolone exposure in Reh (E,G) and RS4;11 cells (F,H). Mean values of 3 replicate experiments are depicted, with error bars representing standard deviation. *P ≤ .05.
Prednisolone induces apoptosis through GC signaling by the GR.27 Upon MEK4 knockdown, we observed an increased level of the GR protein and messenger RNA level compared to control NT in both Reh (Figure 3C and supplemental Figure 5) and RS4;11 (Figure 3C and supplemental Figure 5). The increased level of the GR in MEK4-knockdown lines correlated with a greater level of prednisolone-induced expression of GILZ and BIM in Reh (Figure 3E,G) and RS4;11 (Figure 3F,H). GR transcriptional activity is mediated by various phosphorylation events,28-30 including a negatively regulating phosphorylation site at serine 226, which is mediated by JNK.30 Phosphorylation at this site enhances nuclear export and degradation of GR. Upon MEK4 knockdown, we observed a decreased ratio of phosphorylated GR at serine 226 compared to the control NT cells (supplemental Figure 6). In addition, we found upon knockdown of JNK an increased level of total GR as well as an increase in prednisolone sensitivity (supplemental Figure 7). The increased GR level and GC signaling likely contribute to specific sensitization to GC agonists upon MEK4 knockdown.
Increased sensitivity to chemotherapy upon MEK2 knockdown is p53 dependent
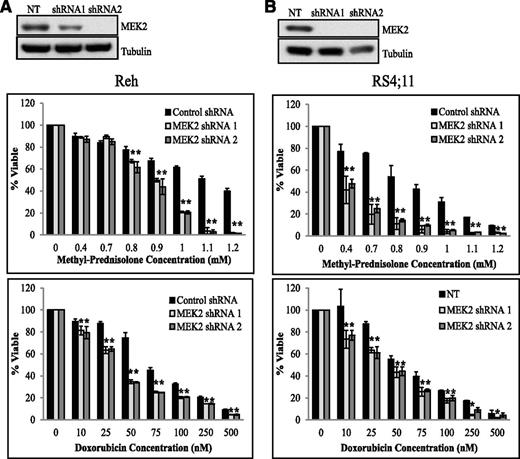
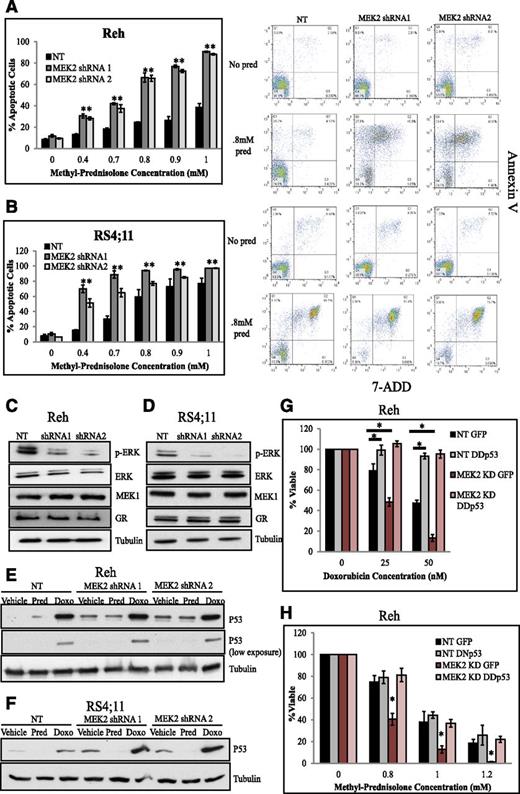
We next validated that MEK2 knockdown increases sensitivity to prednisolone by depleting MEK2 using 2 shRNAs in Reh (Figure 4A) and RS4;11 cells (Figure 4B) and measuring cell viability upon chemotherapy treatment. Knockdown of MEK2 resulted in decreased cell viability compared to control NT upon treatment with increasing concentrations of prednisolone, doxorubicin, etoposide, and 6-thioguanine in Reh (Figure 4A and supplemental Figure 8) and RS4;11 cells (Figure 4B and supplemental Figure 8). To confirm that MEK2 knockdown increased sensitivity to prednisolone- and doxorubicin-induced cell death, we measured the percentage of apoptotic cells in control and knockdown cell lines upon prednisolone or doxorubicin treatment and observed an increased level of apoptotic cells in MEK2-knockdown Reh (Figure 5A and supplemental Figure 9A) and RS4;11 cells (Figure 5B and supplemental Figure 9B) compared to control lines and no changes in baseline cell death.
MEK2 knockdown increases sensitivity to chemotherapy. Western blot for MEK2 in the control NT cell line and in the shRNA-expressing Reh (A, top) and RS4;11 cell lines (B, top). NT and MEK2-targeting shRNA Reh (A) and RS4;11 cells (B) were treated with increasing concentrations of prednisolone (middle) or doxorubicin (bottom) for 24 hours. Cell viability was measured by CellTiter-Glo assay. *P ≤ .05. Cell viability assays for MEK4 and MEK2 were performed in the same experiment and compared to the same control NT. The bars for the control NT are the same in this figure as shown in Figure 2. We have separated the graphs for simplicity.
MEK2 knockdown increases sensitivity to chemotherapy. Western blot for MEK2 in the control NT cell line and in the shRNA-expressing Reh (A, top) and RS4;11 cell lines (B, top). NT and MEK2-targeting shRNA Reh (A) and RS4;11 cells (B) were treated with increasing concentrations of prednisolone (middle) or doxorubicin (bottom) for 24 hours. Cell viability was measured by CellTiter-Glo assay. *P ≤ .05. Cell viability assays for MEK4 and MEK2 were performed in the same experiment and compared to the same control NT. The bars for the control NT are the same in this figure as shown in Figure 2. We have separated the graphs for simplicity.
MEK2 knockdown increases chemotherapy-induced apoptosis by decreasing pERK levels and increasing levels of p53. Percentage of apoptotic cells upon prednisolone treatment in control NT cells compared to MEK2 knockdown Reh (A) and RS4;11 cells (B). Representative scatter plots of annexin V staining (y-axis) and 7-aminoactinomycin D (7-ADD; x-axis) are shown for NT and MEK2-knockdown cells treated with no drug or 0.8 mM of prednisolone (pred) for 24 hours are shown adjacent to the apoptosis bar graphs. Western blots for pERK, ERK, MEK1, and GR in control NT and in MEK2-knockdown Reh (C) and RS4;11 cell lines (D). Western blots for p53 in control NT and in MEK2-knockdown Reh (E) and RS4;11 cell lines (F) treated with 0.8 mM prednisolone (pred) or 50 nM doxorubicin (doxo) for 24 hours. Cell viability was measured in Reh control NT cells expressing GFP (NT GFP), NT cells expressing dimerization domain dominant-negative p53 (NT DDp53), MEK2-knockdown lines expressing green fluorescent protein (MEK2 KD GFP), or MEK2-knockdown lines expressing dimerization domain dominant-negative p53 (MEK2 KD DDp53); cells were treated with indicated concentrations of doxorubicin (G) or prednisolone (H) for 24 hours. *P ≤ .05. pERK, phosphorylated ERK.
MEK2 knockdown increases chemotherapy-induced apoptosis by decreasing pERK levels and increasing levels of p53. Percentage of apoptotic cells upon prednisolone treatment in control NT cells compared to MEK2 knockdown Reh (A) and RS4;11 cells (B). Representative scatter plots of annexin V staining (y-axis) and 7-aminoactinomycin D (7-ADD; x-axis) are shown for NT and MEK2-knockdown cells treated with no drug or 0.8 mM of prednisolone (pred) for 24 hours are shown adjacent to the apoptosis bar graphs. Western blots for pERK, ERK, MEK1, and GR in control NT and in MEK2-knockdown Reh (C) and RS4;11 cell lines (D). Western blots for p53 in control NT and in MEK2-knockdown Reh (E) and RS4;11 cell lines (F) treated with 0.8 mM prednisolone (pred) or 50 nM doxorubicin (doxo) for 24 hours. Cell viability was measured in Reh control NT cells expressing GFP (NT GFP), NT cells expressing dimerization domain dominant-negative p53 (NT DDp53), MEK2-knockdown lines expressing green fluorescent protein (MEK2 KD GFP), or MEK2-knockdown lines expressing dimerization domain dominant-negative p53 (MEK2 KD DDp53); cells were treated with indicated concentrations of doxorubicin (G) or prednisolone (H) for 24 hours. *P ≤ .05. pERK, phosphorylated ERK.
Unlike MEK4 knockdown, MEK2 knockdown did not affect the levels of the GR in Reh (Figure 5C) or RS4;11 cells (Figure 5D), which is consistent with the observation that MEK2 knockdown causes increased sensitivity to all cytotoxic agents and, therefore, is not specific to the GC agonists. To further examine the mechanism by which MEK2 knockdown mediates chemosensitivity, we measured levels of pERK, a known target of both MEK2 and MEK1.31 Upon MEK2 knockdown, we observed decreased levels of pERK compared to controls and no changes in MEK1 or total ERK levels in Reh (Figure 5C) and RS4;11 cells (Figure 5D).
ERK has been shown to regulate a variety of cellular functions, including cell death through modulation of p53 levels.31,32 Given the relationship between ERK and p53, we hypothesized that decreased levels of pERK would correlate with increased levels of p53. Upon MEK2 knockdown, we observed an increase in basal levels of p53 compared to the control Reh (Figure 5E) and RS4;11 cells (Figure 5F). We also observed an increase in p53 levels upon stimulation with 50 nM doxorubicin (Figure 5E-F), consistent with previous findings,33 and an enhancement of this induction with MEK2-knockdown cell lines compared to control cells (Figure 5E-F). We speculate that the increased levels of p53 in the MEK2-knockdown and trametinib-treated cells prime the cells to undergo apoptosis upon chemotherapy treatment.
Next, we tested whether the increased sensitivity to chemotherapy upon MEK2 knockdown was p53 dependent by expressing either a green fluorescent protein–expressing empty vector (EV) or a dimerization domain dominant-negative p53 (DDp53) and green fluorescent protein in the control NT and MEK2-knockdown Reh cell lines.34 As expected, cells expressing the DDp53 construct were significantly more resistant to doxorubicin than EV controls,33 confirming that DDp53 interferes with induction of apoptosis by wild-type p53 (Figure 5G). Consistent with previous results (Figure 4A), MEK2-knockdown cells with EV are more sensitive to doxorubicin as compared to control NT cells; however, the expression of DDp53 abrogated chemosensitization due to MEK2 knockdown (Figure 5G). Consistent with previous findings (Figure 4A), cells with MEK2 knockdown and EV were also more sensitive to prednisolone than those with nonsilencing shRNA (Figure 5H). In contrast to doxorubicin, the expression of DDp53 alone did not result in significant change to prednisolone sensitivity in control lines (Figure 5H), consistent with the non-p53-dependent mechanism of GC-induced cell death.34 However, expression of DDp53 in the MEK2-knockdown lines rescued prednisolone resistance comparable to the control cell lines (Figure 5H). Together, these data indicate that MEK2 knockdown enhances sensitivity to prednisolone in a p53-dependent manner.
Inhibition of MEK1/2 increases sensitivity of ALL cell lines to chemotherapy
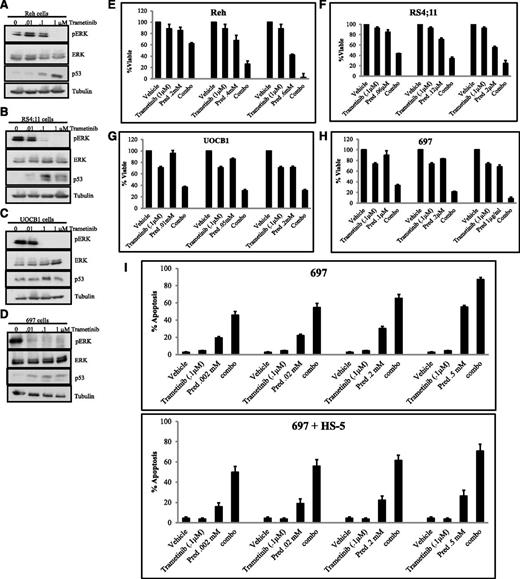
To further validate the role of MEK2 in mediating sensitivity of ALL cells to treatment, we used pharmacologic inhibition of MEK1/2 with the US Food and Drug Administration–approved MEK1/2 inhibitor trametinib in combination with cytotoxic chemotherapy. We treated the B-precursor ALL cells Reh, RS4;11, UOCB1, and 697 with increasing doses (0, 0.01, 0.1, 1 μM) of trametinib for 48 hours and measured levels of pERK by western blot analysis (Figure 6A-D). In addition to decreased phosphorylation of ERK, we observed an increased level in p53 upon trametinib treatment (Figure 6A-D). Next, we determined the effect of trametinib treatment on cell viability. We observed a minimal effect on cell viability in Reh, RS4;11, UOCB1, and 697 cells treated with trametinib for 48 hours (supplemental Figure 10A-D).
Inhibition of MEK1/2 increases sensitivity to prednisolone. Western blots for pERK, ERK, and p53 in Reh (A), RS4;11 (B), UOCB1 (C), and 697 cells (D) treated with 0.01 μM, 0.1 μM, or 1.0 μM trametinib for 48 hours. Cell viability was measured in Reh (E), RS4;11 (F), UOCB1 (G), and 697 cells (H) treated with the indicated concentration of trametinib, increasing concentrations of prednisolone (pred), or a combination of trametinib and prednisolone (combo) for 48 hours. (I) Percentage of apoptotic 697 cells grown alone or cocultured with HS-5 BMSCs upon treatment with prednisolone (pred), 0.1 μM trametinib, or a combination of prednisolone and 0.1 μM trametinib (combo).
Inhibition of MEK1/2 increases sensitivity to prednisolone. Western blots for pERK, ERK, and p53 in Reh (A), RS4;11 (B), UOCB1 (C), and 697 cells (D) treated with 0.01 μM, 0.1 μM, or 1.0 μM trametinib for 48 hours. Cell viability was measured in Reh (E), RS4;11 (F), UOCB1 (G), and 697 cells (H) treated with the indicated concentration of trametinib, increasing concentrations of prednisolone (pred), or a combination of trametinib and prednisolone (combo) for 48 hours. (I) Percentage of apoptotic 697 cells grown alone or cocultured with HS-5 BMSCs upon treatment with prednisolone (pred), 0.1 μM trametinib, or a combination of prednisolone and 0.1 μM trametinib (combo).
We determined whether the effect of trametinib treatment would increase sensitivity to chemotherapy. We treated Reh, RS4;11, UOCB1, and 697 cells with the minimal concentrations of trametinib that reduced the levels of pERK in combination with prednisolone or doxorubicin for 48 hours and measured cell viability by CellTiter-Glo assay. We observed potentiated effects upon treatment with trametinib and prednisolone (Figure 6E-H) in all cells tested. Of importance, prednisolone exposure did not increase the levels of pERK alone or upon trametinib treatment (supplemental Figure 11). In addition, potentiated effects were observed upon treatment with trametinib and doxorubicin (supplemental Figure 12). These data suggest that combining MEK1/2 inhibitors with traditional cytotoxic chemotherapy may combat resistance to chemotherapy in relapsed ALL.
On the basis of mounting evidence showing that stromal cells within the bone marrow microenvironment provide a proactive niche for leukemic cells35-37 and lead to activation of the MAPK pathway,38,39 we examined the sensitivity of the ALL cell lines to cytotoxic chemotherapy in combination with MEK1/2 inhibition when cocultured with human bone marrow stromal cells (BMSCs). First, we measured the levels of apoptosis in 697 cells alone or cocultured with HS-5 cells upon prednisolone treatment. We observed a significant decrease in apoptosis in response to prednisolone when cells were cocultured with stoma (supplemental Figure 13A). Trametinib treatment produced a similar response in 697 cells alone or cocultured with HS-5 cells (data not shown). To determine whether BMSCs affect activation of MAPK in ALL cells, 697 cells alone or cocultured with HS-5 cells were treated with increasing trametinib doses (0 μM, 0.1 μM, 1 μM) for 48 hours, and the level of pERK was measured via western blot analysis. The presence of the HS-5 cells led to an increase in pERK compared to 697 cells alone when left untreated, consistent with the hypothesis that increased ERK activation results in prednisolone resistance. Treatment with 0.1 μM and 1.0 μM trametinib resulted in a complete loss of pERK in 697 cells alone and in those that were removed from the HS-5 (supplemental Figure 13B). Although a reduction in pERK levels was observed only when both HS-5 and 697 cells were collected (supplemental Figure 13B), the increase or lack of pERK reduction in HS-5 cells alone treated with trametinib would suggest that the decrease observed upon collection of both HS-5 and 697 cells was due to the effect of trametinib on 697 cells. These data suggest that trametinib can inhibit cell autonomous and BMSC-dependent activation of ERK.
On the basis of trametinib’s ability to reduce pERK in 697 cells, even in the presence of HS-5 cells, we determined the effects of combination treatment. Potentiated effects for all concentrations tested were observed when we examined the levels of apoptosis in 697 cells alone or with HS-5 cells upon treatment with 0.1 μM trametinib (Figure 6I) or 1 μM trametinib (supplemental Figure 13) and increasing doses of prednisolone for 48 hours. Furthermore, combination treatment was able to overcome the protective effect of the HS-5 cells (Figure 6I and supplemental Figure 13C). Overall, these data suggest that inhibition of the MEK1/2 pathway combined with chemotherapy not only enhances cell death in relapsed ALL but also overcomes BMSC protection, which is imperative to therapeutic success in vivo.
Relapsed ALL samples have increased MAPK pathway activation and respond to trametinib treatment in vivo
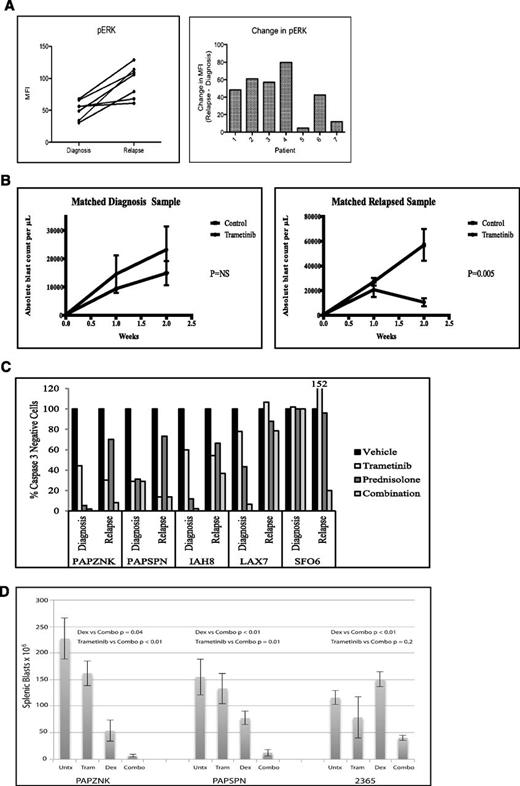
We measured the levels of pERK in 7 paired diagnosis-relapse primary patient samples by multiparameter phospho flow cytometry. We observed increased pERK levels (P = .0025) at relapse compared to diagnosis (Figure 7A), with 5 of the 7 pairs having at least a 40% increase in pERK levels and the additional 2 pairs having only a minimal increase in pERK levels. We next measured the response of 2 relapse samples and 1 diagnosis-relapse matched pair to trametinib treatment in vivo. We observed a significant reduction in leukemia burden upon trametinib treatment in the mice engrafted with the relapsed leukemia samples (supplemental Figure 14 and Figure 7D); however, we did not observe an effect of trametinib treatment on the diagnosis sample (Figure 7B). It is possible that the relapse samples respond better to trametinib than the diagnosis sample due to the increased level of pERK observed at relapse compared to diagnosis. These findings support the use of trametinib as a potential treatment of relapsed ALL.
Primary relapse ALL samples demonstrate increased sensitivity to prednisolone upon trametinib inhibition and increased pERK levels compared to diagnosis samples. (A) Phospho flow cytometry analysis of 7 matched diagnosis-relapse primary samples for levels of pERK. A statistically significant increase (P < .0025) in phosphorylated ERK at relapse compared to diagnosis was found. (B) Absolute blast count in mice engrafted with a matched diagnosis-relapse pair treated with control vehicle or trametinib. (C) Five primary diagnosis-relapse matched pairs were treated ex vivo with trametinib, prednisolone, or combination of trametinib and prednisolone for 48 hours. The cells were stained for activated caspase 3 as a measure of cell viability by phospho flow cytometry. (D) Splenic blast count in mice engrafted with relapse samples treated with vehicle (Untx), trametinib (Tram), dexamethasone (Dex), or a combination (Combo) of trametinib and dexamethasone.
Primary relapse ALL samples demonstrate increased sensitivity to prednisolone upon trametinib inhibition and increased pERK levels compared to diagnosis samples. (A) Phospho flow cytometry analysis of 7 matched diagnosis-relapse primary samples for levels of pERK. A statistically significant increase (P < .0025) in phosphorylated ERK at relapse compared to diagnosis was found. (B) Absolute blast count in mice engrafted with a matched diagnosis-relapse pair treated with control vehicle or trametinib. (C) Five primary diagnosis-relapse matched pairs were treated ex vivo with trametinib, prednisolone, or combination of trametinib and prednisolone for 48 hours. The cells were stained for activated caspase 3 as a measure of cell viability by phospho flow cytometry. (D) Splenic blast count in mice engrafted with relapse samples treated with vehicle (Untx), trametinib (Tram), dexamethasone (Dex), or a combination (Combo) of trametinib and dexamethasone.
Inhibition of MEK1/2 increases sensitivity of primary relapse ALL samples to prednisolone, independent of Ras mutations
We next measured the effects of combined trametinib and prednisolone in primary ALL samples. Primary diagnosis-relapse pairs were treated with trametinib, prednisolone, or trametinib plus prednisolone ex vivo for 48 hours (Figure 7C and supplemental Figure 15). As a single agent, trametinib decreased viability in a subset of samples. In 4 of the 5 pairs, the relapse samples were more resistant to prednisolone treatment compared to their matched diagnostic samples, consistent with previous findings.5 Cotreatment with trametinib sensitized 3 of the 5 relapse samples (PAPZNK, IAH8, and SFO6) to prednisolone. We next considered whether the sensitivity to combination trametinib and prednisolone correlated with the presence of Ras mutations, which is the most common set of mutated oncogenes in cancer and an upstream activator of the MAPK/ERK pathway.40,41 The sensitivity to combination therapy did not correlate with the presence of Ras mutations in our small patient cohort. Only patient 1 was found to have a Ras mutation out of the patient samples that responded well to combination therapy (Table 1). Both of the patient samples that did not respond to combination treatment had Ras mutations at relapse (Table 1). Combination treatment sensitized 1 out of 5 diagnosis samples (LAX7) to prednisolone. We next confirmed these results in vivo by engrafting 3 primary relapse samples into recipients and treating the mice with vehicle, trametinib, dexamethasone, or trametinib plus dexamethasone combination (Figure 7D). Trametinib treatment reduced pERK levels in vivo (supplemental Figure 16). The number of blasts was reduced in all the mice receiving combination treatment compared to dexamethasone treatment alone. The mice engrafted with leukemia samples from patients PAPSNK and PAPSNP had significantly reduced tumor burdens with combination treatment compared to trametinib alone. Sample 2365 also showed reduced tumor burden with the combination therapy compared to trametinib alone but this reduction did not reach significance because of the greater impact of single-agent trametinib. Together, these data suggest that combination trametinib and prednisolone could be an effective therapeutic strategy for a subset of patients with relapsed ALL.
Ras mutations found in the coding regions of the Ras genes at relapse and diagnosis
| Patient . | Diagnosis . | Relapse . |
|---|---|---|
| PAPZNK | None | Nras G13D |
| PAPSPN | Kras G12D and Kras A146T | Kras A146T |
| IAH8 | None | None |
| LAX7 | None | Kras G12V |
| SFO6 | None | None |
| Patient . | Diagnosis . | Relapse . |
|---|---|---|
| PAPZNK | None | Nras G13D |
| PAPSPN | Kras G12D and Kras A146T | Kras A146T |
| IAH8 | None | None |
| LAX7 | None | Kras G12V |
| SFO6 | None | None |
Discussion
Resistance to GC agonists remains a major hurdle in the treatment of ALL.4 To identify mediators of prednisolone sensitivity, we performed a genome-scale, pooled shRNA screen in prednisolone-treated cells. Although differences in the genomics of newly diagnosed and relapsed ALL has been described previously,13,42-44 these data require further functional validation to elucidate the role of potential candidate genes in drug resistance. The integration of our functional screen with genomic data from ALL primary relapse samples allowed for the identification of genes and pathways likely driving GC resistance in vivo.
The MAPK pathway was one of the top pathways identified through our screen. Through this study, we have shown that MEK4 knockdown caused increased sensitivity to prednisolone. MEK4 increased sensitivity to GCs by increasing the levels of the GR and its transcriptional activity. The altered sensitivity to prednisolone upon MEK4 knockdown is likely dependent on JNK and the decreased phosphorylation of the GR at serine 226. In vitro models have demonstrated that increased GR levels or GC signaling by genetic manipulation or by using small molecules resulted in increased sensitivity to GC agonists, suggesting that this approach may be useful in the treatment of GC-resistant ALL.45-47 Overall, our data indicate that MEK4 is a potential target for GC-resistant pediatric B-precursor ALL.
We have also demonstrated that MEK2 knockdown results in increased sensitivity to all chemotherapeutic agents tested, making MEK2 a more desirable therapeutic target. Levels of p53 have been previously shown to be mediated through the MEK/ERK pathway.32 In this study, we show that MEK2 knockdown or inhibition increases sensitivity to chemotherapy in a p53-dependent manner. We hypothesize that the increased levels of p53 in the MEK2-knockdown and trametinib-treated cells prime the leukemia cells to undergo cell death upon cellular insult. This hypothesis is supported by previous studies demonstrating that higher levels of p53 promote apoptosis and that increases in p53 levels lower the cellular barrier for the initiation of apoptosis.48-50 GC agonists have been previously described to be p53-independent agents,34 which is supported by our in vitro data. However, pediatric ALL patients harboring p53 mutations have a decreased response to prednisolone in induction therapy,51 suggesting that in vivo p53 mutations may alter sensitivity to prednisolone. Furthermore, patients who demonstrate good clinical response to prednisolone have higher levels of p53 in the nucleus upon prednisolone exposure in vivo.52 The frequency of p53 mutations in pediatric ALL is low (2%-4%), although rates are higher in patients with relapsed disease, consistent with a role for p53 in successful killing of blasts with chemotherapy.44,53 Together, these data suggest that in patients without p53 mutation, increasing p53 levels through MEK inhibition may resensitize therapy-resistant ALL to traditional cytotoxic agents.
MEK1 and MEK2 are known to phosphorylate ERK.31 We have shown a decrease in pERK upon MEK2 knockdown or MEK1/2 inhibition in the ALL cells. Furthermore, patients express higher levels of pERK at relapse compared to diagnosis, suggesting that activation of the MEK/ERK pathway drives chemoresistance and eventual relapse in pediatric ALL. In addition, trametinib as a single agent reduced tumor burden in xenograft models using primary samples from patients with relapsed disease. This is likely due to the increased levels of pERK observed at relapse. These data suggest that activation of the MEK/ERK pathway may be critical in both the development of recurrent disease and in leukemogenesis, consistent with recent data showing outgrowth of Ras-mutated clones at relapse.54 Trametinib significantly increased sensitivity to prednisolone as well as to doxorubicin treatment in ALL cells, suggesting the use of trametinib or other MEK1/2 inhibitors with traditional agents. A subset of primary samples had decreased viability upon combination treatment compared to prednisolone or trametinib treatment alone; however, these differences were not statistically significant (data not shown) due to high levels of variability among the samples. Trametinib treatment resulted in a modest decrease in leukemia burden in vivo, but MEK2 knockdown did not kill the leukemia cells in vitro. We attribute these differences to the longer exposure of the leukemia cells to trametinib in vivo as well as the ability of trametinib to inhibit both MEK1 and MEK2. We have observed that increasing trametinib exposure time decreases cell viability (data not shown). Finally, we have demonstrated that the combination of dexamethasone and trametinib significantly reduces tumor burden in xenograft models compared to dexamethasone or trametinib alone. This result was also seen in cells and samples without Ras mutations, indicating activation of the MAPK pathway through additional mechanisms, and is supported by our gene expression and copy number data in patient samples.13
In summary, the integration of our functional shRNA screen with genomic data from primary diagnosis-relapse matched pairs has elucidated the role of the MAPK pathway in drug sensitivity and in the development of relapsed ALL. These data have led to the rapid identification of therapeutically relevant targets that can be quickly translated into clinical application.
The online version of this article contains a data supplement.
The publication costs of this article were defrayed in part by page charge payment. Therefore, and solely to indicate this fact, this article is hereby marked “advertisement” in accordance with 18 USC section 1734.
Acknowledgments
The authors thank Drs Herbert Samuels, Lawrence Gardner, Tiffaney Vincent, and Tori Fuller for many helpful discussions, reagents, and experimental expertise; and Dr MaryAnne Perle for providing the cytogenetic analysis of the UOCB1 cell line.
This work was supported by National Institutes of Health (NIH) National Cancer Institute (NCI) grant R01 CA140729 and NCI Cancer Center Support Grant 2P30CA016087-33 (W.L.C); NIH Training in Pharmacological Sciences grant T32 GM066704 (C.L.J.); NIH NCI grant 1R01 CA172385-01A1 and University of Colorado NCI Cancer Center Support Grant P30 CA046934 (C.C.P.); the Ira Sohn Conference Foundation (T.B.); the St Baldrick’s Foundation (D.S.B.); and American Cancer Society Research Scholar grant RSG-14-022-01-CDD (D.T.T.). M.M. is a Scholar of the Leukemia and Lymphoma Society and a Wellcome Trust Senior Investigator.
Authorship
Contribution: C.L.J., S.F., C.D.-M., N.A.E., K.B., A.J.W., F.P., T.B., D.S.B., S.R.d.R., W.B., S.D., E.P., T.M.B., and P.P.M. designed and performed the research; collected, analyzed, and interpreted the data; performed the statistical analysis; and wrote the manuscript; C.M.G. and J.W. analyzed and interpreted the data and performed the statistical analysis; D.T.T., E.A.R., M.L.H, M.M., M.L.L., S.P.H., J.Z., and M.J.G. designed the research and wrote the manuscript; and C.C.P. and W.L.C. designed and directed the research, analyzed and interpreted the data, and wrote the manuscript.
Conflict-of-interest disclosure: The authors declare no competing financial interests.
Correspondence: William L. Carroll, Laura and Isaac Perlmutter Cancer Center, New York University Langone Medical Center, Smilow 1201, 522 First Ave, New York, NY 10016; e-mail: william.carroll@nyumc.org; and Christopher C. Porter, University of Colorado School of Medicine,12800 East 19th Ave, RC1N 4101, Aurora, CO 80045; e-mail: chris.porter@ucdenver.edu.

