Key Points
miR-486-5p, a GATA1 regulated miR, is expressed in ML-DS and enhances their aberrant erythroid phenotype.
miR-486-5p cooperates with GATA1s to promote the survival of pre-leukemic and leukemic cells.
Abstract
Children with Down syndrome (DS) are at increased risk for acute myeloid leukemias (ML-DS) characterized by mixed megakaryocytic and erythroid phenotype and by acquired mutations in the GATA1 gene resulting in a short GATA1s isoform. The chromosome 21 microRNA (miR)-125b cluster has been previously shown to cooperate with GATA1s in transformation of fetal hematopoietic progenitors. In this study, we report that the expression of miR-486-5p is increased in ML-DS compared with non-DS acute megakaryocytic leukemias (AMKLs). miR-486-5p is regulated by GATA1 and GATA1s that bind to the promoter of its host gene ANK1. miR-486-5p is highly expressed in mouse erythroid precursors and knockdown (KD) in ML-DS cells reduced their erythroid phenotype. Ectopic expression and KD of miR-486-5p in primary fetal liver hematopoietic progenitors demonstrated that miR-486-5p cooperates with Gata1s to enhance their self renewal. Consistent with its activation of AKT, overexpression and KD experiments showed its importance for growth and survival of human leukemic cells. Thus, miR-486-5p cooperates with GATA1s in supporting the growth and survival, and the aberrant erythroid phenotype of the megakaryocytic leukemias of DS.
Introduction
Children with Down syndrome (DS) have a markedly increased risk for a subtype of myeloid leukemia (ML) classified by the World Health Organization as ML-DS.1 These acute megakaryocytic leukemias (AMKLs) often co-express erythroid genes and surface proteins2-4 and have unique clinical and genetic features.5-8 They evolve in two distinct clinical stages; up to 10% of affected children are born with a transient myeloid proliferative disorder and in a fifth of these patients, full blown ML-DS is diagnosed by the age of 4 years.7,9,10 Both the congenital transient leukemia and the established ML-DS are characterized by somatic in utero mutations in the X-chromosome gene GATA1, which arise during fetal liver (FL) hematopoiesis.11-14 GATA1 encodes a transcription factor that regulates the development and maturation of the megakaryocytic-erythroid lineages (lins).15 Strikingly, all GATA1 mutations in ML-DS result in the expression of a shorter isoform GATA1s, which lacks the amino terminal “transactivation domain.”12 These mutations have both loss- and gain-of-function consequences. Although GATA1s is less active than GATA1 in promoting megakaryocytic differentiation, it enhances proliferation of fetal megakaryocytic progenitors.12,16 Klusmann et al suggested that the enhancing effect on proliferation is caused by cooperation between GATA1s and insulin growth factor-PI3K-AKT-mTOR signaling during FL hematopoiesis.17
MicroRNAs (miRs) have multiple roles in regulating growth and differentiation of normal and leukemic hematopoietic cells.18-20 It has been previously demonstrated that miR-125b-2, encoded by a gene on chromosome 21, is overexpressed in ML-DS and cooperates with Gata1s in the transformation of FL hematopoietic progenitors.21 Here, we describe the expression and function of miR-486-5p in ML-DS. miR-486-5p is a muscle-enriched miR whose loss has been suggested to be involved in muscular dystrophy.22-26 While conflicting data were published regarding a tumor suppressive or oncogenic roles in several solid tumors,27-34 it has never been reported in hematologic malignancies. In this study, we show that miR-486-5p expression in ML-DS is enhanced by GATA1s, and promotes the survival and the unique erythroid phenotype of these megakaryoblastic leukemias.
Materials and methods
Cell lines
Human embryonic kidney 293T cells were grown in Dulbecco’s modified Eagle medium (GIBCO) supplemented with 10% fetal bovine serum (FBS) (GIBCO), 1% glutamine (GIBCO), penicillin (100 U/mL), and streptomycin (100 μg/mL) (GIBCO). Human leukemia cell lines, CMK, CMY, CMS, and K562 were grown in RPMI (GIBCO) supplemented with 10% FBS, 1% glutamine (GIBCO), penicillin (100 U/mL), and streptomycin (100 μg/mL). All cell lines were grown at 37°C and 5% CO2. G1ME cells35 were maintained in Minimum Essential Medium α (GIBCO) supplemented with 20% FBS, 1% glutamine, 1% penicillin/streptomycin (GIBCO), and 10 ng/mL thrombopoietin (TPO) (PeproTech). Following transduction, cells were cultured in differentiation medium containing 10 ng/mL TPO (PeproTech), 2 U/mL erythropoietin (EPO) (Amgen), and 50 ng/mL stem cell factor (SCF) (PeproTech).
Patient samples
RNA from diagnostic or remission bone marrow (BM) samples of DS-AMKL and non–DS-AMKL patients were obtained following informed consent from patients enrolled in the Children’s Oncology Group AAML0431 clinical trial “The Treatment of Down Syndrome Children With Acute Myeloid Leukemia and Myelodysplastic syndrome Under the Age of 4 Years” and from the Children’s Hospital of Michigan Leukemia Cell Bank. The samples were anonymized before shipping except for the information on the genetic subgroup. The study was approved by the institutional review boards of the Israeli Health Ministry, Sheba Medical Center, and Wayne State University according to the requirements of the Declaration of Helsinki. The FL studies were conducted according to the Declaration of Helsinki principles, under a protocol approved by the institutional review board at The Children’s Hospital of Philadelphia.
miR arrays
Custom miR microarrays were prepared by Rosetta Genomics Ltd as described previously.36 Briefly, DNA oligonucleotide probes were spotted in triplicate on coated microarray slides. About 3 to 5 μg of total RNA were labeled by ligation of an RNA-linker, p-rCrU-Cy/dye to the 3′ end. Slides were incubated with the labeled RNA and washed twice. Arrays were scanned at a resolution of 10 μm, and images were analyzed using SpotReader software (Niles Scientific, Portola Valley, CA). Microarray spots were combined and signals normalized to the expression of all the measured miRs as described previously.36 Significance of differences was assessed by a two-sided unpaired t test. Fold-change was calculated as the ratio of the median values of the normalized fluorescence signals in the 2 groups.
TaqMan miR assay
Total RNA, including miR, was extracted from cells using cold TRIzol (Invitrogen, Carlsbad CA). miR-125b-5p, miR-99a, miR-486-5p, miR-486-3p, RNU19, and RNU43-specific complementary DNAs were transcribed and amplified using gene-specific primer sets following the TaqMan miR assay protocol (Applied Biosystems, Foster City, CA). RNU19 or RNU43 were used as human internal controls, and snoRNA142 or snoRNA 202 were used as mouse internal controls. Samples were tested in duplicate on the Applied Biosystems 7900HT Fast Real-Time PCR System.
Real time quantitative reverse-transcription polymerase chain reaction (qRT-PCR)
qRT-PCR assays were developed to determine the level of messenger RNA (mRNA) expression of different genes using SYBR Green (Applied Biosystems, Warrington, United Kingdom). Forward and reverse primers (Sigma-Aldrich, St. Louis, MO) were designed from different exons in order to eliminate DNA contamination (see supplemental Table 1 on the Blood Web site). Actin was used as endogenous control. Human GATA1 and human pri-miR-486 expression were examined using TaqMan gene expression assay and RPLPO was used as endogenous control (Applied Biosystems). Samples were tested in duplicate on the Applied Biosystems 7900HT Fast Real-Time PCR System.
Retrovirus vectors
The MSCV-PIG retroviral vector was used to generate expression vectors for miR-486-5p, miR-125b, and miR-mutant-125b as previously described.37 Replication incompetent retroviruses were obtained by transient transfection of 293T cells with retroviral plasmids, together with pCGP and pMD2G for transducing the human leukemia cell line CMS, or pCMV-Eco for transducing FL mouse cells. Transduced cells were selected using 2 μg/mL puromycin or identified by green fluorescent protein expression.
Lentiviral vector expressing short hairpin RNA (shRNA) anti–miR-486-5p and miR-486-5p were kindly provided by Dr Ravi Bhatia (City of Hope National Medical Center, Duarte, CA). Replication incompetent retroviruses were obtained by transient transfection of 293T cells with retroviral plasmids, together with pVSVG, pREV, and pMDL.
MIGR1 retroviral vector expressing murine Gata1 or Gata1s38 were kindly provided by Dr J. Crispino (Northwestern University, Chicago, IL). pLKO.1 retroviral vector expressing shRNA anti-human GATA1 (all isoforms) and control vector were purchased from Sigma-Aldrich.
Western blotting
Protein extracts were prepared by resuspending cells in radioimmunoprecipitation assay lysis buffer containing 1% NP40, 0.5% Na-Deoxycholate, 0.1% sodium dodecyl sulfate, and protease inhibitors (Roche). Proteins were resolved on 10% sodium dodecyl sulfate-polyacrylamide gel electrophoresis gels and transferred to nitrocellulose membranes. Membranes were blocked with 5% nonfat milk in phosphate-buffered saline (PBS) and 0.1% Tween-20, and labeled with primary antibodies anti–β-Actin (#3700; Cell Signaling, Danvers, MA), total AKT (Cell Signaling), anti–P-AKT (Ser 473; Cell Signaling), and followed by incubation with a secondary, peroxidase-conjugated antibody (Jackson ImmunoResearch Laboratories; #115-035-146 and #115-035-144, diluted 1:10 000). Peroxidase activity was detected by exposing the membrane with chemiluminescence solution containing 150 mM Tris (pH 8.9), 0.22 mg/mL luminol (Sigma-Aldrich), 0.033 mg/mL paracoumaric acid (Sigma-Aldrich), and 0.015% H2O2.
Chromatin immunoprecipitation sequencing was performed as recently described.39
Megakaryocytic differentiation and miR profiling of human FL
Human FL mononuclear cells were cultured in serum-free medium (StemSpan SFEM, Stemcell Technologies, Vancouver, Canada) supplemented with 100 ng/mL TPO (R&D Systems, Minneapolis, MN), 40 μg/mL low density lipoprotein (Calbiochem, San Diego, CA) and 1% penicillin/streptomycin (Gibco Invitrogen, Carlsbad, CA). RNA was isolated from megakaryocytes on day 10 of differentiation with the RNeasy Kit (Qiagen) and hybridized to Affymetrix HuGene 1.0 ST arrays.
Sorting of mouse hematopoietic cells
BM cells were isolated from the femurs of 4-month-old C57BL/6 wild-type (WT) and GATA1s KI mice. Single-cell suspensions were washed in PBS with 0.05M EDTA and 0.1% bovine serum albumin. The lin− progenitors were isolated using the Lineage Cell Depletion Kit (Miltenyi Biotec). Megakaryocyte-erythroid progenitors (MEPs) (Sca1−, c-Kit+, FcRg−, and CD34−) were sorted from the Lin− population after staining with phycoerythrin (PE)-Cy7–conjugated anti–C-kit, fluorescein isothiocyanate-conjugated anti-Sca1, APC-conjugated FcgR, and PE-conjugated CD34 (eBioscience) using the BD FACSAria sorter (BD Biosciences). Erythroid cells (Ter 119+) were sorted from the Lin+ population after staining with fluorescein isothiocyanate-conjugated Ter119 (eBioscience), and megakaryocytic cells (CD41+) were sorted from the Lin+ population after staining with PE-conjugated CD41 (eBioscience) using the BD FACSAria sorter (BD Biosciences).
Flow cytometric analysis
Cells were washed in PBS, stained with 7-AAD for the exclusion of nonviable cells, and stained with PE-conjugated CD235ab (BioLegend), APC-conjugated CD61 (BioLegend), and APC-conjugated Annexin V (BD Pharmigen) according to the intended analysis. Analysis was performed on the Gallios flow cytometer and data were elaborated using Kaluza software (Coulter).
Proliferation assay
Proliferation was evaluated by MTT assay (Sigma-Aldrich) according to manufacturer’s instructions.
Analysis of G1ME cells
MIGR1 retroviral vectors expressing GATA1 or GATA1s were generated as described.40 G1ME cells were collected 72 hours after transduction. Ter119+ cells were isolated by 1 of 2 methods: 1) the cells were stained with a Ter119-APC antibody (BD Pharmingen) and separated on a FACSAria II cell sorter (BD Biosciences), or 2) they were stained with a Ter119-biotin antibody (BD Pharmingen) and isolated with EasySep RapidSpheres (Stemcell Technologies).
Methylcellulose cultures of transduced mouse FL cells
FL cells E12.5 were extracted from Gata1s knock-in (KI) or WT C57BL/6 mice. The cells were sorted for Ter119− cells using anti–Ter-119 magnetic MicroBeads (Miltenyi Biotec). Some 2 × 10⁵ Ter119− FL cells were transduced in 2 cycles of transduction with the following: miR-125b, mutant miR-125b, miR-486, or empty vector, together with 5 ug/mL polybrene. The next day, 1.5 × 10⁴ were seeded in MethoCult M3231 methylcellulose medium (Stemcell Technologies) supplied with 50 ng/mL murine TPO and 100 ng/mL murine SCF (PeproTech) in a 3-cm well plate. Approximately each week, the colonies were counted and replated (1.5 × 10⁴ cells) in the same condition. Four cycles of replating were performed.
Statistics
Data obtained from multiple experiments were reported as the mean ± SEM. Significance levels were determined by Student t test and analysis of variance (ANOVA) analysis. Pearson and linear regression tests were calculated using the SPSS program.
Results
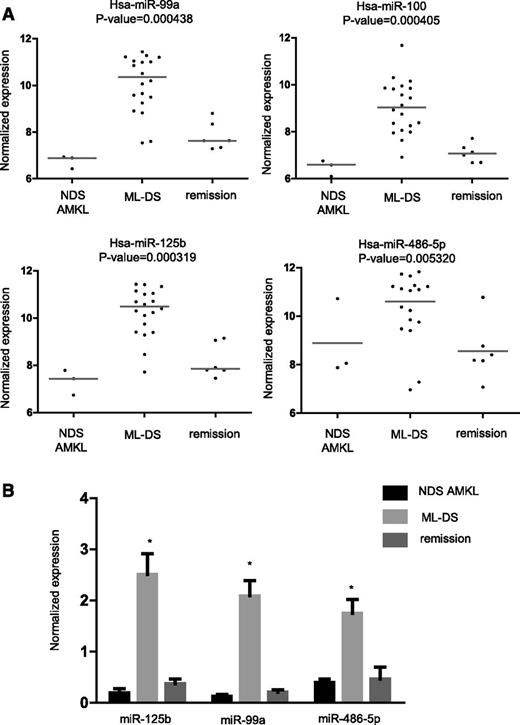
To identify miRs that are differentially expressed in ML-DS, we used micro-arrays to interrogate RNA derived from 20 diagnostic BM of patients with ML-DS, 6 with ML-DS in remission, and 3 with non-DS (NDS) AMKL. Four miRs, miR-99a, -100, -125b-2, and -486-5p, whose expression was highest in ML-DS (Figure 1A), were further validated by qRT-PCR in 55 independent BM samples (36 ML-DS at diagnosis, 7 ML-DS in remission, and 12 NDS-AMKL at diagnosis) (Figure 1B). miR-125b-2 and miR-99a are encoded by genes on chromosome 21, and were previously reported to be highly expressed and to have a leukemogenic role in ML-DS.21 miR-100 is a homolog of miR-99a. We decided, therefore, to further investigate miR-486 since it has never been reported to be associated with hematologic malignancies. We focused on the main isoform miR-486-5p, whose expression was higher than the miR-486-3p (supplemental Figure 1). We herein use the terminology “miR-486” to refer to both isoforms, and “miR-486-5p” or “miR-486-3p” for the specific isoforms.
miR expression in ML-DS. (A) Relative expression of 4 miRs that were found to be significantly overexpressed in diagnostic BM of ML-DS compared with NDS AMKL and DS BM remission samples. Relative expression is shown as log2 of the normalized fluorescence signal. (B) Independent validation by qRT-PCR on RNA derived from diagnostic BM samples of 36 ML-DS and 7 NDS-AMKL patients, and 12 DS BM remission samples. Expression values were normalized to the average expression of RNU19 and RNU43 endogenous controls. Standard errors are indicated. *P < .01, ANOVA.
miR expression in ML-DS. (A) Relative expression of 4 miRs that were found to be significantly overexpressed in diagnostic BM of ML-DS compared with NDS AMKL and DS BM remission samples. Relative expression is shown as log2 of the normalized fluorescence signal. (B) Independent validation by qRT-PCR on RNA derived from diagnostic BM samples of 36 ML-DS and 7 NDS-AMKL patients, and 12 DS BM remission samples. Expression values were normalized to the average expression of RNU19 and RNU43 endogenous controls. Standard errors are indicated. *P < .01, ANOVA.
Regulation of miR-486-5p expression in ML-DS
miR-486 is located in the last intron of ANK1, which encodes ankyrin-1, the prototype member of a family of proteins linking integral membrane proteins to the underlying spectrin-actin cytoskeleton. ANK1 was first discovered in erythrocytes and is mutated in hereditary spherocytosis,41,42 and is a known target of GATA1.43 Similar to the expression of miR-486, the expression of ANK1 mRNA is higher in BM cells of patients with ML-DS compared with non-DS AMKL (supplemental Figure 2A). Furthermore, GATA1 and GATA1s bind to the same site in the 5′ end of the erythroid isoform of ANK1, a site whose epigenetic analysis is consistent with an active promoter region (supplemental Figure 2B-C). Because miRs are often transcribed with their host genes,44-46 we hypothesized that GATA1 and GATA1s may regulate miR-486 expression.
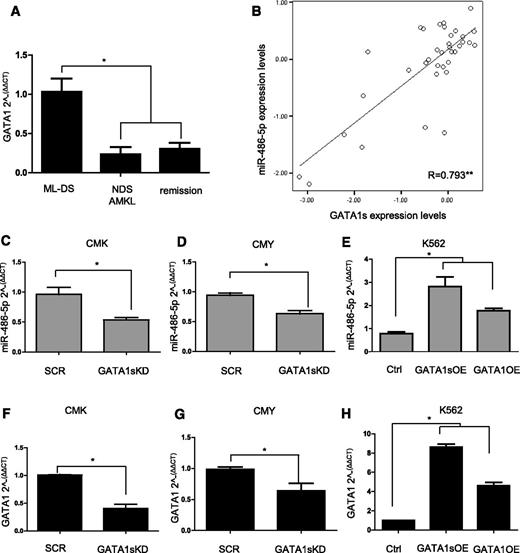
GATA1s is a short isoform of GATA1 that lacks the amino terminal domain. GATA1s is normally co-expressed with the full length GATA1 in MEPs, whereas only GATA1s is expressed in ML-DS.11,47 GATA1s was previously reported to be more highly expressed in ML-DS compared with NDS-AMKL.3 We confirmed the increased level of GATA1s mRNA in ML-DS (n = 36) compared with the levels of both isoforms of GATA1 in NDS-AMKL (n = 12) and in remission BM (n = 7) (Figure 2A, P = .009, ANOVA). We then observed that the level of miR-486-5p in DS diagnostic leukemia samples was highly correlated with the level of GATA1s expression (Figure 2B, R = 0.793, P < .01 ANOVA), suggesting that it may be regulated by GATA1s. Consistent with this hypothesis, the expression of miR-486-5p was reduced after shRNA-mediated knockdown (KD) of GATA1s in ML-DS CMK and CMY cells (Figure 2C-D). Conversely, ectopic expression of GATA1s or GATA1 full-length isorform (herein referred as “GATA1”) in the erythroid leukemia K562 cells enhanced the expression of miR-486-5p (Figure 2E). The magnitude of levels of miR-486-5p expression correlated with the magnitude of change in GATA1s or GATA1 in the 3 experiments (Figure 2F-H, compare panels C-E to F-H). Similar results were observed with miR-486-3p and with the primary 486 transcript pri-miR-486 (supplemental Figure 3), indicating that GATA1s regulates the transcription of miR-486. Together, these results suggest that the increased expression of miR-486 in DS-AMKL is at least partially caused by the increased expression of GATA1s.
Regulation of miR-486 expression by GATA1s. (A) GATA1 mRNA levels in diagnostic BM cells from ML-DS (n = 36) compared with NDS-AMKL (n = 12) and remission (n = 7). Only the GATA1s isoform is expressed in ML-DS, while the expression levels represent both isoforms in the other samples. *P < .01, ANOVA. (B) Pearson correlation test between the expression level of GATA1s mRNA and miR-486-5p in diagnostic BM from 36 ML-DS patients. **P < .01 level (2-tailed ANOVA). (C-E) qRT-PCR analysis for miR-486-5p expression after KD of GATA1s in CMK (C) and CMY (D) ML-DS cells, and after the OE of GATA1s or GATA1 in K562 erythroid leukemia cells (E). (F-H) qRT-PCR analysis of GATA1s or GATA1 mRNA in the leukemia cell lines after the KD or OE experiments, respectively. *P < .01 (2-tailed Student t test).
Regulation of miR-486 expression by GATA1s. (A) GATA1 mRNA levels in diagnostic BM cells from ML-DS (n = 36) compared with NDS-AMKL (n = 12) and remission (n = 7). Only the GATA1s isoform is expressed in ML-DS, while the expression levels represent both isoforms in the other samples. *P < .01, ANOVA. (B) Pearson correlation test between the expression level of GATA1s mRNA and miR-486-5p in diagnostic BM from 36 ML-DS patients. **P < .01 level (2-tailed ANOVA). (C-E) qRT-PCR analysis for miR-486-5p expression after KD of GATA1s in CMK (C) and CMY (D) ML-DS cells, and after the OE of GATA1s or GATA1 in K562 erythroid leukemia cells (E). (F-H) qRT-PCR analysis of GATA1s or GATA1 mRNA in the leukemia cell lines after the KD or OE experiments, respectively. *P < .01 (2-tailed Student t test).
miR-486 is an erythropoietic miR
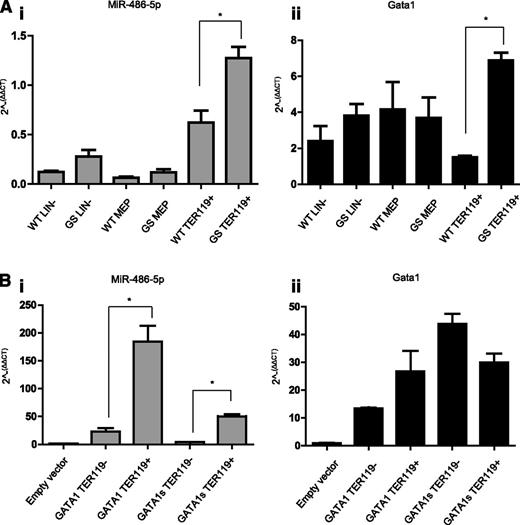
To further explore the regulation of miR-486 by GATA1s, we analyzed its expression in sorted hematopoietic cells from BM of wt and Gata1s KI male C57BL/6 mice.48 In both genotypes, the miR-486-5p was expressed in lin− and MEPs, and was dramatically increased in erythroid Ter119+ cells (Figure 3A; P < .01). Its expression in sorted CD41+ Ter119− megakaryocytic cells was barely detectable (data not shown). Within erythroid cells, its expression was higher in Gata1s KI correlating with the higher Gata1s mRNA levels (compare Figure 3Ai to Figure 3Aii).
miR-486-5p expression in the erythroid lin. (A) qRT-PCR analysis of miR-486-5p expression (i) and Gata1 (or Gata1s) expression in different BM cells populations separated by sorting. LIN− = lineage negative cells; MEP = megakaryocytic-erythroid progenitors (Sca1−, c-Kit+, FcRg−, and CD34−); Ter119+ = erythroid cells (Lin+, Ter 119+, and CD41−). Cells from Gata1s KI mice (GS) were compared with cells from Gata1 WT mice (n = 3). *P < .01 (2-tailed Student t test). miR-486-5p expression in megakaryocytic cells (CD41+ and Ter119−) was barely detectable and hence not shown. (B) qRT-PCR analysis of miR-486-5p (i) expression in G1ME cells overexpressing either Gata1s or Gata1. The level of Gata1 isoforms expression is depicted in panel Bii. Cells were grown for 3 days in megakaryocytic-erythroid differentiation medium (containing SCF, TPO, and EPO) and then sorted into TER119+ and TER119− cells. *P < .05 (2-tailed Student t test).
miR-486-5p expression in the erythroid lin. (A) qRT-PCR analysis of miR-486-5p expression (i) and Gata1 (or Gata1s) expression in different BM cells populations separated by sorting. LIN− = lineage negative cells; MEP = megakaryocytic-erythroid progenitors (Sca1−, c-Kit+, FcRg−, and CD34−); Ter119+ = erythroid cells (Lin+, Ter 119+, and CD41−). Cells from Gata1s KI mice (GS) were compared with cells from Gata1 WT mice (n = 3). *P < .01 (2-tailed Student t test). miR-486-5p expression in megakaryocytic cells (CD41+ and Ter119−) was barely detectable and hence not shown. (B) qRT-PCR analysis of miR-486-5p (i) expression in G1ME cells overexpressing either Gata1s or Gata1. The level of Gata1 isoforms expression is depicted in panel Bii. Cells were grown for 3 days in megakaryocytic-erythroid differentiation medium (containing SCF, TPO, and EPO) and then sorted into TER119+ and TER119− cells. *P < .05 (2-tailed Student t test).
To test more directly whether Gata1 regulates the expression of miR-486, we expressed either Gata1 or Gata1s by retroviral transduction of G1ME cells, a MEP-like cell line that was derived from Gata1 null embryonic stem cells.35 Cells were grown in a megakaryocytic–erythroid differentiation medium (containing TPO, EPO, and SCF) for 3 days and Ter119+ cells were subsequently isolated by either FACS sorting or magnetic bead purification. As seen in Figure 3Bi miR-486-5p was not expressed in parental G1ME cells and only weakly expressed in the Ter119− fraction of Gata1 or Gata1s expressing cells. In contrast, miR486-5p was dramatically upregulated upon Gata1, and to a lesser degree, Gata1s expression. The expression levels of Gata1 and Gata1s isoforms in Ter119+ cells were similar (Figure 3Bii). Together, the observations in the 2 mouse models suggest that miR-486-5p is primarily expressed in erythroid cells and the intensity of its regulation by the Gata1 and Gata1s isoforms may depend on the specific cellular/developmental contexts.
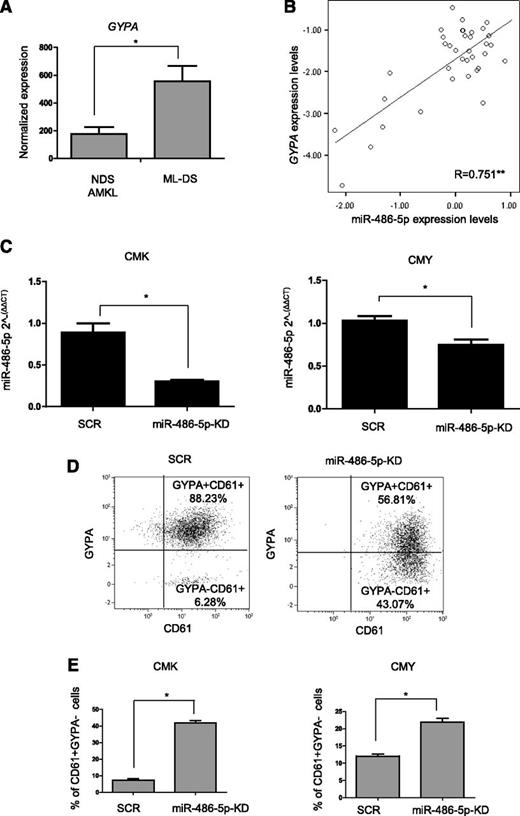
Consistent with the pattern of expression in mouse hematopoietic cells, GYPA mRNA, encoding the erythroid membrane protein glycophorin A, was 3 times higher in ML-DS compared with NDS-AMKL as determined by published micro-array analysis3 (Figure 4A). In our 36 diagnostic BM samples of ML-DS quantified by qRT-PCR, GYPA mRNA correlated significantly with the levels of miR-486-5p (Figure 4B) (R = 0.751, P < .01). To test whether miR-486-5p was involved in determining the erythroid phenotype, we knocked it down by shRNA in CMK and CMY ML-DS cells (Figure 4C). KD of miR-486 led to a marked decrease in the expression of glycophorin A (CD235) and an increase in the megakaryocytic marker CD61 (Figure 4D-E). These data suggest that the expression of miR-486-5p may contribute to the aberrant erythroid phenotype of the megakaryocytic leukemias of DS.
miR-486 is important for the ML-DS erythroid phenotype. (A) GYPA (glycophorin A and CD235) expression in diagnostic BM of ML-DS patients (n = 25) compared with non–DS-AMKL (n = 38), published microarray data.3 (B) Pearson correlation test between the expression level of GYPA and miR-486-5p determined by qRT-PCR in diagnostic BM of 36 ML-DS patients. **Correlation was statistically significant, P < .01 (ANOVA). (C) Expression of miR-486-5p in CMK and CMY ML-DS cells stably expressing shRNA anti–miR-486-5p (miR-486-5p-KD) or SCR. (D) GYPA and CD61 expression in CMK ML-DS cells stably expressing shRNA anti–miR-486-5p or SCR determined by flow cytometry. (E) Increase of cells with pure megakaryocytic phenotype (GYPA− and CD61+) in CMK and CMY ML-DS cells stably expressing shRNA anti–miR-486-5p in comparison with SCR. *P < .01 (2-tailed Student t test). SCR, scrambled.
miR-486 is important for the ML-DS erythroid phenotype. (A) GYPA (glycophorin A and CD235) expression in diagnostic BM of ML-DS patients (n = 25) compared with non–DS-AMKL (n = 38), published microarray data.3 (B) Pearson correlation test between the expression level of GYPA and miR-486-5p determined by qRT-PCR in diagnostic BM of 36 ML-DS patients. **Correlation was statistically significant, P < .01 (ANOVA). (C) Expression of miR-486-5p in CMK and CMY ML-DS cells stably expressing shRNA anti–miR-486-5p (miR-486-5p-KD) or SCR. (D) GYPA and CD61 expression in CMK ML-DS cells stably expressing shRNA anti–miR-486-5p or SCR determined by flow cytometry. (E) Increase of cells with pure megakaryocytic phenotype (GYPA− and CD61+) in CMK and CMY ML-DS cells stably expressing shRNA anti–miR-486-5p in comparison with SCR. *P < .01 (2-tailed Student t test). SCR, scrambled.
Pro-leukemogenic roles of miR-486-5p
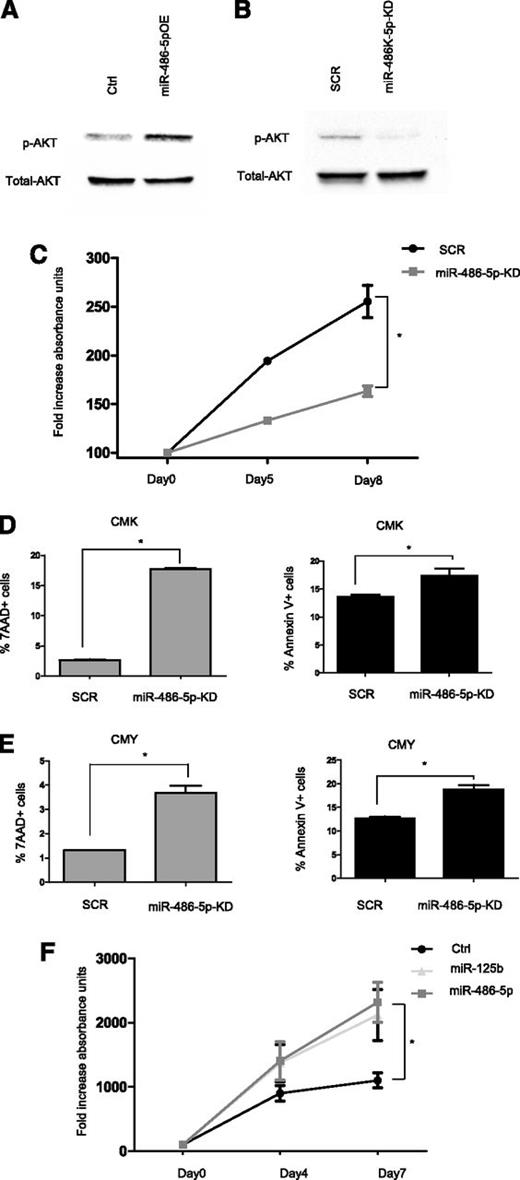
In myogenic cells miR-486 has been previously reported to activate PI3K/AKT through enhanced phosphorylation caused by targeting inhibitory phosphatases.22,24,25 We observed the same in leukemic cells by KD and overexpression (OE) of miR-486-5p in ML-DS and NDS-AMKL cells, respectively (Figure 5A,B). We (Y. Ge and J.W.T.) previously reported that ML-DS cells are highly sensitive to PI3K inhibitors.49 Accordingly, KD of miR-486 reduced the survival and increased apoptosis of ML-DS cells (Figure 5C-E). Conversely, OE of miR-486-5p in the NDS-AMKL CMS cells enhanced their growth (Figure 5F).
mir-486-5p enhances survival of ML-DS cells. (A-B) Western blot analysis of p-AKT levels (A) in CMS cells overexpressing miR-486-5p compared with empty vector (Ctrl) (B) in CMK cells after miR-486-5p KD compared with SCR. (C) MTT assay in CMK cells after miR-486-5p KD compared with SCR. *P < .01 (2-tailed Student t test). (D-E) FACS analysis of 7AAD and Annexin V positive cells in CMK (D) and CMY cells (E) after miR-486-5p KD compared with SCR. (F) MTT assay in CMS cells overexpressing miR-486-5p and miR-125b (positive control for growth-promoting miR18 ) or empty vector (Ctrl). *P < .05 (2-tailed Student t test) for each miR. SCR, scrambled.
mir-486-5p enhances survival of ML-DS cells. (A-B) Western blot analysis of p-AKT levels (A) in CMS cells overexpressing miR-486-5p compared with empty vector (Ctrl) (B) in CMK cells after miR-486-5p KD compared with SCR. (C) MTT assay in CMK cells after miR-486-5p KD compared with SCR. *P < .01 (2-tailed Student t test). (D-E) FACS analysis of 7AAD and Annexin V positive cells in CMK (D) and CMY cells (E) after miR-486-5p KD compared with SCR. (F) MTT assay in CMS cells overexpressing miR-486-5p and miR-125b (positive control for growth-promoting miR18 ) or empty vector (Ctrl). *P < .05 (2-tailed Student t test) for each miR. SCR, scrambled.
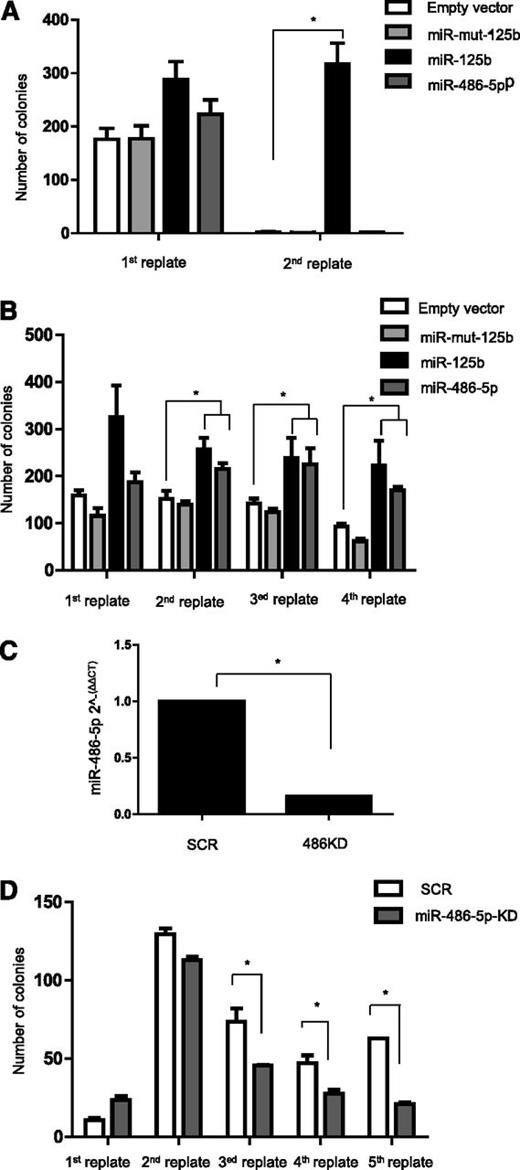
To test the oncogenic function of miR-486-5p directly in primary cells, we transduced E12.5 FL hematopoietic progenitors from C57BL/6 mice and conducted replating assays in vitro, as surrogate for self-renewal capacity.50 FL cells were transduced with miR-486-5p, miR-125b (positive control21 ), miR-125b mutated in its seed nucleotides (negative control37 ), or empty vector, and plated in methylcellulose cultures supplemented with TPO (50 ng/mL) and SCF (100 ng/mL). Colonies were counted and replated every week. Unlike miR-125b, a known myeloid oncogene,18 cells transduced with miR-486-5p did not form colonies beyond the first culture (Figure 6A).
miR-486-5p cooperates with Gata1s in enhancing growth and self-renewal of FL hematopoietic progenitors. Replating assay of Ter119− hemaopoietic progenitors isolated from E12.5 mouse FL. Cells were transduced with the indicated miR overexpressing or miR down-modulating vectors, cultured in methylcellulose (MC 3231) supplemented with TPO and SCF and replated weekly. miR-125b was used as a positive control of growth-promoting miR.18 (A) Number of colonies in the replating assay of cells isolated from C57BL/6 WT mice. Only miR-125b ectopic expression promoted the growth of progenitor cells. *P < .01 (2-tailed Student t test). (B) Number of colonies in the replating assay of cells isolated from Gata1s KI mice. Both miR-125b and miR-486-5p ectopic expression promoted the growth of progenitor cells. *P < .05 (2-tailed Student t test). (C) qRT-PCR analysis of miR-486-5p expression demonstrating the efficiency of retroviral-mediated miR-486-5p KD in Gata1s KI FL hematopoietic progenitors. (D) Number of colonies in the replating assay of cells isolated from Gata1s KI mice after miR-486-5p KD. The KD of miR-486-5p decreased the rereplating capacity of Gata1s cells. *P < .05 (2-tailed Student t test).
miR-486-5p cooperates with Gata1s in enhancing growth and self-renewal of FL hematopoietic progenitors. Replating assay of Ter119− hemaopoietic progenitors isolated from E12.5 mouse FL. Cells were transduced with the indicated miR overexpressing or miR down-modulating vectors, cultured in methylcellulose (MC 3231) supplemented with TPO and SCF and replated weekly. miR-125b was used as a positive control of growth-promoting miR.18 (A) Number of colonies in the replating assay of cells isolated from C57BL/6 WT mice. Only miR-125b ectopic expression promoted the growth of progenitor cells. *P < .01 (2-tailed Student t test). (B) Number of colonies in the replating assay of cells isolated from Gata1s KI mice. Both miR-125b and miR-486-5p ectopic expression promoted the growth of progenitor cells. *P < .05 (2-tailed Student t test). (C) qRT-PCR analysis of miR-486-5p expression demonstrating the efficiency of retroviral-mediated miR-486-5p KD in Gata1s KI FL hematopoietic progenitors. (D) Number of colonies in the replating assay of cells isolated from Gata1s KI mice after miR-486-5p KD. The KD of miR-486-5p decreased the rereplating capacity of Gata1s cells. *P < .05 (2-tailed Student t test).
The GATA1s isoform has been shown to enhance the proliferation and self-renewal of myeloid progenitors.16,17,48,50 Therefore, we next asked whether miR-486-5p can enhance the oncogenic effects of Gata1s similar to what was shown for miR-125b.21 E12.5 Gata1s KI FL hematopoietic progenitors were transduced with the same vectors and replating assays were performed for 4 cycles (Figure 6B). As was previously reported,21 the presence of Gata1s alone enabled self-renewal that was markedly enhanced by miR-125b as measured by the numbers of colonies in each cycle of replating. miR-486-5p also enhanced replating efficiency, although to a lesser degree than miR-125b (P < .05, 2-tailed Student t test).
Because miR-486 is already expressed in Gata1s hematopoietic progenitors (Figure 3A), we next asked if this endogenous expression contributes to the self-renewal capacity endowed by Gata1s. Thus, we transduced primary E12.5 FL Gata1s KI hematopoietic progenitors with shRNA against miR-486-5p, achieving 90% KD (Figure 6C) and observed progressively reduced numbers of colonies in each replating (Figure 6D, P < .05, 2-tailed Student t test).
Collectively, our data suggest that the GATA1s in DS-AMKL enhances the expression of miR-486, which then collaborates with GATA1s in enhancing self-renewal of FL hematopoietic progenitors.
Discussion
The MLs of DS are unique in the expression of somatically mutated GATA1, preserving the GATA1s isoform, and the co-expression of megakaryocytic and erythroid markers on the surface of the same cells. There is no normal counterpart to such cells as the bi-potential MEPs express neither megakaryocytic nor erythroid differentiation antigens. Here, we report that miR-486-5p enhances the survival and the erythroid immunophenotype of ML-DS leukemic cells.
The first question we asked is why miR-486 is specifically expressed in ML-DS. Our experiments strongly suggest that miR-486 expression is regulated by both GATA1 and GATA1s in a dose-dependent manner. KD of GATA1s reduced miR-486 expression in ML-DS cells, whereas its OE in the erythroid leukemia cells increased miR-486 expression. Erythroid progenitors from Gata1s KI mice also displayed increased expression of miR-486 compared with the same lin cells from wt BM correlating with higher Gata1s mRNA levels. Because we confirmed the previous report3 that the levels of GATA1s expression in ML-DS are 3 to 4 times higher than NDS-AMKL, it seems reasonable to conclude that the higher level of expression of miR-486 in ML-DS is caused by the increased expression of GATA1s.
Yet, in contrast to the observations in human leukemia cells and in primary mouse erythroid cells, the expression of Gata1s in the Gata1 null G1ME cell line resulted in a smaller induction of miR-486-5p expression compared with the Gata1 isoform. These data suggest that the effect of Gata1s on the expression of miR-486 may depend on the specific cellular and developmental context, and on the interaction with other co-factors as recently shown by Chlon et al.38
Both trisomy 21 and GATA1s cooperate in an expansion of human fetal MEPs,51-53 which probably explains why these leukemias are always diagnosed in early childhood.8 We did not detect any significant differences in miR-486 expression in pure megakaryocytic cultures between euploid and trisomy 21 human FLs (supplemental Figure 4), and we could not analyze unmanipulated human FLs due to lack of material. The increased expression of miR-486 in Gata1s KI mice suggests, however, that the trisomy 21 is not required.
miR-486 is encoded within ANK1, a GATA1-regulated gene highly expressed in erythroid precursor cells. ANK1 expression is increased in ML-DS and its expression changed in the same direction with miR-486 in all the experiments reported in this study (data not shown). Yet, this could reflect the changes in the erythroid phenotype and is not direct evidence for co-transcription. The regulation of miR within host genes is complex.44-46 Complicating the matter is that miR-486 may be transcribed from both DNA strands. Hence, further research is required to uncover additional regulatory factors of miR-486 in erythroid cells.
Although cloned from the human FL,54 there is only one report on the involvement of miR-486 in hematopoiesis. Lulli et al recently reported that miR-486-3p regulates fetal hemoglobin by suppression of BCL11A in fetal erythroid cells,55 although it did not affect their growth and survival. We show here that miR-486-5p is not merely a marker of erythroid progenitors, but rather a regulator of the erythroid phenotype of ML-DS leukemic cells. Our results are supported by independent observations of Bhatia et al ,56 in which ectopic miR-486-5p expression enhanced in vitro erythroid differentiation of normal CD34+ cells. Interestingly, miR-486-5p activates AKT (Figure 5A,B), which has been previously shown to be important for erythroid differentiation.57 Additional studies will be needed to clarify the roles of miR-486 in normal erythropoiesis, and possibly, in regulating the decision between megakaryocytic and erythroid differentiation.
We further demonstrate that miR-486-5p cooperates with Gata1s in enhancing colony number and self-renewal of FL hematopoietic progenitors and that it is important for the survival of ML-DS cells. Previous research17,49 demonstrated the dependency of ML-DS on PI3K-AKT signaling. For example, Klusmann et al17 showed that the loss of the amino-terminal domain in the Gata1s isoform relieves repression of E2F1 and induces proliferation of fetal mega-erythroid progenitors. They showed that insulin growth factor 1-PI3K-AKT signaling pathway cooperates with activated E2F1 in these cells and hypothesized that trisomy 21 had a role in the activation of that pathway. We speculate that miR-486-5p provides this “missing link,” as it is a strong activator of AKT in ML-DS. The similar observations in chronic ML by Bhatia et al56 suggest that miR-486-5p may be an important oncogene in several hematopoietic myeloid malignancies characterized by dependency on the PI3K/AKT pathway.
The online version of this article contains a data supplement.
There is an Inside Blood Commentary on this article in this issue.
The publication costs of this article were defrayed in part by page charge payment. Therefore, and solely to indicate this fact, this article is hereby marked “advertisement” in accordance with 18 USC section 1734.
Acknowledgments
The authors thank the Children’s Oncology Group AML Biology Committee for providing patient samples, Ravi Bhatia for miR-486 vectors and for sharing unpublished data, and the technicians and researchers at Rosetta Genomics Ltd for their assistance and contributions. This research is partial fulfillment of the requirements of Omer Schwartzman and Ifat Geron in Tel-Aviv University.
This study was supported by grants from the National Cancer Institute of the National Institutes of Health (U10CA098543 and U10CA180886). The content is solely the responsibility of the authors and does not necessarily represent the official views of the National Institutes of Health. The study was also supported by Children with Cancer UK (S.I.), Samuel Waxman Cancer Research Foundation NY and USA Israel Binational Science Foundation (S.I. and J.D.C.), Israel Science Foundation I-CORE program (S.I. and S.M.), Israel Science Foundation Legacy Heritage program (S.I.), The Shabbetai Donollo Italian-Israeli Fellowship program (E.V.), Kamin program (S.M.), The Israel Cancer Research Foundation and the Daniel Turnberg UK/Middle East Travel Fellowship from the Academy of Medical Sciences (L.G.), The National Cancer Institute (CA120772), Elana Fund, Herrick Foundation, Kids Without Cancer, and the Ring Screw Textron Chair for Pediatric Cancer Research (J.W.T., Y. Ge, and S.I.). Research in the Gottgens laboratory was supported by Leukaemia and Lymphoma Research, the MRC, BBSRC, CRUK, Leukaemia and Lymphoma Society, NIHR Cambridge Biomedical Research Centre, and core infrastructure support by the Wellcome Trust. M.R.T. was supported by a Marie Curie Intra-European Fellowship (237296). S.T.C. was supported by the American Society of Hematology Scholar Award and Alex’s Lemonade Stand Foundation Springboard Grant.
Authorship
Contribution: L.S., E.V., S.M., M.J.W., B.G., J.W.T., B.S., J.D.C., and S.I. designed and supervised the research; L.S., E.V., and S.I. wrote the paper; and L.S., E.V., Y. Ge, Y. Goren, M.R.T., Y.B., M.M., I.G., O.S., L.G., S.T.C., and H.P. performed and analyzed experiments.
Conflict-of-interest disclosure: Y. Goren is an employee of Rosetta Genomics Ltd. The remaining authors declare no competing financial interests.
The current affiliation for L.G. is Genetics Branch, National Cancer Institute, National Institutes of Health, Bethesda, MD, and for M.J.W. is St. Jude Children’s Research Hospital, Department of Hematology, Memphis, TN.
Correspondence: Shai Izraeli, Cancer Research Center, Department of Pediatric Hematology and Oncology, Sheba Medical Center, Tel Hashomer, Ramat-Gan 52621, Israel; e-mail: sizraeli@sheba.health.gov.il; and Jeffrey W. Taub, Department of Pediatrics, Wayne State University School of Medicine, Detroit, MI; e-mail: jtaub@med.wayne.edu.
References
Author notes
L.S. and E.V. contributed equally to this study.

