Abstract
DNA methylation patterns are frequently dysregulated in cancer, although little is known of the mechanisms through which specific gene sets become aberrantly methylated. The ecotropic viral integration site 1 (EVI1) locus encodes a DNA binding zinc-finger transcription factor that is aberrantly expressed in a subset of acute myeloid leukemia (AML) patients with poor outcome. We find that the promoter DNA methylation signature of EVI1 AML blast cells differs from those of normal CD34+ bone marrow cells and other AMLs. This signature contained 294 differentially methylated genes, of which 238 (81%) were coordinately hypermethylated. An unbiased motif analysis revealed an overrepresentation of EVI1 binding sites among these aberrantly hypermethylated loci. EVI1 was capable of binding to these promoters in 2 different EVI1-expressing cell lines, whereas no binding was observed in an EVI1-negative cell line. Furthermore, EVI1 was observed to interact with DNA methyl transferases 3A and 3B. Among the EVI1 AML cases, 2 subgroups were recognized, of which 1 contained AMLs with many more methylated genes, which was associated with significantly higher levels of EVI1 than in the cases of the other subgroup. Our data point to a role for EVI1 in directing aberrant promoter DNA methylation patterning in EVI1 AMLs.
Introduction
Patterning of DNA methylation plays a critical role in epigenetic gene regulation during normal development.1 Aberrant cytosine methylation of gene promoters occurs frequently in many forms of cancer, including acute myeloid leukemias (AMLs).2 Several tumor suppressor genes (eg, CDKN2B and CEBPA) are found to be abnormally methylated and silenced in AML patients.3,4 Moreover, aberrant distribution of promoter DNA methylation occurring in specific and distinct patterns has been shown to be a universal feature occurring in all AML patients.5 However, the mechanisms that mediate these aberrant methyl cytosine patterns have not been defined.
Abnormal expression of the EVI1 (ecotropic viral integration site 1) gene, as the result of inv(3)(q21q26.2)/t(3,3)(q21;q26.2) or through other unknown mechanisms, is associated with unfavorable AML outcome.6,7 EVI1 encodes a C2H2 zinc finger transcription factor, binding DNA in a sequence-specific manner and functions as a repressor.8-10 Retroviral insertion mutagenesis studies suggest that EVI1 deregulation plays a role in leukemogenesis.11 The mechanism through which EVI1 mediates these effects is unknown.
Given the function of EVI1 as a transcriptional repressor, we wondered whether EVI1 might be associated with aberrant epigenetic programming in AML patients. To test this hypothesis, we conducted a large-scale DNA methylation profiling study in human EVI1 AMLs. A specific promoter DNA methylation signature was uncovered in EVI1 AMLs, and evidence was provided that EVI1 contributes to aberrant promoter DNA methylation patterning in those leukemias.
Methods
Patient samples
Diagnostic material from 26 AML patients overexpressing EVI1 (EVI1 AML), determined using EVI1 real-time quantitative polymerase chain reaction (PCR),7 were included based on material availability (supplemental Table 1, available on the Blood Web site; see the Supplemental Materials link at the top of the online article). All patients were enrolled in Dutch-Belgian Hemato-Oncology Cooperative Group trials (available at http://www.hovon.nl), and provided written informed consent in accordance with the Declaration of Helsinki. Institutional Review Board approval was obtained at the Erasmus University Medical Center. Normal CD34+ progenitor cells (CD34+ NBM) were purified from bone marrow specimens from 8 healthy donors, 4 of which were acquired from the Translational Trials Development and Support Laboratory, Cincinnati Children's Hospital, and 4 of which were purchased from Allcells.
Genome-wide DNA methylation by the HELP assay
Blasts and mononuclear cells from AML samples at diagnosis were purified as previously reported.12 The HpaII tiny fragment enrichment by ligation-mediated PCR (HELP) assay was carried out in the EVI1 AML and CD34+ NBM samples as previously published.5 Based on the density of the HpaII/MspI ratios from the 25 626 probe sets in the 26 EVI1 AMLs and 8 CD34+ NBM samples; hypermethylation was defined as a log2 (HpaII/MspI) < 1 and hypomethylation log2 (HpaII/MspI) of a probe set was > 1. The HELP data have been submitted to the National Center for Biotechnology Information Gene Expression Omnibus repository (GSE18700).
DNA methylation data analysis
Unsupervised clustering of the HELP data by hierarchical clustering using Pearson correlation distance with Ward clustering method and principal component analysis was performed using R.2.8.113 and BioConductor14 using the package MADE4.15 Supervised analysis was carried out using a moderated t test with a significance level of P < .05 after correcting for multiple testing using the Benjamini-Hochberg (BH) approach. An absolute difference in methylation > 1.5 between the means of the 2 populations (meanEVI1 log(HpaII/MspI) − meanNBM log(HpaII/MspI)) was required to increase the likelihood of detection of biologically significant changes in methylation levels.
Quantitative DNA methylation analysis by MassARRAY EpiTyping
Technical validation of the HELP data were performed by matrix-assisted laser desorption/ionization time-of-flight mass spectrometry using EpiTyper by MassARRAY (Sequenom) in 13 randomly selected EVI1 AML samples on bisulfite-converted DNA using a panel of 15 genes using MassARRAY primers as previously described.4,5,16,17 The correlation between the MassARRAY results and the HELP methylation data were calculated using the r value of the regression line.
CpG/CG enrichment, gene ontology, and regulatory element analysis
Enrichment of probe sets overlapping with CpG islands or CG clusters18 in the gene signatures versus all probe sets of the HELP assay was calculated using the Fisher exact test using R 2.8.1. Gene ontology analysis was performed using DAVID,19 with the entire HELP microarray as the background reference against which enrichment of level 5 gene ontology categories was determined. Finding informative regulatory elements (FIRE) was used as described20 to detect motifs in promoter regions (ie, sequences up to 2000 bp upstream of the TSS defined by the UCSC browser 200821 ) that were able to distinguish between EVI1 AML versus CD34+ NBM signature genes and a group of 5000 control sequences.
ChIP
Chromatin immunoprecipitation (ChIP) was carried out on 3 AML cell lines, SB1690CB (EVI1 overexpressing),22,23 K562 (intermediate EVI1 expression), and MOLM13 (EVI1 negative). ChIP was carried out according to the manufacturer's protocol (SimpleChIP Enzymatic Chromatin IP Kit, Magnetic Beads; Cell Signaling Technology) using anti-EVI1 (Cell Signaling Technology) or an equal amount of immunoglobulin G (IgG) isotype as negative control (Cell Signaling Technology) or anti-Histone H3 (Cell Signaling Technology) as positive control.
Three independent experiments were carried out and according to manufacturer's protocol. In each experiment, more than 1% of the input from the positive control RPL30 (Histone H3 binding target) was precipitated (mean 2%, SD 0.78%). The amount of immunoprecipitated DNA in each experiment is represented as signal relative to the amount of input and was calculated with the quantitative real-time PCR results using primers directed to promoter regions of FAM83b, IL11RA, MORF4L1, CRHBP, CASP2, and VPREB3 containing, respectively, 7, 8, 5, 5, 4, and 5 bp of the first EVI1-binding domain. The ChIP primer sequences are, respectively, FAM83b: forward 5′-GCCTTTACTCTGCTCTTTCAGC-3′, reverse 5′-GAAGGTGGGTGAGGAATGTG-3′; IL11RA: forward 5′-CCTGGTGTAGACGCCAAAGT-3′, reverse 5′-GTTAGTCACTCCCGGCCTTT-3′; MORF4L1: forward 5′-TGGACAAGCTTGCGAGAAGT-3′, reverse 5′-CAACCCCTTCTCTGACAACAG-3′; CRHBP: forward 5′-TCCAGGTCAAGTGACAGAGC-3′, reverse 5′-GCTTTCTTCCTGCCCCTTAC-3′; CASP2: forward 5′-GCTTTGGTCACCCTGATGAT-3′, reverse 5′-GGCGCTGGAAAATGTTAGTC-3′; and VPREB3: forward 5′-GGGCTCCTATTCTTGGAAGG-3′, reverse 5′-CCACAACAGAGCATGCAAAT-3′.
EVI1 and DNMT coimmunoprecipitation assays
The expression constructs pSVK-HA-DNMT3A and pSVK-HA-DNMT3B were a kind gift from Dr Stephen Baylin (Johns Hopkins University, Baltimore, MD) and were recloned into pcDNA3.1 to generate pcDNA-HA-DNMT3A and pcDNA-HA-DNMT3B. pCMV-empty and pCMV-FLAG-EVI1 have been described before.24 We also generated pcDNA-FLAG-DNMT3A, pcDNA-FLAG-DNMT3B and pCMV-HA-EVI1 to carry out the reciprocal coimmunoprecipitation (Co-IP) experiments. For Co-IP experiments, HEK293T cells were transfected with 8 μg of total DNA using FuGENE6 transfection reagents (Roche). Forty-eight hours after transfection, FLAG-immunoprecipitations on nuclear extracts were performed according to the Nuclear Complex Co-IP kit protocol (Active Motif), and bound proteins were detected by Western blot analysis with anti-Flag (Sigma-Aldrich) or anti-HA (Santa Cruz Biotechnology) antibodies. Co-IPs were carried out in SB1690CB cells with anti-DNMT3A and anti-DNMT3B (Abcam) and anti-EVI1 (Cell Signaling Technology) antibodies.
Results
EVI1 AML blasts display a specific aberrant promoter DNA methylation signature
We compared and contrasted the abundance of cytosine methylation at 14 000 gene promoters using the HELP assay in 26 AML patients overexpressing EVI1 (EVI1 AMLs) and in 8 CD34+ normal bone marrow controls (CD34+ NBM). The accuracy of the HELP assay in detecting variance in DNA methylation was validated by single locus quantitative EpiTyping and the correlation between the 2 assays was r = 0.83 (supplemental Figure 1).
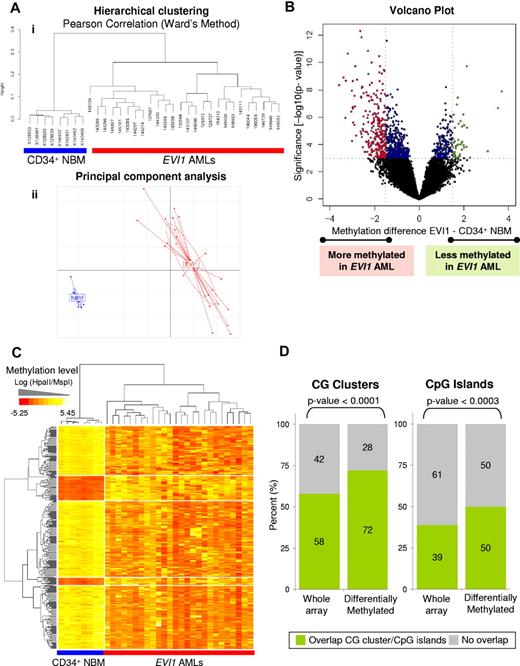
Unsupervised analysis using hierarchical clustering (Figure 1A top panel) and principal component analysis (Figure 1A bottom panel) revealed clear segregation of the 26 EVI1 AMLs from the 8 CD34+ NBM controls. Hierarchical clustering in a previously published cohort of 344 AMLs,5 revealed that the EVI1 AMLs were almost all contained within 2 AML subsets defined solely by their epigenetic signatures, but not having any other common known cytogenetic or molecular abnormality (supplemental Figure 2). Thus, the EVI1 AMLs clustered separately from any of the epigenetic clusters with well-defined cytogenetic or molecular abnormalities, that is, inv(16), t(8;21), t(15;17), CEBPA-mutant AML, CEBPA-silenced leukemias, or NPM1 mutant cases (supplemental Figure 2). EVI1 AML leukemia cells thus present with a DNA hypermethylation signature that differs entirely from that of normal bone marrow progenitors and from those of any of the other genetically well-defined AMLs.
EVI1 acute myeloid leukemia patients (EVI1 AMLs) have a unique genome-wide methylation profile compared with CD34+ normal bone marrow samples (CD34+ NBM). (A) Dendrogram representing a hierarchical clustering (i) and a principal component analysis (ii) in 8 CD34+ NBM blasts and 26 EVI1 AMLs. (B) Volcano plot showing the methylation difference comparing the 26 EVI1 AMLs to 8 CD34+ NBM samples with corresponding moderated t test P values. Probe sets that were significantly hypermethylated (P < .001 and methylation difference less than −1.5) are shown in red; probe sets that were significantly hypomethylated (P < .001 and methylation difference larger than 1.5) are shown in green. Significant probe sets that did not have an absolute methylation difference larger than 1.5 are depicted in blue. (C) Heatmap showing the methylation levels (Log (HpaII/MspI)) of differentially methylated genes (rows) in EVI1 AMLs and CD34+ NBM cases (columns). (D) Bar plots showing the percentages of genes containing (green) CG clusters and CpG islands and those not overlapping (gray) in all genes on the HELP array and in the EVI1 AML differentially methylated genes. A χ2 test P value is shown per panel.
EVI1 acute myeloid leukemia patients (EVI1 AMLs) have a unique genome-wide methylation profile compared with CD34+ normal bone marrow samples (CD34+ NBM). (A) Dendrogram representing a hierarchical clustering (i) and a principal component analysis (ii) in 8 CD34+ NBM blasts and 26 EVI1 AMLs. (B) Volcano plot showing the methylation difference comparing the 26 EVI1 AMLs to 8 CD34+ NBM samples with corresponding moderated t test P values. Probe sets that were significantly hypermethylated (P < .001 and methylation difference less than −1.5) are shown in red; probe sets that were significantly hypomethylated (P < .001 and methylation difference larger than 1.5) are shown in green. Significant probe sets that did not have an absolute methylation difference larger than 1.5 are depicted in blue. (C) Heatmap showing the methylation levels (Log (HpaII/MspI)) of differentially methylated genes (rows) in EVI1 AMLs and CD34+ NBM cases (columns). (D) Bar plots showing the percentages of genes containing (green) CG clusters and CpG islands and those not overlapping (gray) in all genes on the HELP array and in the EVI1 AML differentially methylated genes. A χ2 test P value is shown per panel.
A supervised analysis (moderated t test) was next performed to more precisely define the nature of aberrant epigenetic programming in EVI1 AMLs versus CD34+ NBM controls. A total of 303 differentially methylated probe sets, corresponding to 294 unique genes (Figure 1B) were identified as differentially methylated in EVI1 AMLs with P < .001 (BH corrected P < .05) and methylation log ratio difference > 1.5 (corresponding to a > 25% difference in DNA methylation level). Of the genes, 81% (238/294) were coordinately hypermethylated in EVI1 AML cases, whereas only 19% (56/294) were hypomethylated, compared with CD34+ NBM controls (Figure 1C).
A significantly greater than expected percentage of these probe sets were associated with CpG islands (P < .0001) and CG clusters (P < .0003) compared with the distribution of all probe sets on the HELP array (Figure 1D). Of note, 28% and 50% of the differentially methylated genes did not contain CG clusters or CpG islands, respectively, suggesting that DNA methylation beyond these areas may remain important as well.25
Unique biological and molecular features of genes methylated in EVI1 AMLs
From a functional standpoint, the EVI1 DNA methylation signature was enriched in genes associated with transcription regulation and RNA biosynthetic process (supplemental Table 3). Three of the aberrantly methylated genes in the EVI1 signature (ie, TOPORS,26 PCDH16,27 and CTCFL28,29 ) have been reported to function as tumor suppressors. Thus, EVI1 AML associates with a unique set of functionally related and coordinately hypermethylated genes.
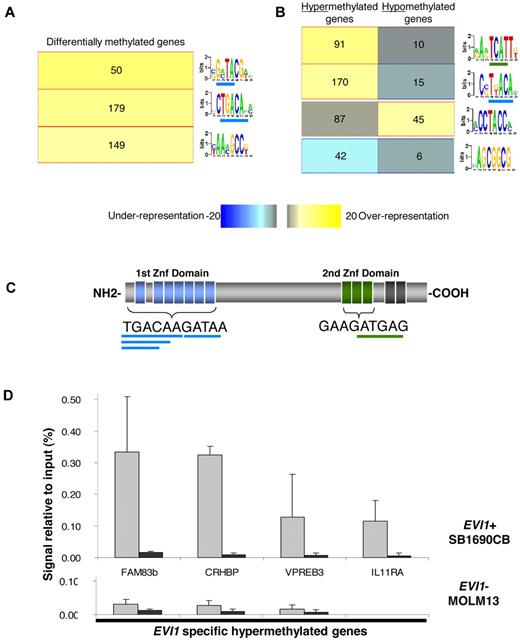
To better understand the mechanisms that might contribute to aberrant methylation in EVI1 AMLs, we used an unbiased motif analysis algorithm (FIRE20 ) to examine the promoter regions in the signature for DNA sequences of potential functional significance. This approach yielded 3 motifs significantly overrepresented (P < .05 after Bonferroni correction) in the 294 differentially methylated genes in EVI1 AML compared with a set of 5000 randomly selected nondifferentially methylated promoters (Figure 2A, supplemental Table 4). Two of the 3 overrepresented motifs in the EVI1 AML methylation signature contained sequences, that overlap with the TGACAAGATAA consensus sequence, that is bound by the first zinc finger domain of EVI1 (Figure 2A,C). A subsequent FIRE motif analysis, focusing separately on the 238 hypermethylated and 56 hypomethylated genes, revealed 2 motifs that were highly enriched among the hypermethylated genes and each of these contained respectively, 5 bp and 4 bp of the first and second EVI1 zinc finger domain binding sequence (Figure 2B, supplemental Table 4).
EVI1 binding sites are overrepresented in the hypermethylated promoter regions of EVI1 AMLs and EVI1 binds these hypermethylated promoters in vivo. (A) Motif analysis of the in EVI1 AML differentially methylated genes showed a significant overrepresentation (yellow in the heatmap color key) of three 7-bp motifs. Per bar, each 7-bp optimized motif is shown. The underlined sequences overlap with the first or second EVI1-binding domain. The number of genes that harbored the representative motifs in their promoter sequences is depicted per bar. (B) Further analysis of the hypermethylated and hypomethylated genes reveals 2 overrepresented motifs in the promoter regions of the hypermethylated genes and 1 overrepresented in hypomethylated genes. (C) Schematic representation of the EVI1 nuclear zinc-finger protein, with the binding sequence of the first and second EVI1 zinc finger domains. The overlapping motifs overrepresented in hypermethylated genes are underlined in, respectively, blue and green. (D) Quantitative PCR of ChIP in the EVI1-positive (EVI1+) SB1960CB cell line and the EVI1-negative (EVI1-) MOLM13 cell line using EVI1 and IgG antibody. Percentage of amount of input material is shown. The mean and SD of 3 independent experiments is shown.
EVI1 binding sites are overrepresented in the hypermethylated promoter regions of EVI1 AMLs and EVI1 binds these hypermethylated promoters in vivo. (A) Motif analysis of the in EVI1 AML differentially methylated genes showed a significant overrepresentation (yellow in the heatmap color key) of three 7-bp motifs. Per bar, each 7-bp optimized motif is shown. The underlined sequences overlap with the first or second EVI1-binding domain. The number of genes that harbored the representative motifs in their promoter sequences is depicted per bar. (B) Further analysis of the hypermethylated and hypomethylated genes reveals 2 overrepresented motifs in the promoter regions of the hypermethylated genes and 1 overrepresented in hypomethylated genes. (C) Schematic representation of the EVI1 nuclear zinc-finger protein, with the binding sequence of the first and second EVI1 zinc finger domains. The overlapping motifs overrepresented in hypermethylated genes are underlined in, respectively, blue and green. (D) Quantitative PCR of ChIP in the EVI1-positive (EVI1+) SB1960CB cell line and the EVI1-negative (EVI1-) MOLM13 cell line using EVI1 and IgG antibody. Percentage of amount of input material is shown. The mean and SD of 3 independent experiments is shown.
A role for EVI1 in promoter hypermethylation in EVI1 AML
To determine whether the presence of putative EVI1-binding sites indicated that these were EVI1 target genes, we first performed HELP analysis on the human AML SB1690CB cell line, carrying a chromosomal 3q26 aberration and overexpressing EVI123 . A highly significant concordance of hypermethylated genes (89%) was found between the SB1690CB cell line and the hypermethylated genes identified in the EVI1 AML patient samples (211/238 genes; supplemental Table 5). Second, we performed ChIP assays on 6 randomly chosen hypermethylated genes, containing the above mentioned EVI1-binding sequences. Compared with control antisera, EVI1 antibodies enriched all 6 genes, indicating that EVI1 was indeed bound to these genes (Figure 2D, supplemental Figure 3A). Similarly, in another cell line expressing EVI1 (K562), ChIP revealed EVI1 binding to the 4 loci studied (supplemental Figure 3B). In contrast, these promoters could not be immunoprecipitated in the EVI1-negative myeloid MOLM13 leukemia cell line (Figure 2D, supplemental Figure 3).
EVI1 interacts with DNMT3A and 3B
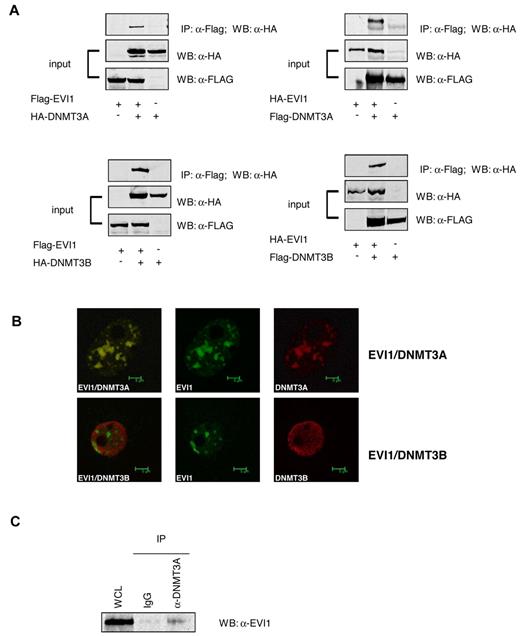
The results implicate EVI1 in promoter methylation. Therefore, we examined whether EVI1 could interact with DNMTs. Coimmunoprecipitation experiments were carried out using HA-tagged DNMT3A or DNMT3B and FLAG-tagged EVI1 overexpressed into 293T cells. HA-DNMT3A and DNMT3B interacted with FLAG-EVI1 (Figure 3A). Similarly, FLAG-DNMT3A and FLAG-DNMT3B coprecipitated with HA-EVI1 in the reverse experiment (Figure 3A). EVI1 is frequently found to be present in nuclear speckles. Confocal microscopy revealed that FLAG-tagged EVI1 colocalized with HA-tagged DNMT3A within the nuclei of transfected 293T cells. Colocalization between of FLAG-tagged EVI1and HA-tagged DNMT3B was not evident (Figure 3B). Most importantly, in SB1690CB cells, endogenously expressed EVI1 protein coimmunoprecipitated with DNMT3A (Figure 3C). EVI1 also coprecipitated with endogenous DNMT3B, but this interaction appeared very weak (data not shown). It is as yet unclear whether the low EVI1 levels in this Co-IP were due to weak interaction or the quality of the antibodies for this particular experiment. Moreover, DNMT3A was found to be highly expressed in primary EVI1 AMLs compared with other AML patients (supplemental Figure 4).
EVI1 interacts with DNMT3A and DNMT3B. (A) Western blot analysis using anti-FLAG antibodies shows the input of the immunoprecipitation of transfected 293T cells and the pulldown using anti-HA. (B) Confocal microscopy of 293T cells transfected with HA-tagged EVI1 (green) and FLAG-tagged DNMT3A and DNMT3B (red). (C) Western blot for EVI1 on lysates from SB1960CB cell line. The left lane shows the input band; the second and third lanes show EVI1 staining after immunoprecipitation with IgG control and anti-DNMT3A, respectively.
EVI1 interacts with DNMT3A and DNMT3B. (A) Western blot analysis using anti-FLAG antibodies shows the input of the immunoprecipitation of transfected 293T cells and the pulldown using anti-HA. (B) Confocal microscopy of 293T cells transfected with HA-tagged EVI1 (green) and FLAG-tagged DNMT3A and DNMT3B (red). (C) Western blot for EVI1 on lysates from SB1960CB cell line. The left lane shows the input band; the second and third lanes show EVI1 staining after immunoprecipitation with IgG control and anti-DNMT3A, respectively.
Levels of EVI1 correlated with levels of methylation in EVI1 AMLs
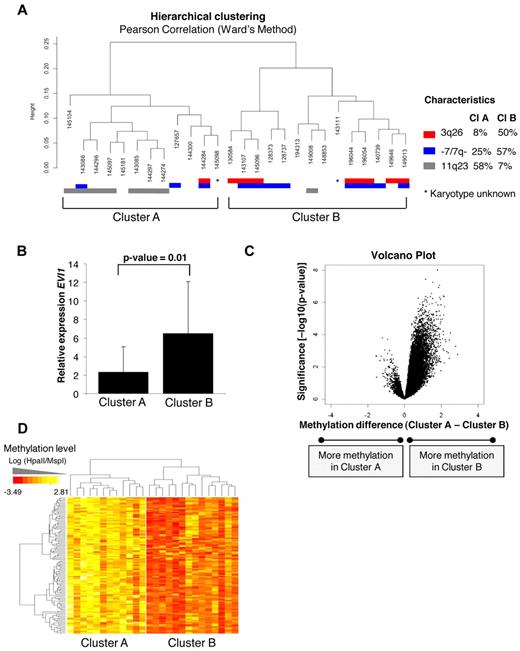
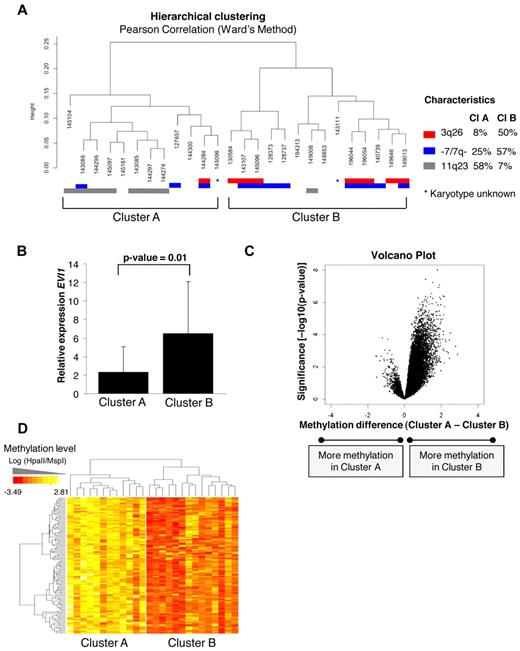
Detailed analysis of the hierarchical clustering (Figure 1A,C) revealed that the 26 EVI1 AML cases could be divided into 2 distinct subclusters (A and B), each with identifiable methylation profiles (Figure 4A). The robustness of both subclusters was determined by 10 000 bootstrap resampling. The P values (arbitrary unit: AU values) were more significant (< 95%) for subcluster B than subcluster A, indicating that methylation profiles in subcluster B are more homogeneous (supplemental Figure 5). Strikingly, subcluster A contained 7/8 EVI1 AMLs that carried 11q23 rearrangements (Fisher exact test, P = .009). Most EVI1 AMLs that carried a 3q26 abnormality (7/8) were contained within subcluster B (Fisher exact test P = .03). This cluster was also enriched for cases with monosomy 7 or deletion 7q (−/7q−) lesions (8/11), which are frequently associated with 3q26 abnormalities (Figure 4A).
Unsupervised analysis identified 2 epigenetically distinct EVI1 AML subgroups correlating with EVI1 relative expression. (A) Unsupervised hierarchical clustering with the Pearson correlation using Ward's method revealed 2 EVI1 subclusters (ie, A and B). The cytogenetic characteristics are shown per patient; chromosome 3q26 abnormalities (red), monosomy 7 or deletion 7q (−7/7q−; blue), and 11q23 rearrangements (gray). The percentages of each characteristic are shown per cluster. (B) Median EVI1 relative expression levels and 2SD are shown per subcluster. P values were calculated using a moderated t test. (C) The volcano plot shows the methylation difference of all probe sets (n = 25 626; x-axis) comparing the methylation levels of cases in subcluster A with the cases in subcluster B with corresponding P value (−log10P value–moderated t test) on the y-axis. (D) The heatmap shows the 122 probe sets (110 unique genes) differentially methylated in subcluster B, when both cluster were compared with each other using a moderated t test (P < .001 and absolute methylation difference > 1.5). All genes are hypermethylated in EVI1 AMLs from subcluster B.
Unsupervised analysis identified 2 epigenetically distinct EVI1 AML subgroups correlating with EVI1 relative expression. (A) Unsupervised hierarchical clustering with the Pearson correlation using Ward's method revealed 2 EVI1 subclusters (ie, A and B). The cytogenetic characteristics are shown per patient; chromosome 3q26 abnormalities (red), monosomy 7 or deletion 7q (−7/7q−; blue), and 11q23 rearrangements (gray). The percentages of each characteristic are shown per cluster. (B) Median EVI1 relative expression levels and 2SD are shown per subcluster. P values were calculated using a moderated t test. (C) The volcano plot shows the methylation difference of all probe sets (n = 25 626; x-axis) comparing the methylation levels of cases in subcluster A with the cases in subcluster B with corresponding P value (−log10P value–moderated t test) on the y-axis. (D) The heatmap shows the 122 probe sets (110 unique genes) differentially methylated in subcluster B, when both cluster were compared with each other using a moderated t test (P < .001 and absolute methylation difference > 1.5). All genes are hypermethylated in EVI1 AMLs from subcluster B.
Of note, EVI1 was expressed at higher levels in subcluster B than in subcluster A (moderated t test, P = .01, Figure 4B). Supervised analysis revealed 122 significantly differentially methylated genes between those 2 groups (moderated t test, P < .001, BH corrected P < .05, and absolute methylation difference > 1.5). Of those 122 genes, 117 (96%) were exclusively hypermethylated in the subcluster B (Figure 4C-D). The 122 differentially methylated genes are listed in supplemental Table 5.
In summary, these data demonstrate that, although EVI1 AMLs share a methylation profile that discriminates them from normal marrow blasts, among EVI1 AML, 2 subgroups can be identified, which shows a positive correlation between EVI1 transcript levels and methylation levels. Subcluster B cases frequently carry 3q26 lesions and monosomy 7,30 which may be a critical determinant in the increased number of methylated genes in those AMLs.
Discussion
AML patient samples can be classified based on unique DNA methylation signatures,5 but the mechanisms that direct coordinated methylation in the different genetically well-defined AML subsets are unknown. Recruitment of DNMTs to target promoters and subsequent promoter hypermethylation has been proposed as being mediated by the oncogenic transcription factor PML-RARA31 in acute promyelocytic leukemia and AML1-ETO32 in favorable risk AML using cell-line models. However, EVI1 is to our knowledge the first example of a transcription factor that may direct a unique recurrent DNA methylation signature in human disease.
EVI1 AMLs express a methylation signature that discriminates them from normal marrow CD34+ blasts and from other AMLs. Within this differential signature ∼ 80% of the genes were hypermethylated, and ∼ 20% were hypomethylated in the EVI1 AMLs compared with CD34+ NBM controls. Moreover, an even stronger hypermethylation signature was observed in the subcluster with the highest EVI1 expression (Figure 4). EVI1-binding sites were overrepresented in hypermethylated promoters in EVI1 AMLs. These hypermethylated genes are apparently bona fide target genes, because EVI1 was shown to bind to these promoters. EVI1 could form a complex with DNMT3A with DNMT3B. Together, these results suggest a role for EVI1 in directing de novo DNA hypermethylation in human AMLs that overexpress this transforming nuclear protein.
Knockdown of EVI1 in AML models would be an attractive approach to study whether genes might become demethylated in the absence of EVI1. However, we observed that knockdown of EVI1 resulted in an almost complete cell-cycle arrest of SB1690CB and K562, whereas no growth inhibition was observed in the EVI1 negative myeloid cell line MOLM13 (data not shown). This observation may be of importance for future therapy of this AML type, but it does not provide the convenient experimental condition to answer our question. It is likely that cell cycling is required to gradually lose methylation. Indeed, the EVI1 methylation profile was not affected after knockdown (data not shown). Because EVI1 expression in AML appears so tightly regulated by regulatory loci on chromosome 3q21 in case of inv(3)(q21q26.2)/t(3,3)(q21;q26.2) or by MLL-fusion genes as the result of a chromosome 11q23 aberration, proper animal models should be generated to study mechanisms of methylation by EVI1 in a reliable manner.
We previously reported on another AML subtype, in which the majority of loci were predominantly methylated in the AMLs and not in the CD34+ NBMs, ie the subtype of CEBPA-silenced leukemias.4 One might argue that this is not surprising as aberrant promoter hypermethylation is a general event found in many tumors. However, this is not a priori true for AML. CEBPA-mutant AMLs carry more hypomethylated loci, compared with CEBPA-silenced leukemias or to CD34+ normal samples.4,5 Moreover, CEBPA-silenced leukemias show a very strong methylation signature that is completely different from that of EVI1 AMLs. In the unsupervised clustering analysis the CEBPA-silenced cases are grouping together notably separate from the EVI1 AMLs (supplemental Figure 2). Thus, in EVI1 AMLs a unique set of genes is methylated, again pointing to a specific role for EVI1 in these AMLs.
We show that EVI1, which has been reported to also interact with histone deacetylases33 (HDACs) as well as with C-terminal– binding proteins,34 histone methyl transferases,35 and MBD3/NuRD complex,24 is also capable of binding DNMT3A and 3B. These findings, together with the observation that EVI1 is capable to bind DNA in a sequence-specific manner and that EVI1-binding motifs are highly enriched in hypermethylated loci, support the hypothesis that EVI1 integrates functions in chromatin remodeling complexes and DNA methylation to mediate transcriptional repression.
Treatment with both DNMT and HDAC inhibitors has been shown to reverse aberrant epigenetic silencing and induce cell death in various cancer types.31,36 The combination of DNMT and HDAC inhibitors has been proposed for therapeutic purposes, although it is currently not possible to identify a priori patients likely to respond to this treatment.37 EVI1 appears to mediate its gene silencing effects both through recruitment of HDAC complexes and DNMT3A/3B, which suggests that combination therapy with DNMT and HDAC inhibitors could be active in these AML cases.
An Inside Blood analysis of this article appears at the front of this issue.
The online version of this article contains a data supplement.
The publication costs of this article were defrayed in part by page charge payment. Therefore, and solely to indicate this fact, this article is hereby marked “advertisement” in accordance with 18 USC section 1734.
Acknowledgments
We thank the colleagues of the Hematology department for samples storage and Egied Simons for the graphical assistance. From the Biostatistic department of Cornell Medical College (New York City), we thank Stephano Monni.
This work was supported by Leukemia & Lymphoma Society Translational Research Program grant no. 6196-09 (A.M. and R.D.); National Institutes of Health grants R8301-HD044078 and GM007288 (J.G.), Dutch Cancer Society grant EMCR 2006-522 (R.D., P.J.M.V., and B.L.), an MRace grant (R.D.), a European Hematology Association research fellowship (S.L.), a ZonMW fellowship (S.L.), a Koningin Wilhelmina Fonds travel grant (S.L.), an American Society of Hematology Fellow Scholar Award (M.E.F.), American Institute for Cancer Research Grant 8305-8297 (E.B.), and Leukemia & Lymphoma Society grant 6196-8309 (E.B.).
National Institutes of Health
Authorship
Contribution: A.M. and R.D. designed the study; S.L., M.E.F., E.B., L.S., P.J.M.V., J.G., B.L., A.M., and R.D. analyzed data; S.L., M.E.F., A.M., and R.D., wrote the paper; S.L., E.B., Y.L., and C.E.-V. performed laboratory experiments; S.L., M.E.F., and L.S. performed in silico experiments; and S.M. provided cells essential for the study.
Conflict of interest disclosure: The authors declare no competing financial interests.
Correspondence: Ruud Delwel, Erasmus University Medical Center, Department Hematology, Dr Molewaterplein 50, 3015 GE Rotterdam, The Netherlands; e-mail: h.delwel@erasmusmc.nl; or Ari Melnick, Weill Cornell Medical College, Hematology/Oncology Section, 1300 York Ave, New York, NY 10065; e-mail: amm2014@med.cornell.edu.

