Inhibition of glutamine metabolism with CB-839 normalizes hematologic and metabolic alterations in MPN.
Inhibition by CB-839 preferentially targets JAK2-V617F expressing hematopoietic stem cells.
Visual Abstract
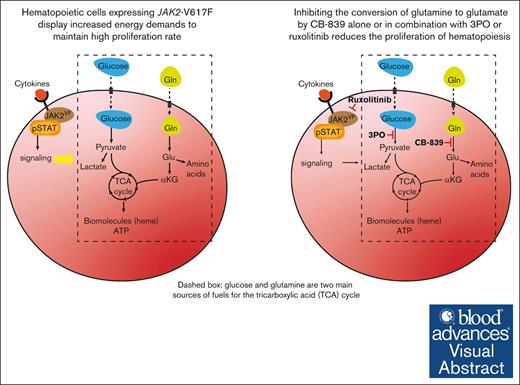
Hyperproliferation of myeloid and erythroid cells in myeloproliferative neoplasms (MPN) driven by the JAK2-V617F mutation is associated with altered metabolism. Given the central role of glutamine in anabolic and catabolic pathways, we examined the effects of pharmacologically inhibiting glutaminolysis, that is, the conversion of glutamine (Gln) to glutamate (Glu), using CB-839, a small molecular inhibitor of the enzyme glutaminase (GLS). We show that CB-839 strongly reduced the mitochondrial respiration rate of bone marrow cells from JAK2-V617F mutant (VF) mice, demonstrating a marked dependence of these cells on Gln-derived ATP production. Consistently, in vivo treatment with CB-839 normalized blood glucose levels, reduced splenomegaly and decreased erythrocytosis in VF mice. These effects were more pronounced when CB-839 was combined with the JAK1/2 inhibitor ruxolitinib or the glycolysis inhibitor 3PO, indicating possible synergies when cotargeting different metabolic and oncogenic pathways. Furthermore, we show that the inhibition of glutaminolysis with CB-839 preferentially lowered the proportion of JAK2-mutant hematopoietic stem cells (HSCs). The total number of HSCs was decreased by CB-839, primarily by reducing HSCs in the G1 phase of the cell cycle. CB-839 in combination with ruxolitinib also strongly reduced myelofibrosis at later stages of MPN. In line with the effects shown in mice, proliferation of CD34+ hematopoietic stem and progenitor cells from polycythemia vera patients was inhibited by CB-839 at nanomolar concentrations. These data suggest that inhibiting GLS alone or in combination with inhibitors of glycolysis or JAK2 inhibitors represents an attractive new therapeutic approach to MPN.
Introduction
Myeloproliferative neoplasms (MPNs) are a group of hematopoietic stem cell (HSC) disorders in which a gain-of-function mutation in JAK2, CALR, or MPL hyperactivates the JAK-STAT signaling pathway, leading to an excess production of erythroid, megakaryocytic, and myeloid cells.1-9 The pathways involved in cellular metabolism are often reprogrammed in cancer cells in order to meet the increased demands for macromolecules biosynthesis.10-13 We have previously shown that JAK2-mutant mice display strongly increased glucose consumption due to an increase in glycolysis and oxidative phosphorylation that was mainly linked to hyperactive erythropoiesis, which resulted in hypoglycemia.14 The metabolic alterations and the MPN disease phenotype were in part normalized by the glycolysis inhibitor 3PO, which has been reported to inhibit the enzyme 6-phosphofructo-2-kinase/fructose-2,6-bisphosphatase.15
Cancer cells also display increased glutamine (Gln) consumption, a phenomenon first described in the 1950s and 1960s,16-18 and extensively investigated since then.12,19 Gln is first converted into glutamate (Glu), which serves as a precursor for the synthesis of nonessential amino acids and glutathione, a key antioxidant that protects cancer cells from proliferation-induced oxidative stress.20 Glu can also be incorporated into the tricarboxylic acid (TCA) cycle via α-ketoglutarate (αKG), thereby generating ATP and replenishing TCA cycle intermediates that are necessary for many anabolic processes. Given its importance, inhibiting Gln metabolism has been attempted in solid tumors.21 Specifically, 1 promising approach has been to block the first step of the pathway, that is, the conversion of Gln into Glu, by inhibiting the enzyme glutaminase (GLS). There are 2 types of GLS enzymes, the kidney-type GLS and the liver-type GLS2. The kidney-type GLS is predominantly expressed in proliferative cells, including cancer cells, whereas GLS2 is abundant in liver and in quiescent cells.22,23 CB-839 has shown beneficial effects in triple-negative breast cancer cell lines24 and has been tested in phase 1/2 clinical trials in patients with renal cell carcinoma.25-27
Here, we expanded the studies on altered metabolism in MPN and examined the effects of inhibiting the conversion of Gln to Glu by CB-839 alone or in combination with 3PO or the JAK1/2 inhibitor ruxolitinib in a JAK2-V617F mouse model of MPN.
Methods
Mice
We crossed conditional JAK2-V617F transgenic mice,28SclCreER mice,29 and UBC-green fluorescent protein (GFP) transgenic mice,30 to obtain triple transgenic mice. The JAK2-V617F transgene was induced by intraperitoneal (IP) injection of 2 mg of tamoxifen (Sigma Aldrich) for 5 consecutive days. All mice were of pure C57BL/6N background and kept under specific pathogen-free conditions with free access to food and water in accordance to Swiss federal regulations. All animal experiments were approved by the Cantonal Veterinary Office of Basel-Stadt, Switzerland.
Bone marrow (BM) transplantations
For BM transplantations, recipient C57BL/6 mice of 8 to 10 weeks of age were purchased from Janvier labs. These mice were gamma-ray irradiated with Gammacell 40 Exactor (Theratronics), with 2 doses of 6 Gy each, the first one the day before the transplantation and the second one 4 hours before the transplantation. Donor BM cells were isolated by crushing femurs, tibias, and ilia of donor mice, followed by 15-minute red blood cell lysis with ammonium-chloride-potassium (ACK) lysis buffer (Gibco). Cells from WT and transgenic VF donors were mixed at the indicated ratio and resuspended in cold phosphate-buffered saline (PBS) (Sigma Aldrich) at a concentration of 107 cells per mL. The suspension (0.2 mL) was immediately injected by IV into the tail vein of each recipient mouse. All transplanted mice were treated with sulfamethoxazole and trimethoprim (Bactrim) in drinking water to prevent irradiation-derived infections.
In vivo drug treatment
CB-839 (Medchemexpress) was dissolved in dimethyl sulfoxide (DMSO) and mixed with sunflower oil (Sigma Aldrich) to a final concentration of 20 mg/mL. Mice were treated with this solution by oral gavage twice daily (200 mg/kg twice daily). 3PO (Medchemexpress) was dissolved in DMSO and mixed with prewarmed saline to a concentration of 5 mg/mL, and injected IP once daily (50 mg/kg daily). Drug solutions were freshly prepared every time.
Complete blood counts
Blood samples were drawn from the tail vein and collected in EDTA-coated tube (Sarstedt). 80 μL of blood were diluted in 240 μL of saline + EDTA before being analyzed on ADVIA 2120i (Siemens).
Flow cytometry
Both femurs, tibias, and ilia were isolated from each mouse and crushed in PBS + fetal bovine serum (3%). BM cells were incubated with the corresponding antibodies. For the analysis of BM and spleen hematopoietic stem and progenitor cells (HSPCs), we used the following conjugated antibodies: CD4-bio, CD8-bio, Ter119-bio, CD11b-bio, Gr1-bio, B220-bio, c-kit-BV711, Sca1-APC-Cy7, CD48-AF700, CD150-PE-Cy7, CD41-BV605, CD16-PE, CD105-PerCP-Cy5.5, and CD34-APC, all from Biolegend. For erythroid maturation analysis and peripheral blood chimerism we used Ter119-APC, CD71-PE, CD61-PE, Gr1-Pe-Cy7, CD11b-APC, B220-APC-Cy7, and CD3-PE, also from Biolegend. When biotin-labeled antibodies were used, a secondary staining with streptavidin-PacificBlue was performed. The cells were then resuspended in PBS + 3% fetal bovine serum + Sytox Blue (1:2000) and analyzed on Fortessa (BD Biosciences) or Cytek Aurora (Cytek). Data analysis was done using FlowJo software (v 10.7.1) and plotted in Prism (v 9.0.0).
For intracellular flow cytometry to identify cell cycle status of HSCs, isolated BM cells were incubated with CD4-bio, CD8-bio, Ter119-bio, CD11b-bio, Gr1-bio, B220-bio, c-kit-BV711, Sca1-APC-Cy7, CD48-AF700, and CD150-APC, followed by a secondary incubation with streptavidin-PeCy7. Cells were then fixed with Fix buffer I and permeabilized with Perm buffer III (BD Biosciences), following the manufacturer’s manual. Incubation with Ki67-PE antibody (BioLegend) and DAPI was performed before analysis on Fortessa (BD Biosciences).
Glucose and glutamine measurement
A drop of blood was taken by tail tip and analyzed using Freestyle Lite glucose monitor (Abbott). For glucose tolerance tests, mice were fasted for 8 hours before glucose IP injections (2 g/kg). Gln quantification from serum from treated mice was performed by the ETHZ proteomics center using MassTrak (Waters Inc).
Seahorse assay
Seahorse assays (Agilent) were performed according to the manual. 2 × 10⁵ mouse BM cells were seeded on Seahorse 96-well plates previously coated with Cell-Tak (Corning). Three injections of glucose, oligomycin, and 2-deoxy-d-glucose (2-DG) for glycolysis assays or oligomycin, carbonyl cyanide 4-(trifluoromethoxy)phenylhydrazone (FCCP), and Antimycin A for mito stress assays (all from Sigma Aldrich) were applied at the recommended concentrations on a Seahorse XF96 instrument (Agilent). Extracellular acidification rate (ECAR) and oxygen consumption rate (OCR) data were collected and analyzed on Prism. For Seahorse experiments using colony forming unit-erythroid (CFU-E), lin− ckit+ Sca1− CD16− CD41-CD150− CD105+ cells were sorted with FACSAria III into Seahorse 96-well plates (5 × 10⁴ cells per well). ECAR and OCR data were normalized to 2 × 10⁵ cells to be comparable with experiments using unfractionated BM.
Histology
Sternum were fixed in paraformaldehyde, embedded in paraffin and tissue sections were stained with H&E, or Gömöri. The grading of myelofibrosis was performed by an experienced hemato-pathologist who had no information about the treatment modalities.
Patients and samples
Collection of BM samples and clinical data of MPN patients at the University Hospital Basel, Switzerland, was approved by the local ethics committee (Ethik Kommission Beider Basel) and written informed consent was obtained from all patients in accordance with the Declaration of Helsinki. The diagnosis of MPN was established according to the revised criteria of the World Health Organization.31 BM samples from 3 polycythemia vera (PV) patients with JAK2-V617F mutation (P490, P497, and P559) were taken at diagnosis. The JAK2-V617F variant allele fraction in granulocyte DNA was 38%, 80%, and 51%, respectively. No additional gene mutations were found for P490 and P497 using targeted next generation sequencing with a panel of 104 genes.32 P559 was not analyzed by next generation sequencing. Leukodepletion filters from multiple blood donors were obtained from the Établissement Français du Sang-Grand Est and were used to isolate peripheral blood CD34+ cells, as previously described.33
In vitro culture assays
BM cells from PV patients (n = 3) or cells recovered from leukodepletion filters of healthy blood donors (n = 32) were stained with a cocktail of lineage-FITC and CD34-PacificBlue antibodies (BioLegend) and 50 lin−; CD34+ cells were sorted with FACSAria III (BD) into 96-well plates containing 100 μL of StemSpan SFEM media with erythroid expansion supplement (StemCell technologies). Vehicle (DMSO) or CB-839 was added at the indicated concentration after 3 days of culture and cell numbers were determined after 2 weeks of culture with precision count beads (BioLegend).
RNA sequencing analysis
Single cell capture and complementary DNA and library preparation were performed at the Genomics Facility of the ETH Zurich, Basel with a Single Cell 3’ v3 Reagent Kit (10X Genomics) according to the manufacturer’s instructions. Sequencing was performed on Illumina Novaseq 6000 platform to produce paired-end 101nt R2 reads.
The data set was analyzed by the Bioinformatics Core Facility, Department of Biomedicine, University of Basel. An initial clustering of cells was performed with a shared nearest-neighbor’s approach and Louvain algorithm for community detection, using the function clusterSweep(da) from the bluster package (version 1.6.0) with a parameter k = 5. Differential expression between JAK2 induced and WT conditions, stratified by cluster, was performed using a pseudobulk approach.34 The package edgeR (version 3.38.4)35 was used to perform trimmed mean of m-value normalization36 and to test for differential expression with the quasi-likelihood framework (glmQLFit). Genes with a false discovery rate lower than 5% were considered differentially expressed.
Results
Inhibiting GLS decreased oxidative phosphorylation rates observed in BM cells from JAK2-mutant mice.
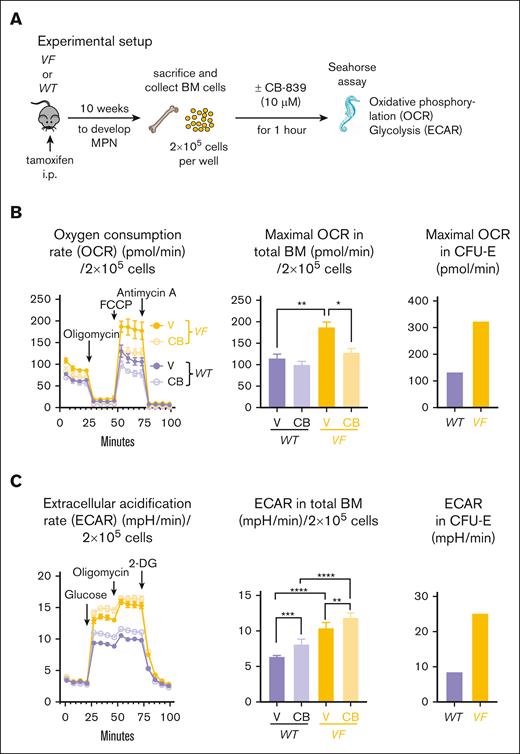
Conditional SclCreER;JAK2-V617F transgenic mice (VF) received tamoxifen injections to induce the expression of the transgene. After 10 weeks, when the VF mice had developed MPN phenotype, they were sacrificed and their unfractionated BM cells were analyzed in vitro (Figure 1A). BM cells were placed in media containing Gln and glucose in the presence of the GLS inhibitor CB-839 or DMSO, and the rate of mitochondrial oxidative phosphorylation and glycolysis was determined by Seahorse assays. At baseline, total BM cells from VF mice displayed 45% higher maximal OCR compared to WT mice. A similar increase was also noted in purified CFU-E cells (Figure 1B). The addition of CB-839 reduced maximal OCR in BM cells by 37%, but the number of CFU-E cells obtained from 3 mice was too low to also test the effects of CB-839 in these cells. Glycolysis, determined by the ECAR, was also elevated in total BM cells from VF mice compared to WT mice, and a similar increase was also noted in CFU-E cells (Figure 1C). CB-839 increased ECAR in BM from VF and WT mice by 14% and 27%, respectively. These results demonstrate that inhibiting Gln-dependent ATP production in BM cells from JAK2-mutant mice severely affected the overall respiratory capacity of these cells, leading to a compensatory increase in glycolysis, and suggest that by preventing Gln incorporation into the TCA cycle, CB-839 could also impair the proliferation of MPN cells.
Effects of the GLS inhibitor CB-839 on BM cells in vitro. (A) Experimental scheme. Seahorse metabolic flux assay was performed with BM cells from WT mice (n = 6) or VF mice (n = 6). The cells were treated with DMSO or CB-839 (10 μM) 1 hour before the Seahorse assay. (B) Analysis of changes in OCRs upon administration of oligomycin, FCCP, and Antimycin A (left); maximal OCR values (middle) and maximal OCR displayed by sorted CFU-E (lin− ckit+ Sca1− CD41− CD16− CD150− CD105+) (right). (C) Analysis of changes in ECAR (mpH/min), indicative of glycolysis, upon administration of glucose, oligomycin, and 2-DG (left); maximal glycolysis rate (middle) and maximal glycolysis rate from sorted CFU-E cells (right), gated as described in panel B. The plots represent the mean ± standard error of the mean (SEM) from 6 mice per group from 1 experiment (for CFU-E panel, n = 1). 2-way analysis of variance (ANOVA) followed by Dunnett’s multiple comparison was performed. ∗P < .05, ∗∗P < .01, ∗∗∗P < .001, and ∗∗∗∗P < .0001. FCCP, carbonyl cyanide 4-(trifluoromethoxy)phenylhydrazone.
Effects of the GLS inhibitor CB-839 on BM cells in vitro. (A) Experimental scheme. Seahorse metabolic flux assay was performed with BM cells from WT mice (n = 6) or VF mice (n = 6). The cells were treated with DMSO or CB-839 (10 μM) 1 hour before the Seahorse assay. (B) Analysis of changes in OCRs upon administration of oligomycin, FCCP, and Antimycin A (left); maximal OCR values (middle) and maximal OCR displayed by sorted CFU-E (lin− ckit+ Sca1− CD41− CD16− CD150− CD105+) (right). (C) Analysis of changes in ECAR (mpH/min), indicative of glycolysis, upon administration of glucose, oligomycin, and 2-DG (left); maximal glycolysis rate (middle) and maximal glycolysis rate from sorted CFU-E cells (right), gated as described in panel B. The plots represent the mean ± standard error of the mean (SEM) from 6 mice per group from 1 experiment (for CFU-E panel, n = 1). 2-way analysis of variance (ANOVA) followed by Dunnett’s multiple comparison was performed. ∗P < .05, ∗∗P < .01, ∗∗∗P < .001, and ∗∗∗∗P < .0001. FCCP, carbonyl cyanide 4-(trifluoromethoxy)phenylhydrazone.
CB-839 normalized blood counts and had additive effects in combination with ruxolitinib
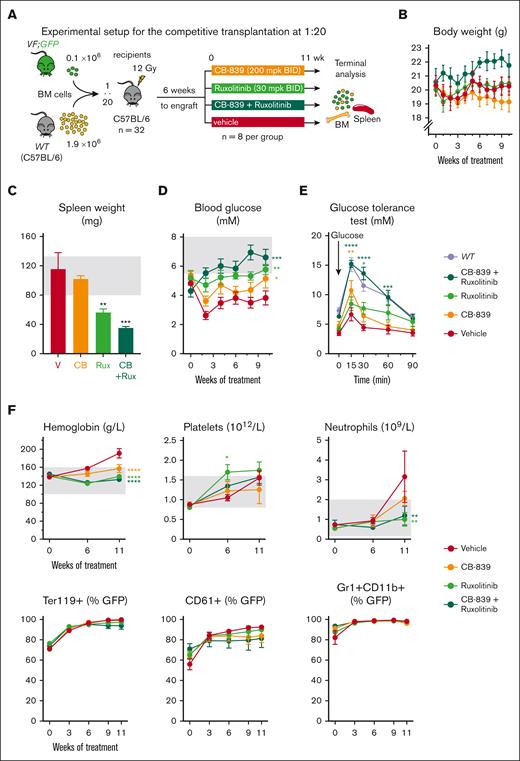
To assess the in vivo effects of CB-839 alone or in combination with the JAK1/2 inhibitor ruxolitinib, we performed competitive transplantations into irradiated WT recipient mice with BM cells from SclCreER,JAK2-V617F;UBC-GFP mice (VF;GFP), which express the GFP reporter protein in all hematopoietic cells,30 mixed with WT competitor cells in a 1:20 ratio (Figure 2A). Six weeks after transplantation, the recipient mice were randomized into 4 groups and treated with CB-839, ruxolitinib, CB-839+ruxolitinib, or vehicle control.
Effects of the GLS inhibitor CB-839, alone or in combination with ruxolitinib in vivo. (A) Experimental setup. VF;GFP BM cells were transplanted in competition with WT cells at a 1 to 20 ratio and the treatment started 6 weeks after engraftment. N = 12 mice per group. (B) Body weight of the mice monitored during the treatment. (C) Spleen weight of the mice from each group at the end of the experiment (after 11 weeks of treatment). (D) Treatment-induced changes in blood glucose levels measured in nonfasting conditions. (E) Glucose tolerance test performed 10 weeks after starting the treatment (right), in which fasting mice for 8 hours were injected with glucose IP and blood glucose levels monitored at different time points. (F) Effects of the treatment on hemoglobin, platelet, and neutrophil count (top) and on VF; GFP chimerism (represented as percentage of GFP+ cells) in erythrocytes (Ter119+), platelets (CD61+), and neutrophils (Gr1+ CD11b+) (bottom). The area colored in gray depicts the normal range expected for WT mice. The plots represent the mean ± SEM. 2-way ANOVA was performed in panels B,D-F and 1-way ANOVA in panel C; followed by Fisher least significant difference (LSD) test. ∗P < .05, ∗∗P < .01, ∗∗∗P < .001, and ∗∗∗∗P < .0001.
Effects of the GLS inhibitor CB-839, alone or in combination with ruxolitinib in vivo. (A) Experimental setup. VF;GFP BM cells were transplanted in competition with WT cells at a 1 to 20 ratio and the treatment started 6 weeks after engraftment. N = 12 mice per group. (B) Body weight of the mice monitored during the treatment. (C) Spleen weight of the mice from each group at the end of the experiment (after 11 weeks of treatment). (D) Treatment-induced changes in blood glucose levels measured in nonfasting conditions. (E) Glucose tolerance test performed 10 weeks after starting the treatment (right), in which fasting mice for 8 hours were injected with glucose IP and blood glucose levels monitored at different time points. (F) Effects of the treatment on hemoglobin, platelet, and neutrophil count (top) and on VF; GFP chimerism (represented as percentage of GFP+ cells) in erythrocytes (Ter119+), platelets (CD61+), and neutrophils (Gr1+ CD11b+) (bottom). The area colored in gray depicts the normal range expected for WT mice. The plots represent the mean ± SEM. 2-way ANOVA was performed in panels B,D-F and 1-way ANOVA in panel C; followed by Fisher least significant difference (LSD) test. ∗P < .05, ∗∗P < .01, ∗∗∗P < .001, and ∗∗∗∗P < .0001.
The treatment was well-tolerated and did not induce any decrease in body weight (Figure 2B). Although splenomegaly was not very prominent at this stage of the experiment, mice that received CB-839+ruxolitinib displayed a reduction in spleen weight superior to that seen in mice treated with ruxolitinib alone (Figure 2C). Vehicle-treated mice displayed hypoglycemia, which was partially normalized by CB-839 alone and fully normalized in combination with ruxolitinib (Figure 2D). Mice in the control group also showed an abnormal glucose tolerance test, indicating that glucose was immediately consumed after IP injection (Figure 2E). CB-839 alone or in combination with ruxolitinib reduced glucose consumption, as shown by the normalized time course of the response to glucose administration. Although mice from the vehicle group developed erythrocytosis, CB-839 treatment normalized hemoglobin levels to a similar degree as ruxolitinib (Figure 2F). No significant differences in VF; GFP chimerism were observed between the treatment groups.
CB-839 combined with 3PO had synergistic effects on MPN phenotype in vivo
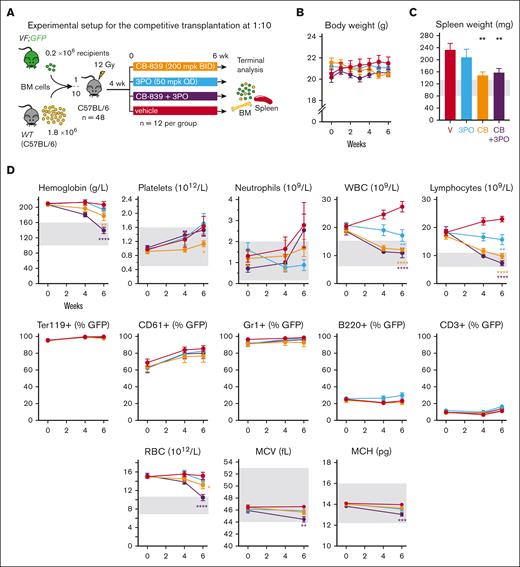
To investigate the effects of simultaneously inhibiting both glutaminolysis and glycolysis, we transplanted BM cells from VF;GFP and WT donor mice mixed at a 1:10 ratio into lethally irradiated WT recipient mice (Figure 3A). At 6 weeks posttransplantation, the mice had developed PV phenotype, and the cohort was randomized into 4 groups according to hemoglobin levels. The mice were then treated with CB-839, 3PO, the combination of both drugs or vehicle.
Effects of the GLS inhibitor CB-839, alone or in combination with the glycolytic inhibitor 3PO on hematologic parameters in vivo. (A) Experimental setup. Drug treatment started after 4 weeks of engraftment, n = 12 mice per group. (B) Body weight monitoring during the course of the study, as an indicator of toxicity. (C) Spleen weight of the mice at the end of the treatment. (D) Top: effects on blood counts measured at week 4 of the treatment and at week 6. Middle: VF;GFP chimerism of different cell types in peripheral blood, calculated by % of GFP+ cells in each population analyzed by flow cytometry. From left to right: erythrocytes (Ter119+), platelets (CD61+), neutrophils (CD11b+ Gr1+), B-cells (B220+), and T-cells (CD3+). Bottom: red blood cell (RBC) count, MCV, and mean corpuscular hemoglobin (MCH) of RBCs. The area colored in gray depicts the normal range expected for WT mice. The plots represent the mean ± SEM. 2-way ANOVA for panels B,D or 1-way ANOVA for panel C with multiple comparisons with the vehicle group (Fisher LSD test) were performed. ∗P < .05, ∗∗P < .01, ∗∗∗P < .001, and ∗∗∗∗P < .0001.
Effects of the GLS inhibitor CB-839, alone or in combination with the glycolytic inhibitor 3PO on hematologic parameters in vivo. (A) Experimental setup. Drug treatment started after 4 weeks of engraftment, n = 12 mice per group. (B) Body weight monitoring during the course of the study, as an indicator of toxicity. (C) Spleen weight of the mice at the end of the treatment. (D) Top: effects on blood counts measured at week 4 of the treatment and at week 6. Middle: VF;GFP chimerism of different cell types in peripheral blood, calculated by % of GFP+ cells in each population analyzed by flow cytometry. From left to right: erythrocytes (Ter119+), platelets (CD61+), neutrophils (CD11b+ Gr1+), B-cells (B220+), and T-cells (CD3+). Bottom: red blood cell (RBC) count, MCV, and mean corpuscular hemoglobin (MCH) of RBCs. The area colored in gray depicts the normal range expected for WT mice. The plots represent the mean ± SEM. 2-way ANOVA for panels B,D or 1-way ANOVA for panel C with multiple comparisons with the vehicle group (Fisher LSD test) were performed. ∗P < .05, ∗∗P < .01, ∗∗∗P < .001, and ∗∗∗∗P < .0001.
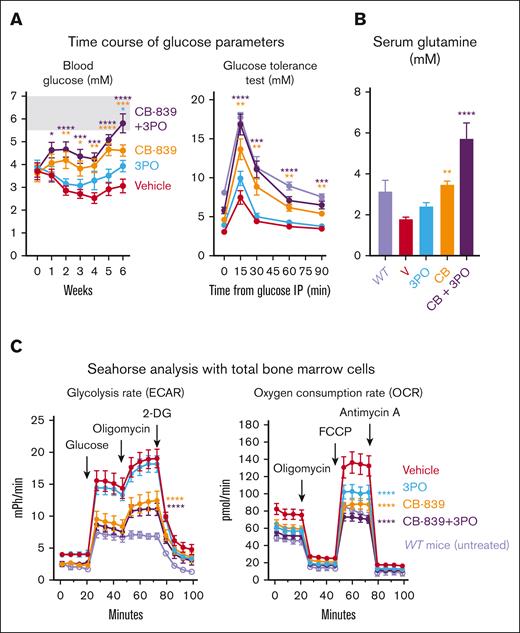
The treatments were well-tolerated and the body weight did not change (Figure 3B). In addition, CB-839, 3PO, or the combination of both drugs did not show toxicity in WT (C57BL/6) mice (supplemental Figure 1). Mice from the vehicle group developed splenomegaly, which was significantly reduced by CB-839 alone or in combination with 3PO (Figure 3C). CB-839 alone also reduced hemoglobin levels, platelet, neutrophil, and total white blood cell counts (Figure 3D). The combination of CB-839 and 3PO was particularly effective in the erythroid lineage, leading to complete normalization of hemoglobin levels mainly by reducing erythrocyte numbers and only slightly by lowering the mean corpuscular volume (MCV) and mean corpuscular hemoglobin. VF;GFP-chimerism in peripheral blood was not altered by any of the treatments (Figure 3D). In line with the experiment shown in Figure 2, CB-839 partially restored normal blood glucose levels and normalized the physiological response to glucose injection in glucose tolerance test (Figure 4A), whereas the combination of CB-839 fully normalized these parameters. Interestingly, serum Gln levels were lower in recipients of VF;GFP BM compared with WT controls. This feature was normalized by the treatment with CB-839 or 3PO, whereas CB-839+3PO caused Gln levels to be significantly higher than WT (Figure 4B). Seahorse assays with total BM cells showed increased anaerobic glycolysis (ECAR) and OCRs in vehicle-treated VF mice compared to untreated WT controls (Figure 4C). In contrast, CB-839 alone or in combination with 3PO almost completely normalized glycolysis and respiration rates.
Analysis of metabolic parameters of mice from the experiment shown inFigure 3(n = 12 per group). (A) Left panel: Time course of nonfasting blood glucose levels. Right panel: glucose tolerance test. Blood glucose concentration was measured at different time intervals after injecting glucose IP in all the mice treated in the experiment, at week 6 of treatment. In light purple, untreated WT mice (n = 6) analyzed separately. (B) Glutamine (Gln) concentration in the serum from treated mice at the end of the experiment (week 6) and from untreated WT mice (n = 3). C) Left panel: measurement of ECAR upon injection of glucose, oligomycin, and 2-DG, as an indication of lactate production. Right panel: OCR upon administration of oligomycin, FCCP, and Antimycin A, indicative of mitochondrial oxidative phosphorylation. Both experiments were performed in a 96-well plate Seahorse assay, with 2 × 10⁵ BM cells per well (n = 12 mice per group). In light purple, results from BM cells from untreated WT mice (n = 6). The plots represent the mean ± SEM. 2-way ANOVA followed by Dunnett’s test for multiple comparison was applied in panels A,C and 1-way ANOVA with Dunnett’s test in panel B. ∗P < .05, ∗∗P < .01, ∗∗∗P < .001, and ∗∗∗∗P < .0001.
Analysis of metabolic parameters of mice from the experiment shown inFigure 3(n = 12 per group). (A) Left panel: Time course of nonfasting blood glucose levels. Right panel: glucose tolerance test. Blood glucose concentration was measured at different time intervals after injecting glucose IP in all the mice treated in the experiment, at week 6 of treatment. In light purple, untreated WT mice (n = 6) analyzed separately. (B) Glutamine (Gln) concentration in the serum from treated mice at the end of the experiment (week 6) and from untreated WT mice (n = 3). C) Left panel: measurement of ECAR upon injection of glucose, oligomycin, and 2-DG, as an indication of lactate production. Right panel: OCR upon administration of oligomycin, FCCP, and Antimycin A, indicative of mitochondrial oxidative phosphorylation. Both experiments were performed in a 96-well plate Seahorse assay, with 2 × 10⁵ BM cells per well (n = 12 mice per group). In light purple, results from BM cells from untreated WT mice (n = 6). The plots represent the mean ± SEM. 2-way ANOVA followed by Dunnett’s test for multiple comparison was applied in panels A,C and 1-way ANOVA with Dunnett’s test in panel B. ∗P < .05, ∗∗P < .01, ∗∗∗P < .001, and ∗∗∗∗P < .0001.
Effects of metabolic inhibitors on HSPCs
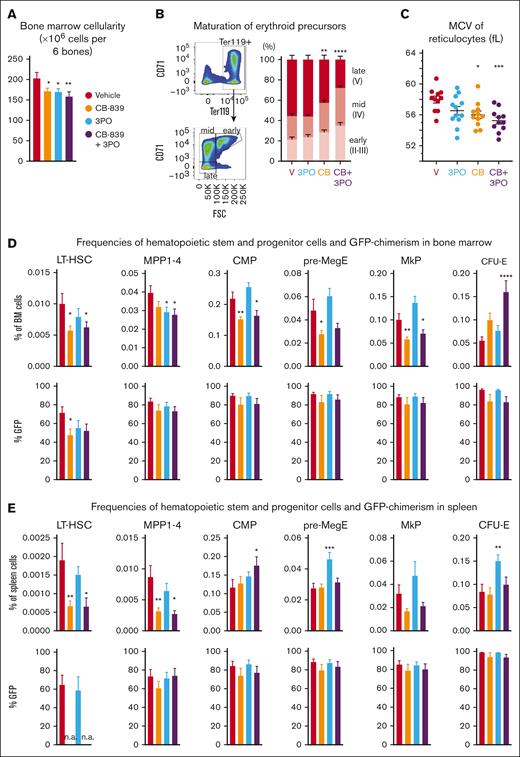
BM cellularity was reduced by 15% in VF mice treated with either CB-839 or 3PO and by 22% in mice treated with the combination of both drugs (Figure 5A). Analysis of erythroid maturation37 revealed that early- (II-III) and midmaturation stages (IV) were enriched in mice treated with CB-839 and CB-839+3PO at the expense of the late-stage (V) reticulocytes and erythrocytes (Figure 5B). The MCV of reticulocytes was reduced by CB-839 alone or in combination with 3PO (Figure 5C), suggesting that not only proliferation but also hemoglobinization of erythroid precursors was impaired.
Analysis of HSPCs from BM and spleens of mice (n = 12 per group) from the experiment shown inFigure 3. (A) Total BM cellularity of treated mice (number of cells per 2 femurs, 2 tibias plus pelvis). (B) Percentages of early (CD71+ Ter119+ FSChigh), mid (CD71+ Ter119+ FSClow) and late (CD71− Ter119+ FSClow) erythroid precursors among all Ter119+ cells in each treatment arm (C) MCV of reticulocytes after 6 weeks of treatment. Individual values of each mouse are also plotted. (D) Top: frequencies of indicated subpopulations in BM, represented as percentage of total BM: HSCs (lin− ckit+ Sca1+ CD150+ CD48−), MPP (lin− ckit+ Sca1+, excluding HSCs), common myeloid progenitor (lin− ckit+ Sca1− CD34+ CD16−), pre-MegE (lin− ckit+ Sca1− CD41− CD16− CD105− CD150+), megakaryocyte progenitors (MkP) (lin− ckit+ Sca1− CD41+ CD150+), and CFU-E (lin− ckit+ Sca1− CD41− CD16− CD105+ CD150−). Bottom: VF;GFP chimerism (% GFP+ cells) in each population. (E) Top: frequencies of indicated subpopulations in the spleen, represented as percentage of total spleen cells. Cell types were identified as in panel B. Bottom: VF;GFP chimerism (% of GFP+ cells) in each population in the spleen. The plots represent the mean ± SEM. 1-way ANOVA was performed, followed by Fisher LSD test for statistical comparisons of each treatment group with the vehicle. ∗P < .05, ∗∗P < .01, ∗∗∗P < .001, ∗∗∗∗P < .0001.
Analysis of HSPCs from BM and spleens of mice (n = 12 per group) from the experiment shown inFigure 3. (A) Total BM cellularity of treated mice (number of cells per 2 femurs, 2 tibias plus pelvis). (B) Percentages of early (CD71+ Ter119+ FSChigh), mid (CD71+ Ter119+ FSClow) and late (CD71− Ter119+ FSClow) erythroid precursors among all Ter119+ cells in each treatment arm (C) MCV of reticulocytes after 6 weeks of treatment. Individual values of each mouse are also plotted. (D) Top: frequencies of indicated subpopulations in BM, represented as percentage of total BM: HSCs (lin− ckit+ Sca1+ CD150+ CD48−), MPP (lin− ckit+ Sca1+, excluding HSCs), common myeloid progenitor (lin− ckit+ Sca1− CD34+ CD16−), pre-MegE (lin− ckit+ Sca1− CD41− CD16− CD105− CD150+), megakaryocyte progenitors (MkP) (lin− ckit+ Sca1− CD41+ CD150+), and CFU-E (lin− ckit+ Sca1− CD41− CD16− CD105+ CD150−). Bottom: VF;GFP chimerism (% GFP+ cells) in each population. (E) Top: frequencies of indicated subpopulations in the spleen, represented as percentage of total spleen cells. Cell types were identified as in panel B. Bottom: VF;GFP chimerism (% of GFP+ cells) in each population in the spleen. The plots represent the mean ± SEM. 1-way ANOVA was performed, followed by Fisher LSD test for statistical comparisons of each treatment group with the vehicle. ∗P < .05, ∗∗P < .01, ∗∗∗P < .001, ∗∗∗∗P < .0001.
CB-839 alone induced a 50% reduction in the frequency of phenotypic long-term hematopoietic stem cells (LT-HSCs) (lin−, ckit+ Sca1+ CD150+ CD48−) in BM, as well as a significant decrease of frequencies across all progenitor populations analyzed, with the exception of CFU-Es, whose frequencies doubled with CB-839 alone and even tripled in the CB-839 plus 3PO group (Figure 5D). CB-839 also lowered GFP-chimerism of LT-HSCs (47% compared to 71% in the vehicle mice). However, no differences in GFP-chimerism were found in other myeloid progenitor populations. Similarly, CB-839 strongly reduced the percentage of LT-HSCs in the spleen (63% reduction compared to vehicle), whereas the frequencies of common myeloid progenitors and CFU-E remained unchanged (Figure 5E). Because the number of LT-HSCs detected in spleen of CB-839 treated mice was very low, a reliable estimate of the GFP-chimerism was not possible.
To assess whether HSCs from VF mice upregulate the expression levels of enzymes regulating glutamine metabolism, we analyzed single-cell RNA sequencing data of HSCs from VF vs WT mice. We found no changes in the RNA expression levels of Gls, Gls2, and Glud1, encoding enzymes involved in glutamine metabolism (supplemental Figure 2). However, expression of genes involved in the conversion of glutamine into glutathione (Gclm, Gss) were elevated in HSCs from VF mice, supporting the hypothesis that VF HSCs have higher demand of glutamine-derived glutathione to compensate for increased oxidative stress. VF HSCs also displayed a modest increase in the expression of some glutamine transporters, specially Slc7a8.
Examining the effects of combinations of CB-839 with 3PO and ruxolitinib in advanced stages of MPN
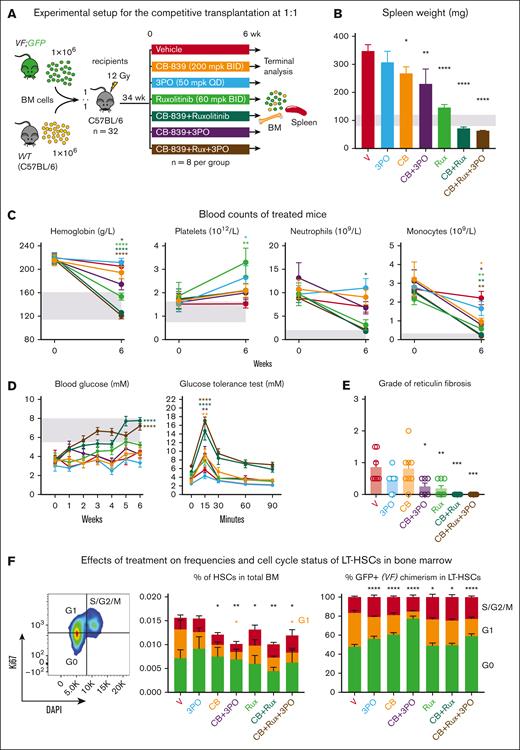
We investigated combinations of CB-839 with 3PO, ruxolitinib, as well as a triple combination of CB-839, 3PO, and ruxolitinib in a cohort of mice 34 weeks after transplantation of VF;GFP and WT BM at 1:1 dilution (Figure 6). The PV phenotype was more severe than in the previous 1:20 and 1:10 transplantations, CB-839 alone reduced spleen weight, but did not decrease blood counts (Figure 6B-C). CB-839+ruxolitinib and the triple therapy showed strong reduction of spleen weight and blood counts and also normalized glucose levels (Figure 6B-D). At terminal workup, vehicle treated mice displayed mild myelofibrosis (median grade 1). CB-839 or 3PO alone had no effect, but the combination of CB-839 plus 3PO significantly reduced fibrosis (Figure 6E). Ruxolitinib alone had an effect similar to the combination of CB-839 plus 3PO, but ruxolitinib combined with CB-839 or with CB-839 plus 3PO completely abrogated myelofibrosis. Because at this late stage close to 100% of the LT-HSCs were GFP positive, we did not observe a decrease in GFP-chimerism, but similar to the previous drug study (Figure 5), CB-839 alone or in combinations with 3PO or ruxolitinib reduced the overall frequencies of LT-HSCs, and this reduction was mainly due to a decrease in the percentages of LT-HSCs in the G1 phase of the cell cycle (Figure 6F).
Examining the effects of drug treatments on advanced stages of MPN. (A) Experimental setup. (B) Spleen weight measured after 6 weeks of treatment. (C) Blood counts of treated mice before and after 6 weeks of treatment. (D) Blood glucose levels measured weekly during the treatment (left) and glucose tolerance test performed after 5 weeks of treatment (right). (E) Reticulin fibrosis grade determined in sternum after 6 weeks of treatment. (F) Frequencies of LT-HSCs in BM and their cell cycle status (left panel) and normalized percentages of LT-HSCs in different stages of the cell cycle (right panel). The markers used for cell cycle analysis were G0: Ki67− DAPI−, G1: Ki67+ DAPI−, and S/G2/M: Ki67+ DAPI+. Mean ± SEM is represented. 2-way ANOVA with multiple comparison against vehicle was performed with Fisher LSD test for panels C-D,F. 1-way ANOVA with multiple comparison to the vehicle group was performed with Fisher LSD test on panels B,E. ∗P < .05, ∗∗P < .01, ∗∗∗P < .001, and ∗∗∗∗P < .0001.
Examining the effects of drug treatments on advanced stages of MPN. (A) Experimental setup. (B) Spleen weight measured after 6 weeks of treatment. (C) Blood counts of treated mice before and after 6 weeks of treatment. (D) Blood glucose levels measured weekly during the treatment (left) and glucose tolerance test performed after 5 weeks of treatment (right). (E) Reticulin fibrosis grade determined in sternum after 6 weeks of treatment. (F) Frequencies of LT-HSCs in BM and their cell cycle status (left panel) and normalized percentages of LT-HSCs in different stages of the cell cycle (right panel). The markers used for cell cycle analysis were G0: Ki67− DAPI−, G1: Ki67+ DAPI−, and S/G2/M: Ki67+ DAPI+. Mean ± SEM is represented. 2-way ANOVA with multiple comparison against vehicle was performed with Fisher LSD test for panels C-D,F. 1-way ANOVA with multiple comparison to the vehicle group was performed with Fisher LSD test on panels B,E. ∗P < .05, ∗∗P < .01, ∗∗∗P < .001, and ∗∗∗∗P < .0001.
CB-839 inhibited the proliferation of HSPCs from PV patients in vitro
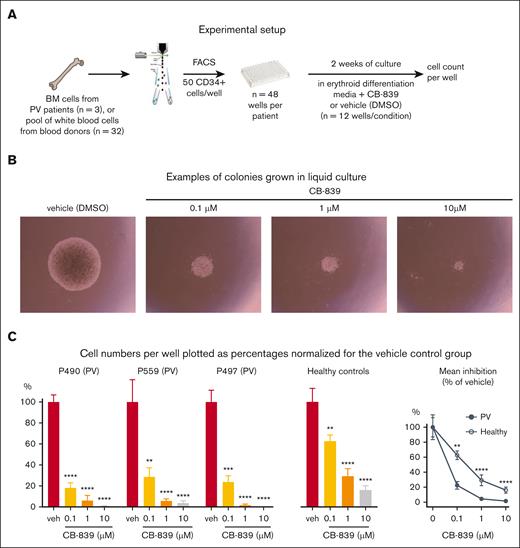
To validate the effects of CB-839 in primary cells from MPN patients, we purified CD34+ cells from PV patients and healthy controls and performed liquid cultures in erythroid-differentiating media for 2 weeks in the presence of CB-839 or vehicle (Figure 7A). CB-839 reduced the number of cells per well compared to the DMSO controls (Figure 7B-C). The lowest concentration used (0.1 μM) was sufficient to reduce growth by nearly 80% in the PV group but had only 38% growth inhibition in cells from healthy control (Figure 7C). The effect was very similar in all 3 PV patients analyzed. These data in primary cells from MPN patients are consistent with the findings observed in our mouse model.
Analysis of human CD34+ cell from BM grown in liquid cultures with media favoring erythroid differentiation. (A) Experimental setup. CD34+ cells were isolated by cell sorting from BM cells of PV patients (n = 3) or a pool of white blood cells from 32 healthy blood donors, deposited into 48 well plates, and cultured in presence of CB-839 or vehicle for 2 weeks. (B) Example of colonies grown from PV patient P490 after 2 weeks. (C) Percentages of cell counts relative to the vehicle (veh) group (n = 12 wells) for each patient sample and a sample from healthy controls are shown. Right panel shows the mean growth inhibition by CB-839 of the 3 patient samples and the healthy control relative to vehicle set as 100%. Mean ± SEM is represented. 2-way ANOVA with multiple comparison to DMSO with Fisher LSD test was performed in panel C. ∗P < .05, ∗∗P < .01, ∗∗∗P < .001, and ∗∗∗∗P < .0001.
Analysis of human CD34+ cell from BM grown in liquid cultures with media favoring erythroid differentiation. (A) Experimental setup. CD34+ cells were isolated by cell sorting from BM cells of PV patients (n = 3) or a pool of white blood cells from 32 healthy blood donors, deposited into 48 well plates, and cultured in presence of CB-839 or vehicle for 2 weeks. (B) Example of colonies grown from PV patient P490 after 2 weeks. (C) Percentages of cell counts relative to the vehicle (veh) group (n = 12 wells) for each patient sample and a sample from healthy controls are shown. Right panel shows the mean growth inhibition by CB-839 of the 3 patient samples and the healthy control relative to vehicle set as 100%. Mean ± SEM is represented. 2-way ANOVA with multiple comparison to DMSO with Fisher LSD test was performed in panel C. ∗P < .05, ∗∗P < .01, ∗∗∗P < .001, and ∗∗∗∗P < .0001.
Discussion
Increased energy demands of cancer cells represent metabolic vulnerabilities that can serve as attractive targets for therapeutic interventions. We expanded our previous studies about the dependence of JAK2-mutant hematopoiesis on glucose and now show that these cells also exhibit strong dependence on Gln-derived ATP. The GLS inhibitor CB-839 decreased oxidative phosphorylation in hematopoietic cells from VF mice and induced hematologic response (Figures 1-3). The combination of CB-839 with the JAK1/2 inhibitor ruxolitinib showed additive effects in respect to normalizing blood glucose and blood counts, and the combination of CB-839 with 3PO completely normalized hemoglobin levels.
CB-839 had antiproliferative effects resulting in reduced overall BM cellularity with a decrease of frequencies across all progenitor populations (Figure 5A,D). However, the frequencies of CFU-Es actually increased (Figure 5D). This increase is likely due to the delayed erythroid maturation observed in the treatment groups (Figure 5B). These results, together with the decrease in MCV and mean corpuscular hemoglobin (Figures 3D and 5C), suggest that CB-839 also impairs hemoglobinization. In fact, synthesis of the heme precursor 5-aminolevulinic acid strongly depends on Gln-derived succinyl-CoA.38 Furthermore, protein translation is one of the most energy demanding processes in cellular function and the massively increased translation of globin messenger RNA during erythroid maturation was shown to be highly dependent on ATP supply.39 Thus, the effects of CB-839 on the erythroid lineage are likely due to a combination of inhibiting proliferation and impairing hemoglobin synthesis.
Hypoglycemia in VF mice was shown to be caused by increased glucose consumption by erythropoietic cells.14 Acute exposure of BM cells from VF mice to CB-839 in vitro resulted in an increase of glycolysis rate in the Seahorse assay (Figure 1), an effect likely associated with an attempt to compensate for the block of Gln-derived ATP production. We therefore expected CB-839 to aggravate hypoglycemia in mice. Surprisingly, hypoglycemia was in part corrected in all the groups that received CB-839 compared to vehicle-treated mice. Of note, these changes occurred rapidly and were already observed 1 week after starting the treatment. The normalized glucose tolerance tests and metabolic flux assays in mice treated with CB-839 (Figure 4) support the notion that inhibiting Gln metabolism resulted in reduced glucose consumption. Gln is also used to replenish TCA cycle intermediates that are required for the synthesis of heme, nonessential amino acids, and nucleotides. Obstructing the Gln flow into these anabolic pathways may contribute to limiting the proliferation of the MPN cells. αKG is a critical metabolic intermediate produced from Glu by glutamate dehydrogenase, and it has been shown to activate mTORC1,40 which in turn promotes glycolysis.41 Therefore, αKG depletion induced by CB-839 may decrease mTORC1 activity, which could explain the reduction in glycolysis rate detected in metabolic flux experiments (Figure 4). Our Seahorse assays were performed with BM cells from MPN mice previously treated with CB-839 in vivo, but the actual metabolic flux measurements in vitro were done in the absence of CB-839. Thus, the observed decrease in oxidative phosphorylation and glycolysis rates suggests that MPN cells rewire their metabolic program upon long-term inhibition of GLS. These results support the hypothesis that CB-839 treatment causes a downmodulation of signaling pathways that control cell growth and metabolic demands, such as mTOR. Dual targeting of Gln metabolism and mTOR pathway with CB-839 and everolimus has been tested in a phase 2 trial for renal cell carcinoma26 and could also represent an attractive strategy to treat MPN.
VF mice also display lower concentration of free Gln in serum. This finding is in line with an excessive consumption of this amino acid. Similar to the normalization of blood glucose levels, the GLS inhibitor CB-839 restored normal serum Gln levels (Figure 4B), indicating that the dose and regimen chosen were sufficient to inhibit the conversion of Gln to Glu in vivo.
Given that the maintenance of the mutant MPN clone relies on the HSC compartment, curative therapies should target mutant HSCs in order to eventually eliminate the MPN clone. The decrease in JAK2-V617F chimerism in HSCs induced by CB-839 (Figure 5) suggests that inhibiting glutaminolysis may preferentially target JAK2-mutant HSCs. In fact, the total number of HSCs detected in CB-839-treated VF mice was lower than in the vehicle group, suggesting that HSCs expansion was impaired. The reduction of HSCs in G1 upon CB-839 treatment illustrates the Gln-dependence of G1 cycling HSCs and is in line with previous reports showing an increase of GLS expression in HSCs upon G0 exit.42 Therefore, the preferential effect of CB-839 on JAK2-mutant HSCs could be explained by the fact that the largely quiescent WT HSCs may be less dependent on Gln compared to JAK2-mutant HSCs, in which oxidative phosphorylation is increased as a consequence of higher cell division rate.14 In addition, CB-839 may also preferentially inhibit the proliferation of JAK2-mutant HSCs by limiting glutathione synthesis. Consistently, we found increased expression of Gclm and Gss in HSCs from VF mice compared to WT mice, 2 enzymes involved in glutathione synthesis (supplemental Figure 2).
The decrease in JAK2-V617F chimerism was limited to early HSPC populations, suggesting that blocking glutaminolysis cannot fully counteract the advantage that JAK2-mutant cells have over WT at later stages of differentiation. However, reducing the proportion of JAK2-mutant HSCs could in the long term also slowly translate into molecular responses in the more mature progenitor populations. CB-839 also showed potent antiproliferative activity on HSPCs from BM of PV patients compared to healthy controls (Figure 7). The growth inhibition of HSPCs in liquid culture was in the same range as reported for the most sensitive subset of breast cancer and kidney cancer cell lines.24,43
In conclusion, the GLS inhibitor CB-839 decreased glycolysis and oxidative phosphorylation of JAK2-mutant hematopoietic cells, normalized hematologic parameters in VF mice, and preferentially targeted JAK2-mutant HSCs over WT HSCs. CB-839 also showed additive effects with ruxolitinib on reducing myelofibrosis. These data suggest that inhibiting GLS alone or in combination with inhibitors of glycolysis or with JAK2 inhibitors represents an attractive new therapeutic approach to MPN.
Acknowledgments
The authors thank Telma Lopes, Stella Stefanova, Lorenzo Raeli, Emmanuel Traunecker, Jelena Markovic, and Irene Calvo from the flow cytometry core facility of Department of Biomedicine for help in cell sorting and flow cytometry analysis, the Établissement Français du Sang-Grand Est for providing white blood cells from leukodepletion filters of blood donors, and members of the laboratory for helpful discussions and critical reading of the manuscript.
This work was supported by grants from the Swiss National Science Foundation (31003A_166613, 310030_185297/1, and 310030_185297/2), Swiss Cancer Research Foundation (KFS-3655-02-2015 and KFS-4462-02-2018), and the Stiftung für Hämatologische Forschung (R.C.S.).
Authorship
Contribution: M.U. designed and performed research, analyzed data, and wrote the manuscript; N.H. designed and performed research and analyzed data; J.S., T.A.F., A.G., Q.K., S.R., and H.H.-S. performed research; J.R. and S.D. analyzed data; and R.C.S. designed research, analyzed data, and wrote the manuscript.
Conflict-of-interest disclosure: R.C.S. is a scientific adviser/SAB member and has equity in Ajax Therapeutics, and has consulted for and/or received honoraria from Novartis, Bristol Myers Squibb/Celgene, AOP, GlaxoSmithKline, Baxalta, and Pfizer. N.H. owns stocks in Cantargia. The remaining authors declare no competing financial interests.
Correspondence: Radek C. Skoda, Department of Biomedicine, University Hospital Basel, Hebelstrasse 20, 4031 Basel, Switzerland; email: radek.skoda@unibas.ch.
References
Author notes
For original data and reagents, please contact the corresponding author, Radek C. Skoda (radek.skoda@unibas.ch).
The full-text version of this article contains a data supplement.

