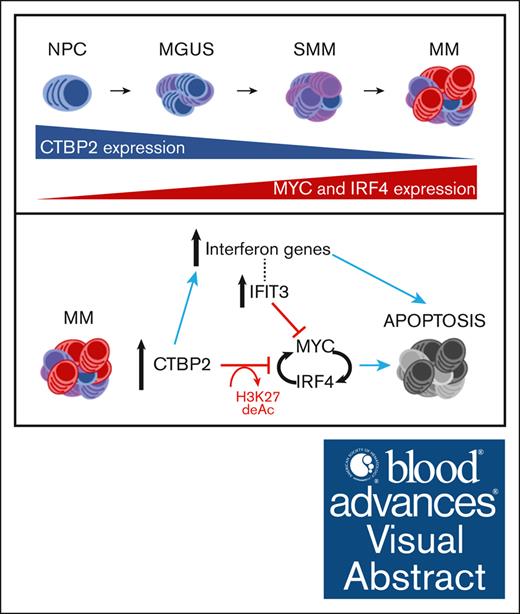
Frequent epigenetic downregulation of CTBP2 is associated with adverse clinicopathological features of MM.
CTBP2 represses the prosurvival MYC-IRF4 axis and its restoration elicits potent antimyeloma effects.
Visual Abstract
Multiple myeloma (MM) cells are addicted to MYC and its direct transactivation targets IRF4 for proliferation and survival. MYC and IRF4 are still considered “undruggable,” as most small-molecule inhibitors suffer from low potency, suboptimal pharmacokinetic properties, and undesirable off-target effects. Indirect inhibition of MYC/IRF4 emerges as a therapeutic vulnerability in MM. Here, we uncovered an unappreciated tumor-suppressive role of C-terminal binding protein 2 (CTBP2) in MM via strong inhibition of the MYC-IRF4 axis. In contrast to epithelial cancers, CTBP2 is frequently downregulated in MM, in association with shortened survival, hyperproliferative features, and adverse clinical outcomes. Restoration of CTBP2 exhibited potent antitumor effects against MM in vitro and in vivo, with marked repression of the MYC-IRF4 network genes. Mechanistically, CTBP2 impeded the transcription of MYC and IRF4 by histone H3 lysine 27 deacetylation (H3K27ac) and indirectly via activation of the MYC repressor IFIT3. In addition, activation of the interferon gene signature by CTBP2 suggested its concomitant immunomodulatory role in MM. Epigenetic studies have revealed the contribution of polycomb-mediated silencing and DNA methylation to CTBP2 inactivation in MM. Notably, inhibitors of Enhance of zeste homolog 2, histone deacetylase, and DNA methyltransferase, currently under evaluation in clinical trials, were effective in restoring CTBP2 expression in MM. Our findings indicated that the loss of CTBP2 plays an essential role in myelomagenesis and deciphers an additional mechanistic link to MYC-IRF4 dysregulation in MM. We envision that the identification of novel critical regulators will facilitate the development of selective and effective approaches for treating this MYC/IRF4-addicted malignancy.
Introduction
Multiple myeloma (MM) is a highly fatal plasma cell malignancy that remains clinically challenging in management. Despite the emergence of new treatment options, relapses are inevitable in up to 90% of patients, and the disease remains incurable to date.1 Therefore, effective and curative MM therapies are urgently needed.
The 2 key myeloma factors, MYC and IRF4, transactivates each other and form an autoregulatory loop that is indispensable for MM growth and survival.2,3 Knockdown of MYC and/or IRF4 is largely toxic to myeloma cells, irrespective of the genetic etiology, which makes the MYC-IRF4 axis an attractive and broadly applicable therapeutic target for this genetically complex malignancy.2-4 Although biologically potent, the highly dynamic structure and lack of pockets amenable to small-molecule inhibition renders both transcription factors “undruggable.”5,6 Indirect inhibition of MYC/IRF4 has proven to be a promising alternative. Recent studies have demonstrated the regulation of the MYC-IRF4 machinery by transcriptional corepressors in MM. In t(4;14) MM cells, multiple myeloma SET domain (MMSET) binds to the IRF4 promoter and activates its transcription.7 MMSET also mediates the recruitment of another corepressor, KAP1, to repress the transcription of miR-126∗ and eventually upregulates MYC.8 NCOR2 complexes with the nucleosome remodeling and deacetylase complex to repress MYC via CD180 inhibition.9 The MYC-driven transcriptional program is orchestrated by the interaction of KDM5A with the P-TEFb complex and MYC itself.10 These findings highlight the therapeutic potential of transcriptional corepressors in targeting this addicted pathway in MM.
C-terminal binding protein 2 (CTBP2) is a member of the C-terminal binding protein (CTBP) transcriptional corepressor family, which was first discovered as a partner of the adenovirus E1A protein.11 Growing evidence has revealed a tumorigenic role of CTBP2 in solid cancers. CTBP2 binds to the androgen receptor to repress tumor suppressors and androgen receptor corepressors in prostate cancer.12 In sporadic epithelial ovarian cancer, the CTBP2 corepressor complex binds and represses BRCA1 transcription.13 In contrast, another study reported that silencing CTBP2 increased stemness and tumor incidence in primary ovarian carcinoma and high CTBP2 expression is associated with increased overall survival (OS).14 These observations imply dual biological functions of CTBP2, which are context-dependent and governed by various partner genes and downstream modulation.
To date, the role of CTBP2 in hematological malignancies, including MM, remains largely elusive. In this study, frequent downregulation of CTBP2 was identified in MM, which was correlated with inferior survival and unfavorable clinical features, including hyperproliferation. CTBP2 elicits antiproliferative and proapoptotic functions via selective targeting of the MYC-IRF4 transcriptional network and activation of interferon-signaling genes. In addition to the direct repression of MYC and IRF4 transcription by H3K27 deacetylation, CTBP2 also induced the expression of IFIT3, an upstream negative regulator of MYC. Restoration of CTBP2 expression by inhibitors of Enhance of zeste homolog 2 (EZH2)/histone deacetylase (HDAC)/DNA methyltransferase (DNMT) indicated silencing of CTBP2 by multiple epigenetic mechanisms. Our findings highlight the novel functional significance of CTBP2 in MM pathogenesis and suggest new options to target the MYC-IRF4 axis in MM.
Materials and methods
Cell lines
Human myeloma, B-cell acute lymphoblastic leukemia (B-ALL) cell lines, and 293T cells were purchased from the American Type Culture Collection or Deutsche Sammlung von Mikroorganismen und Zellkulturen GmbH. Cells were cultured in RPMI-1640 medium supplemented with 10% to 15% fetal bovine serum, 1% penicillin/streptomycin, and 1% L-glutamine (GIBCO).
Clinical samples
Bone marrow (BM) samples were obtained from Prince of Wales Hospital. The study was approved by the Joint Chinese University of Hong Kong-New Territories East Cluster (CUHK-NTEC) clinical research ethics committee in accordance with the Declaration of Helsinki. All patients gave written consent and were clinically managed according to the guidelines of the International Myeloma Working Group. Among 154 studied patients with myeloma, 61 were treated with thalidomide-dexamethasone, velcade-thalidomide-dexamethasone, velcade-dexamethasone, cyclophosphamide-thalidomide-dexamethasone, or melphalan-prednisolone-thalidomide. Twenty-three patients received either bortezomib (BTZ)- or thalidomide-based induction treatment before autologous stem cell transplantation. Patients ineligible for autologous stem cell transplantation (n = 52) were given up-front treatment with conventional chemotherapy, including melphalan-prednisolone, vincristin-doxorubicin-dexamethasone, or vincristine-cyclophosphamide-melphalan-dexamethasone. Eighteen patients received palliative care only.
Lentiviral transduction
To investigate the effects of CTBP2 and/or MYC overexpression, we cloned pRSC-SFFV-CTBP2-E2A-GFP-Wpre (CTBP2) and pRSC-SFFV-MYC-E2A-GFP-Wpre (MYC) lentiviral vectors. The SFFV promoter drives high-level transgene expression and a green fluorescent protein (GFP) linked to the self-cleaving peptide, E2A. pRSC-SFFV-E2A-GFP-Wpre (EV) was used as the empty vector control. The G glycoprotein of the vesicular stomatitis virus-pseudotyped lentiviral vectors were packaged into 293T cells using the standard calcium phosphate precipitation protocol as detailed previously.15 The vectors were concentrated to 100× by centrifugation and titered by HT1080 transduction, followed by fluorescence-activated cell sorting analysis. MM cells were transduced with a multiplicity of infection of 2 to 4. Transduction efficiency, defined as GFP positive (GFP+) cells, was assessed by flow cytometry and fluorescence microscopy 3 days after transduction. For rescue experiments, simultaneous infection was performed using the indicated viruses.
Xenograft models
All animal studies were performed under an approved protocol by the CUHK Animal Experimentation Ethics Committee of The CUHK.
For the IV model, 8 to 10-week-old female nonobese diabetic/severe combined immunodeficiency IL-2rγ null (NSG) mice were irradiated at 250 cGy and IV infused with luciferase-expressing NCI-H929 cells (5 × 10⁶) bearing CTBP2 or EV. Systemic tumor load was measured serially using bioluminescence imaging. Local myeloma burden was evaluated in the BM, peripheral blood, and organs, including the liver, spleen, and kidney, by flow cytometry using antibodies against human CD138 (hCD138) and human CD38 (hCD38), when the control mice reached the humane end point. The duration of animal survival was concomitantly measured.
For the subcutaneous xenograft model, 6 to 8-week-old female NSG mice were inoculated with 10 × 106 NCI-H929-EV or NCI-H929-CTBP2 cells in the left and right flanks, respectively. Tumor growth was monitored every 4 days using calipers, and tumor volume was calculated using the formula: (length × width × width)/2, where the length is greater than the width.
Drug treatment
Cells were seeded in 6-well plates at a density of 1 × 10⁶ cells per ml and were treated with a DNA methylation inhibitor 5-Aza-2’-deoxycytidine (5-Aza-dC) (Sigma-Aldrich) at 1 to 10 μM for 96 hours, an HDAC inhibitor (HDACi) Trichostatin A (TSA) (Sigma-Aldrich) at 100 to 500 nM for 24 hours or Panobinostat (LBH589) at 10 nM for 48 hours, a histone methyltransferase EZH2 inhibitor 3-deazaneplanocin A (DZNep) (Abcam) at 1 to 10 μM for 72 hours or Tazemetostat (EPZ-6438) (Selleckchem) at 500 nM to 10 μM for 8 days, or in combinations.
Statistical analysis
Comparisons between 2 groups were analyzed using the Student t test or Mann-Whitney U test, according to the parametric or nonparametric distribution of data, respectively. Comparisons between 3 or more groups were analyzed using 1-way analysis of variance followed by Tukey or Dunnett multiple comparison test, as indicated. For clinic-pathologic correlation, categorical variables were analyzed using Fisher exact test or χ2 test, and continuous variables were analyzed using an unpaired t test. OS was defined as the length of time from diagnosis to death from any cause. Comparison of Kaplan-Meier survival curves was performed using the log-rank test. Statistical analyses were performed using SPSS software package version 19 (IBM) and GraphPad Prism 9 (GraphPad Software). Statistical significance was defined at P < .05.
Other experimental procedures are described in the supplemental Data.
All animal studies were performed under an approved protocol by the CUHK Animal Experimentation Ethics Committee of The CUHK (approval no.: 22-167-MIS).
Results
Selective downregulation of CTBP2 in MM is associated with inferior clinical outcomes
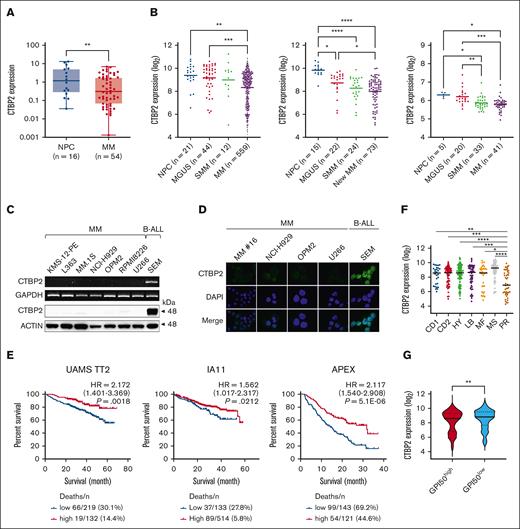
CTBP2 acts as an oncogene in several solid tumors. However, initial evaluation in the Cancer Cell Line Encyclopedia database revealed a noteworthy pattern of exceptionally low CTBP2 expression in blood cancers when compared with malignancies of epithelial origin and was lowest in MM among hematological neoplasms (supplemental Figure 1A-B). Concordantly, we confirmed the profound silencing of CTBP2 in our Chinese patient cohort with MM compared with that in normal plasma cells (Figure 1A; P = .0049). More importantly, sequential downregulation of CTBP2 levels during MM disease progression was observed in the independent data sets (Figure 1B).16-19 Verified at both mRNA and protein level, CTBP2 expression was barely detectable in MM (Figure 1C). Consistent with a previous report,20 immunofluorescence studies showed nuclear localization of CTBP2 in the positive control B-ALL cell line, SEM, whereas absence or dim CTBP2 expression was observed in human myeloma cell lines (HMCLs) and patient sample (Figure 1D). In contrast, the paralogous family member CTBP1 was readily detected in MM (supplemental Figure 2A-B).
CTBP2 expression and prognostic relevance in MM. (A) CTBP2 expression in normal plasma cells (NPC) and newly diagnosed Chinese patients with MM was detected by real-time quantitative polymerase chain reaction using a custom TaqMan assay for CTBP2. GAPDH served as the control. (B) Expression of CTBP2 using probe set 210554_s_at in NPC, patients with monoclonal gammopathy of undetermined significance (MGUS), smoldering MM (SMM), and MM from microarray data sets (left, combined GSE2658 and GSE5900; middle, GSE6477; right, GSE47552). Statistical significance of differences was determined using 1-way analysis of variance (ANOVA) with Tukey multiple comparison test. (C) Transcript and protein expression of CTBP2 in HMCLs were examined by semiquantitative reverse transcription polymerase chain reaction (upper) and immunoblotting (lower). The B-ALL cell line SEM was used as a positive control. GAPDH and β-actin served as the control, respectively. (D) Immunofluorescence analysis showing the expression and sublocalization of CTBP2 protein in MM cell lines and patient (16) MM cells (400× original magnification). As in panel C, SEM cells were used as positive control. The cells were counterstained with DAPI (4′,6-diamidino-2-phenylindole) for nuclear visualization. (E) Kaplan-Meier analyses showing the prognostic relevance of CTBP2 expression on OS in newly diagnosed patients with MM: UAMS TT2 cohort (GSE2658), MMRF CoMMpass trial IA11 release, and relapsed patient cohort with MM: APEX Trial (GSE9782) using the log-rank test. The optimal cutoff was determined using Cutoff Finder. (F) Dot plot showing median CTBP2 expression among the 7 molecular subgroups in the TT2 cohort. (G) Dot plot showing CTBP2 expression based on GPI-50 gene proliferation index in the TT2 cohort. MMRF, Multiple Myeloma Research Foundation.
CTBP2 expression and prognostic relevance in MM. (A) CTBP2 expression in normal plasma cells (NPC) and newly diagnosed Chinese patients with MM was detected by real-time quantitative polymerase chain reaction using a custom TaqMan assay for CTBP2. GAPDH served as the control. (B) Expression of CTBP2 using probe set 210554_s_at in NPC, patients with monoclonal gammopathy of undetermined significance (MGUS), smoldering MM (SMM), and MM from microarray data sets (left, combined GSE2658 and GSE5900; middle, GSE6477; right, GSE47552). Statistical significance of differences was determined using 1-way analysis of variance (ANOVA) with Tukey multiple comparison test. (C) Transcript and protein expression of CTBP2 in HMCLs were examined by semiquantitative reverse transcription polymerase chain reaction (upper) and immunoblotting (lower). The B-ALL cell line SEM was used as a positive control. GAPDH and β-actin served as the control, respectively. (D) Immunofluorescence analysis showing the expression and sublocalization of CTBP2 protein in MM cell lines and patient (16) MM cells (400× original magnification). As in panel C, SEM cells were used as positive control. The cells were counterstained with DAPI (4′,6-diamidino-2-phenylindole) for nuclear visualization. (E) Kaplan-Meier analyses showing the prognostic relevance of CTBP2 expression on OS in newly diagnosed patients with MM: UAMS TT2 cohort (GSE2658), MMRF CoMMpass trial IA11 release, and relapsed patient cohort with MM: APEX Trial (GSE9782) using the log-rank test. The optimal cutoff was determined using Cutoff Finder. (F) Dot plot showing median CTBP2 expression among the 7 molecular subgroups in the TT2 cohort. (G) Dot plot showing CTBP2 expression based on GPI-50 gene proliferation index in the TT2 cohort. MMRF, Multiple Myeloma Research Foundation.
Patients with MM with lower CTBP2 expression consistently had shorter OS in independent cohorts of newly diagnosed MM, including University of Arkansas for Medical Sciences (UAMS) TT2 (P = .0018) and Multiple Myeloma Research Foundation CoMMpass trial IA11 (P = .0212), as well as in the Assessment of Proteasome Inhibition for Extending Remissions (APEX) trial of relapsed patients with MM (P = 5.1E−6) (Figure 1E). In IA11, low CTBP2 expression correlated with inferior clinical features, including low hemoglobin (P = .008), high plasma cell infiltration in the BM (BM plasma cells, P < .001), higher M protein (P = .048), and adverse cytogenetic abnormalities, including t(14;16) (P = .008) and 1q21 amplification (P = .006) (Table 1). Multivariate Cox regression analysis suggested that CTBP2 expression was not an independent prognostic factor, although it was significant in univariate analysis (supplemental Table 1). In addition, the expression of CTBP2 was significantly lower in high-risk patients defined by gene expression profiling-based molecular classification, including the proliferative group (PR) characterized by an overexpression of genes in the cell cycle and proliferation,21 and a GPI50-high signature (Figure 1F-G).22,23 Collectively, these data highlight the involvement and potential tumor-suppressive role of CTBP2 in myelomagenesis, which is distinctly different from the previously reported oncogenic properties in solid tumors.
Correlation between CTBP2 expression and clinico-pathological parameters in the MMRF CoMMpass trial IA11 release
| Clinical parameters . | Low CTBP2 (n = 141) . | High CTBP2 (n = 604) . | Overall (n = 745) . | 2-sided P value . |
|---|---|---|---|---|
| Age at diagnosis | ||||
| <65 | 78/141 (55.3%) | 336/604 (55.6%) | 414/745 (55.6%) | 1.000 |
| ≥65 | 63/141 (44.7%) | 268/604 (44.4%) | 331/745 (44.4%) | |
| Gender | ||||
| Male | 80/141 (56.7%) | 361/604 (59.8%) | 441/745 (59.2%) | .507 |
| Female | 61/141 (43.3%) | 243/604 (40.2%) | 304/745 (40.8%) | |
| ISS stage | ||||
| I | 36/136 (26.5%) | 215/588 (36.6%) | 251/724 (34.7%) | .082 |
| II | 55/136 (40.4%) | 209/588 (35.5%) | 264/724 (36.5%) | |
| III | 45/136 (33.1%) | 164/588 (27.9%) | 209/724 (28.9%) | |
| β2-microglobulin (≥5.5 mg) | 45/135 (33.3%) | 163/585 (27.9%) | 208/720 (28.9%) | .208 |
| Albumin (≥3.5 mg/L) | 79/141 (59.6%) | 365/604 (60.4%) | 444/745 (59.6%) | .342 |
| Hypercalcemia (≥12 mg/dL) | 6/141 (4.3%) | 25/604 (4.1%) | 31/745 (4.2%) | 1.000 |
| LDH (≥190 U/L) | 46/107 (43%) | 176/483 (36.4%) | 222/590 (37.36%) | .225 |
| Creatinine (≥2.0 mg/dL) | 11/141 (7.8%) | 67/604 (11.1%) | 78/745 (10.5%) | .287 |
| Hb (<10 g/dL) | 68/141 (48.2%) | 218/604 (36.1%) | 286/745 (38.4%) | .008∗ |
| BMPC (%) | 26.6 (2-88) | 17.1 (0-91) | 16.0 (0-94) | <.001∗ |
| M protein (g/dL) | 3.38 (0-9.98) | 2.97 (0-12.27) | 3.0 (0-12.27) | .048∗ |
| Cytogenetic abnormalities | ||||
| Deletion of 17p13 | 6/87 (6.9%) | 46/348 (13.2%) | 52/435 (12.0%) | .138 |
| t(4;14) | 22/103 (21.4%) | 75/421 (17.8%) | 97/524 (18.5%) | .399 |
| t(8;14) | 2/56 (3.6%) | 3/195 (1.5%) | 5/251 (2%) | .310 |
| t(14;16) | 17/91 (18.7%) | 34/391 (8.7%) | 51/482 (10.6%) | .008∗ |
| t(14;20) | 2/69 (2.9%) | 6/265 (2.3%) | 8/334 (2.4%) | .671 |
| Amplification of 1q | 43/85 (50.6) | 127/369 (34.4%) | 170/454 (37.4%) | .006∗ |
| Deletion of 1p | 6/75 (8%) | 46/351 (13.1%) | 52/426 (12.2%) | .250 |
| Deletion of 13q | 32/101 (31.7%) | 106/392 (27.0%) | 138/493 (28.0%) | .385 |
| Nonhyperdiploid | 105/123 (85.4%) | 467/525 (89.0%) | 572/648 (88.3%) | .277 |
The optimal cutoff for CTBP2 expression was determined using Cutoff Finder, as illustrated in Figure 1E.
The mean (range) is presented for continuous variables. Categorical variables were analyzed by Fisher exact test or χ2 test, and continuous variables were analyzed by unpaired t test.
BMPC, BM plasma cells; Hb, hemoglobin;, LDH lactate dehydrogenase; MMRF, Multiple Myeloma Research Foundation.
Statistically significant (P < .05).
CTBP2 impairs growth and survival of MM cells in vitro and in vivo
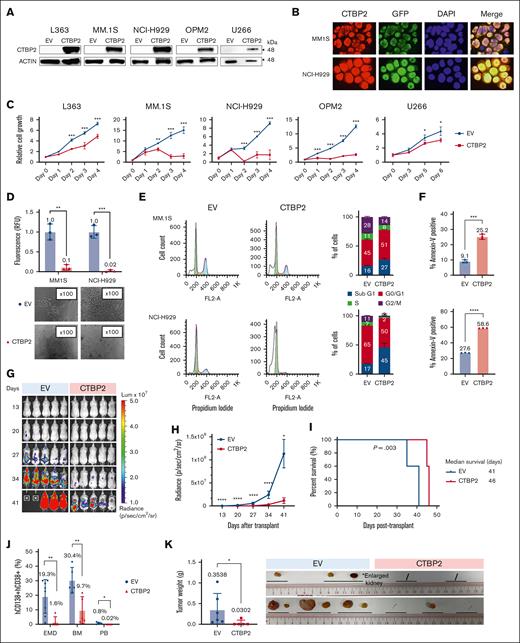
As most MM lack CTBP2 expression, we explored its functional roles using lentiviral expression system in vitro and in vivo. Restoration of CTBP2 and its nuclear localization were confirmed by immunoblotting and immunofluorescence analyses, respectively (Figure 2A-B). CTBP2 markedly suppressed cell proliferation and clonogenicity of HMCLs regardless of their genetic and cytogenetic subtypes (Figure 2C-D; supplemental Table 2). Conversely, the knockdown of CTBP2 promoted the growth of the CTBP2-expressing MM cell line KMS11 (supplemental Figure 3A-C). Overexpression of CTBP1 did not exhibit similar growth inhibition, indicating the specific antimyeloma effect of CTBP2 (supplemental Figure 4A-B). Flow cytometric analyses revealed an increase in the sub-G1 population and G0/G1 cell cycle arrest in CTBP2-overexpressing cells (Figure 2E). Annexin-V staining confirmed the induction of apoptosis by CTBP2 (Figure 2F). Ectopic CTBP2 expression also sensitized MM cells to the frontline agent BTZ, which is in line with the significantly lower CTBP2 level observed in BTZ nonresponders (supplemental Figure 5A-B).
Restoration of CTBP2 elicits antimyeloma activity in vitro and in vivo. HMCLs were transduced with GFP empty vector control (EV) or CTBP2-overexpressing vector (CTBP2). Three days after transduction was assigned as day 0 for subsequent functional studies. (A) Stable overexpression of CTBP2 was confirmed using immunoblotting. β-actin served as the internal control. (B) Immunofluorescence study of transduced HMCLs showing nuclear sublocalization of GFP-tagged CTBP2 protein (red) and counterstained with DAPI. Original magnification, 100×. (C) Analysis of cell proliferation using WST-1 analysis at the indicated time points. Cell growth relative to day 0 is presented. (D) Cells were seeded into semisolid methylcellulose medium and cultured for 7 days. Colony-forming ability relative to EV was determined (upper). Representative images of colony morphology under light microscope (lower). (E) Cell cycle distribution in CTBP2-transduced MM.1S and NCI-H929 cells was assessed by propidium iodide (PI) staining. Representative images of cell cycle distribution (left) and statistical analysis of percentages of cells in the Sub G1, G0/G1, S, and G2/M phases (right) are shown. (F) The percentage of cell death in MM.1S (top) and NCI-H929 (bottom) was measured on day 4 using annexin V staining assay. In panels C-F, results are expressed as mean ± standard deviation (SD) of triplicate measurements from at least 3 independent experiments. (G-K) NCI-H929 cells transduced with EV or CTBP2 were injected IV into NSG mice. (G) Bioluminescence imaging (BLI) was performed at the indicated time points and was adjusted to the same scale. (H) Myeloma burden as quantified by BLI in radiance. (I) Survival analysis using the log-rank test. (J) Detection of myeloma load 35 to 41 days after transplantation. The level of myeloma cells in xenografted animals was evaluated by hCD138 and hCD38 staining. (K) Presence of extramedullary plasmacytomas (EMD) and an enlarged kidney found during harvesting. Tumor images and quantification of tumor weight are shown.∗P < .05; ∗∗P < .01; ∗∗∗P < .001; ∗∗∗∗P < .0001; ns, not significant.
Restoration of CTBP2 elicits antimyeloma activity in vitro and in vivo. HMCLs were transduced with GFP empty vector control (EV) or CTBP2-overexpressing vector (CTBP2). Three days after transduction was assigned as day 0 for subsequent functional studies. (A) Stable overexpression of CTBP2 was confirmed using immunoblotting. β-actin served as the internal control. (B) Immunofluorescence study of transduced HMCLs showing nuclear sublocalization of GFP-tagged CTBP2 protein (red) and counterstained with DAPI. Original magnification, 100×. (C) Analysis of cell proliferation using WST-1 analysis at the indicated time points. Cell growth relative to day 0 is presented. (D) Cells were seeded into semisolid methylcellulose medium and cultured for 7 days. Colony-forming ability relative to EV was determined (upper). Representative images of colony morphology under light microscope (lower). (E) Cell cycle distribution in CTBP2-transduced MM.1S and NCI-H929 cells was assessed by propidium iodide (PI) staining. Representative images of cell cycle distribution (left) and statistical analysis of percentages of cells in the Sub G1, G0/G1, S, and G2/M phases (right) are shown. (F) The percentage of cell death in MM.1S (top) and NCI-H929 (bottom) was measured on day 4 using annexin V staining assay. In panels C-F, results are expressed as mean ± standard deviation (SD) of triplicate measurements from at least 3 independent experiments. (G-K) NCI-H929 cells transduced with EV or CTBP2 were injected IV into NSG mice. (G) Bioluminescence imaging (BLI) was performed at the indicated time points and was adjusted to the same scale. (H) Myeloma burden as quantified by BLI in radiance. (I) Survival analysis using the log-rank test. (J) Detection of myeloma load 35 to 41 days after transplantation. The level of myeloma cells in xenografted animals was evaluated by hCD138 and hCD38 staining. (K) Presence of extramedullary plasmacytomas (EMD) and an enlarged kidney found during harvesting. Tumor images and quantification of tumor weight are shown.∗P < .05; ∗∗P < .01; ∗∗∗P < .001; ∗∗∗∗P < .0001; ns, not significant.
We further investigated the impact of CTBP2 on MM in vivo. Luciferase-expressing NCI-H929 cells were transduced with EV or CTBP2 and infused IV into NSG mice. Illustrated by serial bioluminescence imaging, myeloma burden was substantially reduced in the CTBP2-overexpressing group compared with the control group (Figure 2G-H). Exogenous CTBP2 also prolonged the survival of recipient mice from 41 to 46 days (P = .003, Figure 2I) and suppressed the formation of extramedullary plasmacytomas and plasma cell infiltration into the BM and peripheral blood (Figure 2J). The development of plasmacytomas was largely abolished by CTBP2 (8 in the control group vs 1 in the CTBP2 group, P = .002; Figure 2J-K). Similarly, CTBP2 reduced myeloma growth in a subcutaneous xenograft model (supplemental Figure 6A-B). Collectively, these results strongly indicate a tumor-suppressive role for CTBP2 in MM pathogenesis.
CTBP2 represses the MYC-IRF4 axis in MM
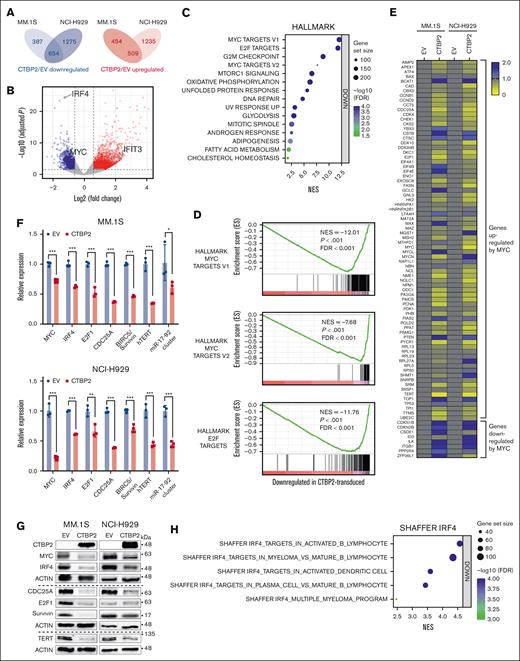
We next performed RNA-sequencing to uncover global transcriptome changes induced by CTBP2 in MM. Of the 1 163 genes commonly altered in CTBP2-transduced MM.1S and NCI-H929 cells, 654 were downregulated and 509 were upregulated (adjusted P value <.05; absolute fold change >1.5, Figure 3A-B). Gene set enrichment analysis (GSEA) using MSigDB Hallmark gene sets revealed that MYC, E2F, and G2/M checkpoint genes were the most downregulated pathways (P < .001; false discovery rate <0.001; Figure 3C-D). It is well established that the G1/S transition requires cooperation between MYC and E2F activities.24-26 Therefore, our GSEA findings suggest the repression of G1/S checkpoint genes by CTBP2 in MM, consistent with the observed G0/G1 cell cycle arrest (Figure 2E). GSEA was extended to the entire set of gene signatures available from MSigDB and confirmed the significant repression of MYC- and E2F-related gene sets (supplemental Tables 3 and 4). Further enrichment analyses using Gene Ontology Biological Process and Kyoto Encyclopedia of Genes and Genomes pathways confirmed that MYC/E2F-regulated biological processes, including DNA replication, the cell cycle, and DNA repair, were highly repressed (supplemental Figure 7A-B). Concordantly, overexpression of CTBP2 suppressed MYC in vivo (supplemental Figure 8). Moreover, the expression of CTBP2 and MYC was inversely correlated in independent patient cohorts with MM and prominent repression of MYC/E2F gene sets was demonstrated when patients with UAMS were stratified into CTBP2high and CTBP2low groups (supplemental Figure 9A-B). In agreement with Figure 1F, GSEA confirmed significant repression of genes overexpressed in the molecular PR subgroup (supplemental Figure 10). In contrast, other pathways implicated in MM pathogenesis were not significantly modulated (supplemental Table S5), indicating a specific perturbation of MYC signaling by CTBP2 in MM.
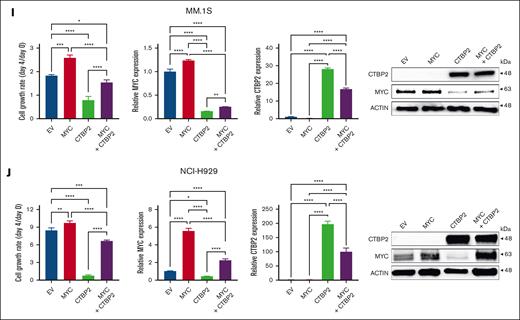
CTBP2 represses MYC-IRF4 transcriptional network in MM. (A-B) Differentially expressed genes (DEGs) after CTBP2 transduction in MM.1S and NCI-H929 cells. Genes with an absolute fold change >1.5 and adjusted-P < .05 relative to control cells were included. (A) Venn diagram of DEGs showing the number of overlap and unique genes in HMCL. (B) Volcano plots illustrating common DEGs upon CTBP2 transduction. Red dots indicate upregulated genes and blue dots indicate downregulated genes. Important downstream targets of CTBP2 were labeled with gene symbols and chosen for further study. (C) GSEA of hallmark gene sets ranked by normalized enrichment scores. Bubble plot showing top gene sets with downregulated patterns with false discovery rate (FDR) <0.05. The size and color of each bubble represent the number of DEGs in each pathway and the FDR, respectively. (D) GSEA showing downregulation of MYC and E2F hallmark gene sets upon CTBP2 transduction in MM. (E) Gene expression profiling of MYC and MYC-dependent genes (n = 83) in transduced MM cells with the MYC target PCR array. Change in gene expression was calculated using the ΔΔCt method. Yellow, relatively low expression; blue, relatively high expression. (F) Transcript levels of MYC and its targets evaluated by real-time quantitative polymerase chain reaction. GAPDH served as the reference gene. (G) Immunoblotting analysis illustrating the downregulation of MYC and its targets in CTBP2-transduced MM cells compared with EV. β-actin served as the internal control. (H) GSEA of the previously described IRF4 gene sets. Bubble plot showing downregulation of IRF4 targets upon CTBP2 transduction. All pathways with FDR <0.001. (I-J) Exogenous expression of MYC rescued MM cells from CTBP2-induced growth inhibition in (I) MM.1S and (J) NCI-H929 cells, as shown by (from left to right) WST-1 assay showing cell growth at day 4 relative to day 0, and transduction efficiency for MYC and CTBP2 demonstrated at the mRNA and protein levels. In panels F,I,J, results are expressed as mean ± SD of triplicate measurements from at least 3 independent experiments. ∗P < .05; ∗∗P < .01; ∗∗∗P < .001; ∗∗∗∗P < .0001.
CTBP2 represses MYC-IRF4 transcriptional network in MM. (A-B) Differentially expressed genes (DEGs) after CTBP2 transduction in MM.1S and NCI-H929 cells. Genes with an absolute fold change >1.5 and adjusted-P < .05 relative to control cells were included. (A) Venn diagram of DEGs showing the number of overlap and unique genes in HMCL. (B) Volcano plots illustrating common DEGs upon CTBP2 transduction. Red dots indicate upregulated genes and blue dots indicate downregulated genes. Important downstream targets of CTBP2 were labeled with gene symbols and chosen for further study. (C) GSEA of hallmark gene sets ranked by normalized enrichment scores. Bubble plot showing top gene sets with downregulated patterns with false discovery rate (FDR) <0.05. The size and color of each bubble represent the number of DEGs in each pathway and the FDR, respectively. (D) GSEA showing downregulation of MYC and E2F hallmark gene sets upon CTBP2 transduction in MM. (E) Gene expression profiling of MYC and MYC-dependent genes (n = 83) in transduced MM cells with the MYC target PCR array. Change in gene expression was calculated using the ΔΔCt method. Yellow, relatively low expression; blue, relatively high expression. (F) Transcript levels of MYC and its targets evaluated by real-time quantitative polymerase chain reaction. GAPDH served as the reference gene. (G) Immunoblotting analysis illustrating the downregulation of MYC and its targets in CTBP2-transduced MM cells compared with EV. β-actin served as the internal control. (H) GSEA of the previously described IRF4 gene sets. Bubble plot showing downregulation of IRF4 targets upon CTBP2 transduction. All pathways with FDR <0.001. (I-J) Exogenous expression of MYC rescued MM cells from CTBP2-induced growth inhibition in (I) MM.1S and (J) NCI-H929 cells, as shown by (from left to right) WST-1 assay showing cell growth at day 4 relative to day 0, and transduction efficiency for MYC and CTBP2 demonstrated at the mRNA and protein levels. In panels F,I,J, results are expressed as mean ± SD of triplicate measurements from at least 3 independent experiments. ∗P < .05; ∗∗P < .01; ∗∗∗P < .001; ∗∗∗∗P < .0001.
To corroborate our transcriptome data, we performed an expression analysis of MYC signature genes in CTBP2- or EV-transduced MM.1S and NCI-H929 cells using the Human MYC RT2 Profiler PCR array (PAHS-177Z). In concert with RNA-sequencing data, CTBP2 downregulated genes known to be activated by MYC and induced the expression of genes repressed by MYC (Figure 3E). Further demonstrated by real-time quantitative polymerase chain reaction (RQ-PCR) and immunoblotting, CTBP2 repressed MYC transcriptional targets involved in MM pathogenesis, including key myeloma factors IRF4,2 CDC25A,27,28 BIRC5/Survivin,29 hTERT,30,31 and the miR-17 to 92 cluster32,33 (Figure 3F-G). Consistently, IRF4 signaling genes were significantly downregulated by CTBP2 (Figure 3H). Immunofluorescence analysis confirmed the depletion of the nuclear proteins MYC and IRF4 in CTBP2-transduced cells (supplemental Figure 11A-D), indicating that CTBP2 strongly suppressed the downstream expression of the MYC-IRF4 autoregulatory circuit. Finally, rescue experiment showed that enforced MYC expression partially abrogated CTBP2-induced cell growth inhibition in both MYC-expressing and MYC-depleted HMCLs (Figure 3I-J; supplemental Figure 12A-B), indicating their functionally antagonistic relationship and supporting that antimyeloma activity of CTBP2 is mediated via MYC/IRF4 suppression.
CTBP2 represses MYC and IRF4 via H3K27 deacetylation in MM
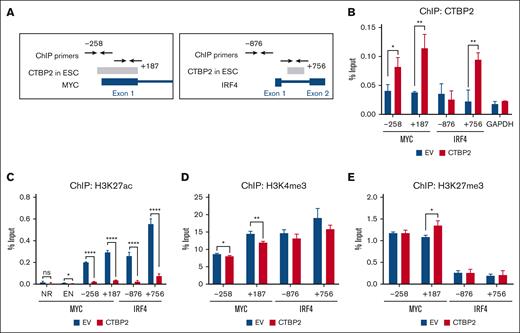
CTBP2 has been reported to modulate transcription via the direct binding and recruitment of chromatin modifiers.12,13,34 The ENCODE data curated putative CTBP2 binding at the MYC and IRF4 gene loci in human embryonic stem cells (ESC) (Figure 4A).35 To test whether CTBP2 is directly recruited to loci of MYC and IRF4, we performed chromatin immunoprecipitation-PCR spanning the putative binding regions. Accordingly, we found that CTBP2 bound to these genomic regions in NCI-H929 cells (Figure 4B). We next evaluated whether CTBP2 regulated histone modifications in these regions. Levels of the active transcription mark histone H3 lysine 27 acetylation (H3K27ac) were significantly reduced at both MYC and IRF4 promoters in CTBP2-overexpressing cells when compared with the control (Figure 4C). In contrast, effects on another active transcription mark, histone H3 lysine 4 tri-methylation (H3K4me3) (Figure 4D) and repressive histone H3 lysine 27 tri-methylation (H3K27me3) (Figure 4E) were modest. Similar results were observed in CTBP2-overexpressing MM.1S cells (supplemental Figure 13A-C). These data indicated that CTBP2 represses MYC and IRF4 mainly through H3K27 deacetylation in MM.
CTBP2 reduces H3K27ac binding to MYC and IRF4 promoters in MM. (A) The Txn Factor chromatin immunoprecipitation (ChIP) track displaying CTBP2 binding sites (gray bars) on (left) MYC and (right) IRF4 loci in human ESC from the ChIP-seq data of the ENCODE project. ChIP-PCR primers were labeled with respect to their distance to the transcription start site , which was denoted as +1. (B-E) After CTBP2 transduction in NCI-H929 cells, ChIP-PCR was performed to show the (B) occupancy of CTBP2 and enrichment of (C) H3K27ac, (D) H3K4me3, and (E) H3K27me3 at the enhancer (EN) region, first exon of MYC, and the promoter and first intron of IRF4. The regions analyzed were labeled with respective to their distance from the transcription start site. GAPDH promoter and noncoding (NR) region served as a negative control. The results are expressed as the mean ± SD of triplicate measurements from at least 3 independent experiments. ∗P < .05; ∗∗P < .01; ∗∗∗∗P < .0001.
CTBP2 reduces H3K27ac binding to MYC and IRF4 promoters in MM. (A) The Txn Factor chromatin immunoprecipitation (ChIP) track displaying CTBP2 binding sites (gray bars) on (left) MYC and (right) IRF4 loci in human ESC from the ChIP-seq data of the ENCODE project. ChIP-PCR primers were labeled with respect to their distance to the transcription start site , which was denoted as +1. (B-E) After CTBP2 transduction in NCI-H929 cells, ChIP-PCR was performed to show the (B) occupancy of CTBP2 and enrichment of (C) H3K27ac, (D) H3K4me3, and (E) H3K27me3 at the enhancer (EN) region, first exon of MYC, and the promoter and first intron of IRF4. The regions analyzed were labeled with respective to their distance from the transcription start site. GAPDH promoter and noncoding (NR) region served as a negative control. The results are expressed as the mean ± SD of triplicate measurements from at least 3 independent experiments. ∗P < .05; ∗∗P < .01; ∗∗∗∗P < .0001.
CTBP2 upregulates interferon signaling in MM
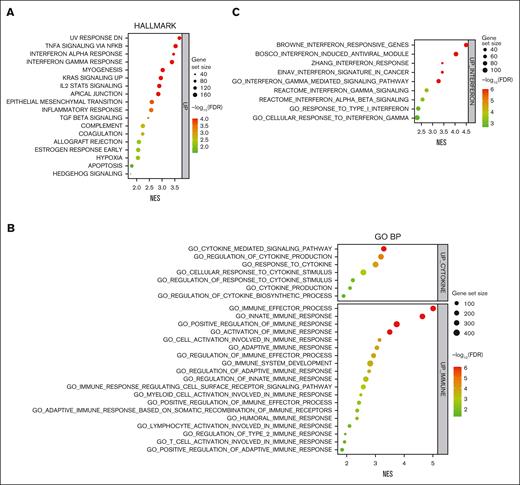
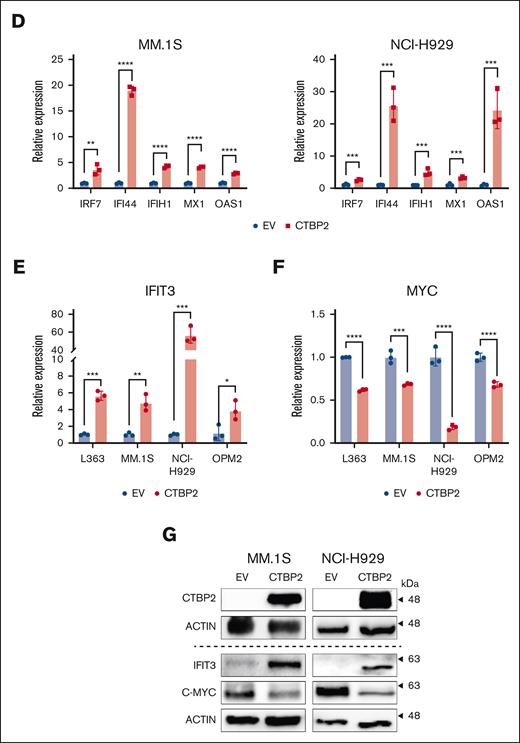
In addition to the direct tumor suppressive effect on the MYC-IRF4 axis, GSEA using Hallmark collection revealed upregulation of immune gene sets, including interferon (IFN) alpha/gamma and inflammatory responses by CTBP2 in MM (Figure 5A). Gene Ontology Biological Process analysis also demonstrated the activation of genes related to cytokine production and immune-related responses (Figure 5B). Extended enrichment analysis confirmed the upregulation of IFN gene sets (Figure 5C), suggesting that CTBP2 works similarly to other MYC inhibitors.36,37 Using RQ-PCR, we validated the upregulation of several interferon-stimulated genes (ISGs), including IFI44, IFIH1, MX1, and OAS1, in both MM.1S and NCI-H929 cells (Figure 5D). Significant upregulation of IRF7, the master regulator of type-I interferon-dependent immune response, was also noted (Figure 5D).38
CTBP2 activates interferon pathway genes in MM. (A-C) GSEA of transcriptome data for hallmark gene sets (A), Gene Ontology Biological Process (GO BP) (B), and interferon pathway gene sets (C) ranked by normalized enrichment scores. Bubble plot showing the top gene sets upregulated by CTBP2 with FDR <0.05. Size and color of each bubble represent the number of DEGs in each pathway and the FDR, respectively. (D-G) After overexpression of CTBP2, the expression of ISGs (D), IFIT3 (E), and MYC (F) in HMCLs was evaluated by RQ-PCR. GAPDH served as the loading control. (G) Immunoblotting analysis of IFIT3 and MYC. β-actin served as the loading control. In panels D-F, results are expressed as the mean ± SD of triplicate measurements from at least 3 independent experiments. ∗P < .05; ∗∗P < .01; ∗∗∗P < .001, ∗∗∗∗P < .0001.
CTBP2 activates interferon pathway genes in MM. (A-C) GSEA of transcriptome data for hallmark gene sets (A), Gene Ontology Biological Process (GO BP) (B), and interferon pathway gene sets (C) ranked by normalized enrichment scores. Bubble plot showing the top gene sets upregulated by CTBP2 with FDR <0.05. Size and color of each bubble represent the number of DEGs in each pathway and the FDR, respectively. (D-G) After overexpression of CTBP2, the expression of ISGs (D), IFIT3 (E), and MYC (F) in HMCLs was evaluated by RQ-PCR. GAPDH served as the loading control. (G) Immunoblotting analysis of IFIT3 and MYC. β-actin served as the loading control. In panels D-F, results are expressed as the mean ± SD of triplicate measurements from at least 3 independent experiments. ∗P < .05; ∗∗P < .01; ∗∗∗P < .001, ∗∗∗∗P < .0001.
IFIT3 is another ISG that caught our attention. In our transcriptome data, IFIT3 was among the top upregulated genes (fold change: 4.99; adjusted P = 1.5E−5) upon overexpression of CTBP2 and was previously shown to downregulate MYC in acute myeloid leukemia and MM.39,40 As expected, CTBP2 induced upregulation of IFIT3 and downregulation of MYC at both the RNA and protein levels in HMCLs (Figure 5E-G). Taken together, these observations suggest a potential immunomodulatory role of CTBP2 in MM by activating IFN responses. In addition to its direct impact on MYC transcription via histone modification, CTBP2 may repress MYC indirectly by upregulating interferon-stimulated IFIT3.
Reactivation of epigenetically silenced CTBP2 in MM
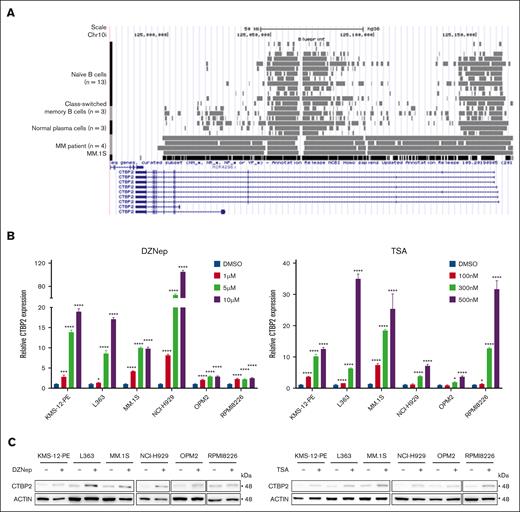
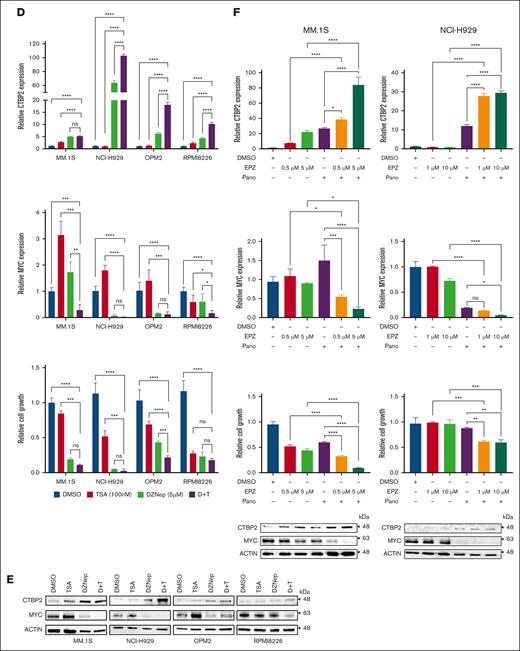
Because CTBP2 mutations or copy number variations were infrequent in both patients with MM and cell lines (supplemental Figure 14A-C), we sought to explore whether the transcription of CTBP2 is under epigenetic control. BLUEPRINT epigenomic data revealed enrichment of transcriptional repressive H3K27me3 across the CTBP2 gene body in primary MM but not in normal B cells or plasma cells (Figure 6A), suggesting that CTBP2 silencing is polycomb-mediated.41 Supporting this, we observed dose-dependent reactivation of CTBP2 expression by 3-Deazaneplanocin A (DZNep),42 an inhibitor of histone methyltransferase EZH2 (EZH2i), in all 7 HMCLs tested (Figure 6B-C). EZH2 is also known to interact with HDACs and DNMTs in regulating gene expression.43 Accordingly, CTBP2 expression was restored in a dose-dependent manner by the pan-HDACi TSA (Figure 6B-C).44 Combined treatment with DZNep and TSA enhanced CTBP2 restoration, along with augmented antimyeloma activity and MYC repression (Figure 6D-E). These results were reproduced by the clinically relevant drugs EPZ-6438 and panobinostat (Figure 6F). Tazemetostat (EPZ-6438) has demonstrated single-agent antimyeloma activity in preclinical studies and is currently being evaluated in phase 2 clinical trials for non-Hodgkin lymphoma.45 Panobinostat (LBH589) is an oral pan-HDAC approved for third-line treatment of MM.46 Concordantly, combined EZH2i/HDACi treatment also upregulated ISGs that were activated by CTBP2 (supplemental Figure 15A-B), in keeping with a regulatory role of CTBP2 in IFN signaling. More importantly, concomitant depletion of CTBP2 counteracted the intended growth inhibitory effect of the combinatory treatments (supplemental Figure 16A-B), indicating the specific contribution of CTBP2 reactivation to EZH2i/HDACi-mediated cytotoxicity in MM.
Reactivation of CTBP2 expression by EZH2i and HDACi in MM. (A) Integration of ChIP-seq data from the BLUEPRINT Consortium and the ENCODE project in the UCSC genome browser for H3K27me3 levels around the CTBP2 locus at the stages of NPC development and MM. (B-C) Restoration of CTBP2 expression in HMCLs. (B) RQ-PCR of HMCLs treated with a serial dose of DZNep or TSA. GAPDH served as an internal control. Ordinary 1-way ANOVA followed by Dunnett multiple comparison test. (C) Immunoblotting of HMCLs treated with (left) DZNep at 10 μM and (right) TSA at 500 nM. β-actin served as the loading control. (D-F) HMCLs were treated with a single agent or combination of EZH2i and/or HDACi. Expression of CTBP2 (upper) and MYC (middle) as evaluated by RQ-PCR and cell proliferation (lower) using the CellTiter-Glo assay. Ordinary 1-way ANOVA followed by Tukey multiple comparison test. (D-E) MM.1S, NCI-H929, OPM2, and RPMI8226 were treated with DZNep and/or TSA at indicated dose. Expression changes in CTBP2 and MYC are illustrated by (D) RQ-PCR and (E) immunoblotting. (F) Treatment of EPZ-6438 (EPZ) at the indicated dose and/or panobinostat (Pano) at 10 nM in MM.1S and NCI-H929. Expression changes in CTBP2 and MYC are illustrated by (upper) RQ-PCR and (lower) immunoblotting. The results are expressed as the mean ± SD of triplicate measurements from at least 3 independent experiments. ∗P < .05; ∗∗P < .01; ∗∗∗P < .001, ∗∗∗∗P < .0001; ns, not significant.
Reactivation of CTBP2 expression by EZH2i and HDACi in MM. (A) Integration of ChIP-seq data from the BLUEPRINT Consortium and the ENCODE project in the UCSC genome browser for H3K27me3 levels around the CTBP2 locus at the stages of NPC development and MM. (B-C) Restoration of CTBP2 expression in HMCLs. (B) RQ-PCR of HMCLs treated with a serial dose of DZNep or TSA. GAPDH served as an internal control. Ordinary 1-way ANOVA followed by Dunnett multiple comparison test. (C) Immunoblotting of HMCLs treated with (left) DZNep at 10 μM and (right) TSA at 500 nM. β-actin served as the loading control. (D-F) HMCLs were treated with a single agent or combination of EZH2i and/or HDACi. Expression of CTBP2 (upper) and MYC (middle) as evaluated by RQ-PCR and cell proliferation (lower) using the CellTiter-Glo assay. Ordinary 1-way ANOVA followed by Tukey multiple comparison test. (D-E) MM.1S, NCI-H929, OPM2, and RPMI8226 were treated with DZNep and/or TSA at indicated dose. Expression changes in CTBP2 and MYC are illustrated by (D) RQ-PCR and (E) immunoblotting. (F) Treatment of EPZ-6438 (EPZ) at the indicated dose and/or panobinostat (Pano) at 10 nM in MM.1S and NCI-H929. Expression changes in CTBP2 and MYC are illustrated by (upper) RQ-PCR and (lower) immunoblotting. The results are expressed as the mean ± SD of triplicate measurements from at least 3 independent experiments. ∗P < .05; ∗∗P < .01; ∗∗∗P < .001, ∗∗∗∗P < .0001; ns, not significant.
Bisulfite sequencing further demonstrated hypermethylation of the CTBP2 promoter region in HMCLs, with significantly higher methylation levels in cytosine guanine dinucleotide island 1 (CGI-1) (supplemental Figure 17A). Methylation-sensitive high-resolution melting demonstrated that a small subset of patients with MM (9/154, 5.8%) showed partial or high methylation of CGI-1 (supplemental Figure 17B). Patients with hypermethylated CTBP2 status were associated with inferior clinical features, including younger age at diagnosis, aggressive immunoglobulin D myeloma, higher lactate dehydrogenase levels, BM plasma cells, and 1q21 amplification (supplemental Table 6). The latter 2 associations were also observed in patients with lower CTBP2 expression in the IA11 data set (Table 1).
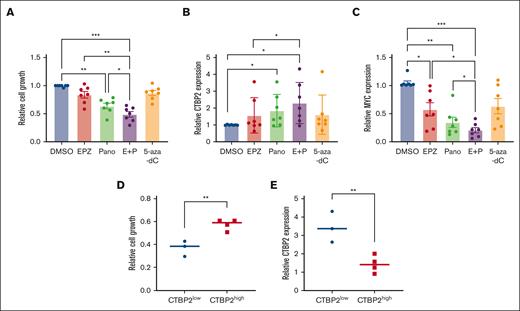
Combined EZH2i/HDACi treatment demonstrated superior antimyeloma activities compared with single agents, with concomitant upregulation of CTBP2 and suppression of MYC in primary CD138+ MM cells (Figure 7A-C). Notably, patients with low baseline CTBP2 expression exhibited higher sensitivity to combined drug treatment and more pronounced restoration of CTBP2 than the CTBP2high group (Figure 7D-E). Consistent with the infrequent CTBP2 promoter hypermethylation observed in patients with MM (supplemental Figure 17B), DNMTi showed insignificant effects on the samples tested.
Treatment with EZH2i/HDACi/DNMTi reactivated CTBP2 and suppressed MYC expression in primary MM cells. The CD138+ cells isolated from patients with MM (n = 7) were treated with EPZ-6438 (EPZ) at 5 μM, Panobinostat (Pano) at 5 nM, alone or in combination (E+P), and 5-Aza-2’-deoxycytidine (5-Aza-dC) at 10 μM for 48 hours. Dimethyl sulfoxide was used as a control treatment. Effect of epigenetic agents on primary MM samples on (A) cell growth as measured by the CellTiter-Glo assay, and mRNA expression of (B) CTBP2 and (C) MYC was detected by RQ-PCR with GAPDH as a loading control. (D-E) Patients were equally categorized into the CTBP2low and CTBP2high groups based on their baseline CTBP2 expression. The effects of dual EZH2i/HDACi treatment between the 2 groups were compared for their (D) sensitivity to drug treatment as measured by the CellTiter-Glo assay, and (E) expression of CTBP2 as detected by RQ-PCR with GAPDH as a loading control. In panels A-C, the error bars represent the SD of the 3 technical replicates. ∗P < .05; ∗∗P < .01; ∗∗∗P < .001, ∗∗∗∗P < .0001. DMSO, dimethyl sulfoxide.
Treatment with EZH2i/HDACi/DNMTi reactivated CTBP2 and suppressed MYC expression in primary MM cells. The CD138+ cells isolated from patients with MM (n = 7) were treated with EPZ-6438 (EPZ) at 5 μM, Panobinostat (Pano) at 5 nM, alone or in combination (E+P), and 5-Aza-2’-deoxycytidine (5-Aza-dC) at 10 μM for 48 hours. Dimethyl sulfoxide was used as a control treatment. Effect of epigenetic agents on primary MM samples on (A) cell growth as measured by the CellTiter-Glo assay, and mRNA expression of (B) CTBP2 and (C) MYC was detected by RQ-PCR with GAPDH as a loading control. (D-E) Patients were equally categorized into the CTBP2low and CTBP2high groups based on their baseline CTBP2 expression. The effects of dual EZH2i/HDACi treatment between the 2 groups were compared for their (D) sensitivity to drug treatment as measured by the CellTiter-Glo assay, and (E) expression of CTBP2 as detected by RQ-PCR with GAPDH as a loading control. In panels A-C, the error bars represent the SD of the 3 technical replicates. ∗P < .05; ∗∗P < .01; ∗∗∗P < .001, ∗∗∗∗P < .0001. DMSO, dimethyl sulfoxide.
We further explored whether epigenetic agents targeted MM cells via CTBP2 in vivo. Our data revealed a decrease in plasma cell infiltration, along with increased CTBP2 levels and downregulation of MYC in extramedullary plasmacytomas in the epidrug-treated groups (supplemental Figure 18A-B). Notably, CTBP2 expression was found to be inversely correlated with plasma cell infiltration levels within the tumors (supplemental Figure 18C), further highlighting its tumor-suppressive role in MM.
Collectively, these data highlight that inactivation of CTBP2 in MM is controlled by multiple epigenetic machineries. Pharmacological upregulation of CTBP2 by dual EZH2i/HDACi is largely applicable in most MM, and findings of CTBP2 promoter hypermethylation in patient subgroups may rationalize the beneficial use of demethylating agents, as demonstrated in KMS-12-PE and NCI-H929 cells (supplemental Figure 17C).
Discussion
In this study, we showed that CTBP2 elicits tumor-suppressive functions via the MYC-IRF4 axis, thereby attenuating MM cell growth and survival. The CTBP family is well recognized for its recruitment of >30 transcription factors to repress distinct downstream targets.47,48 Its context-dependent behavior has been indicated in the Drosophila model, in which it exhibits dual roles in the Wnt pathway.49 In human, CTBP2 promotes tumorigenesis via modulation of the Wnt/β-catenin pathway through different interacting partners in esophageal squamous cell cancer and nonsmall cell lung cancer,50,51 whereas no marked effect on Wnt signaling genes was observed in MM (supplemental Table 5). Low CTBP2 expression has recently been reported to be associated with adverse outcome in B-ALL.52,53 These data substantiate the differential role of CTBP2 in MM and solid tumors, potentially dictated by cell-type-specific interactions with diversified partner proteins, hence resulting in different molecular sequelae.54
Using independent public data sets comprising 1 262 newly diagnosed and relapsed patients with MM, low CTBP2 level was found to confer poor OS and adverse clinical features, including a hyperproliferative gene signature. However, CTBP2 expression did not correlate with progression-free survival in both IA11 and APEX trials, which could be attributed to heterogeneous treatment modalities in the cohorts. When performing multivariate analysis in IA11 with major prognostic factors, such as beta-2-microglobulin and albumin levels, CTBP2 alone was not an independent prognosticator for MM but only a marker of adverse disease at presentation. Further large-scale and uniformly-treated patient cohorts with extensive clinical and genomic/cytogenetic data are required to confirm the observations.
Similar to pharmacological suppression or knockdown of MYC and/or IRF4,36,37,55-57 restoration of CTBP2 triggered growth inhibition via G0/G1 cell cycle arrest and apoptosis in MM. Although contrary findings in which CTBP2 inhibition was shown to decrease MYC in PC3 prostate cancer cells and SHSY5Y neuroblastoma cells,58,59 observations in both studies were only based on a single cell line model without further elucidation of the mechanisms downstream of MYC repression. Nevertheless, it has been speculated that CTBP2 plays a dual role in regulating MYC, as previously discussed. Unlike other transcriptional corepressors, such as MMSET and KAP1, which are only implicated in t(4;14) myeloma,8,60 antiproliferative activity and repression of MYC by CTBP2 were observed across HMCLs harboring diversified genetic/cytogenetic lesions that are thought to cause MYC overexpression,61 indicating that CTBP2 silencing represents an additional and predominant mechanism driving MYC activation in this genetically heterogeneous blood cancer.4 Furthermore, the tumor-suppressive effect of CTBP2 was also demonstrated in the MYC-depleted U266 cell line with concomitant downregulation of IRF4, suggesting that, apart from MYC-dependent mechanisms, CTBP2 also elicited anti-MM activity via MYC-independent pathways.
Our data suggested that only CTBP2 is silenced in MM but not in its paralog, CTBP1. Although they share similar structural homology, the 2 family members are differentially regulated and perform unique functions, contributed mainly by the exclusive presence of the nuclear localization sequence in CTBP2.62,63 Functional differences were described in embryogenesis, in which CtBP2-null embryos exhibited axial truncations and died by E10.5 but CtBP1-null mice remained viable, indicating their specific and different in vivo functions during development.64 A large-scale interactome study suggested the potential involvement of CTBP2 but not CTBP1, in suppressing lymphoid tumors, as reflected by its exclusive deletion in malignant lymphoid cells.65 Together with their differential interactions with cofactors,66 these structural and functional differences may address the distinct contribution of CTBP2 but not CTBP1, to MM pathobiology.
The CTBP corepressor complex has been shown to regulate gene expression through direct binding and histone modifications at bound sites.12,13,34,67 Accordingly, we found that CTBP2 binds to the MYC and IRF4 loci in NCI-H929 cells, the same binding region shown in the human ESC line (H1-hESC) in Encyclopedia of DNA Elements (ENCODE).35 We also illustrated that the overexpressing CTBP2 reduced H3K27 acetylation at the MYC and IRF4 gene loci. The transcriptional repressive function of CTBP2 was shown to be dependent on its direct interaction with HDAC1/2 via the PLDLS-binding motif and histone deacetylation, such as H3K27, by the nucleosome remodeling and deacetylase complex.66-68 It is tempting to speculate the participation of CTBP2 in the HDAC-dependent machinery to regulate MYC/IRF4, which warrants further coimmunoprecipitation studies to delineate CTBP2 binding partners and chromatin immunoprecipitation-sequencing experiments to detect genome-wide changes induced by CTBP2 in MM.
The antimyeloma activities of interferons have long been recognized since the 1980s.69 Here, CTBP2 was shown to induce immune and interferon gene signature in MM. Such activation has also been reported in other studies of MYC inhibitors,36,37 indicating a similar mechanism of action for targeting MM. IRF4 depletion was shown to elevate the expression of IFI44 and IRF7, in which the latter is the master regulator of type I-interferon,70-72 indicating that upregulation of certain ISGs could be a sequential effect of CTBP2 disruption on the MYC-IRF4 axis. The precise mechanism underlying the activation of interferon pathways and the immunomodulatory effects of CTBP2 in MM remains to be explored.
Instead of genetic aberrations, we unveiled that CTBP2 is epigenetically inactivated by multiple mechanisms, including histone methylation/deacetylation and promoter methylation. Compared with single agents, dual EZH2i/HDACi demonstrated superior anti-MM activities, resulting in augmented CTBP2 activation, MYC repression, and growth inhibition in MM cell lines, primary MM samples, and xenograft models. Harding et al reported that EPZ-6438 and panobinostat downregulate MYC/IRF4 via an unclear mechanism.73 The decreased susceptibility of siCTBP2-treated cells to EZH2i/HDACi indicated the specific involvement of CTBP2, at least in part, in mediating epidrug-induced antimyeloma activity. Given the observation that patients with low CTBP2 displayed higher sensitivity to epigenetic treatments, CTBP2 expression status could potentially be used as a useful biomarker to guide epigenetic-based therapies. Larger studies are warranted to confirm this observation.
We also showed the promoter methylation of CTBP2 and its re-expression by a demethylating agent in MM. The CTBP2 methylation frequency in patients with MM is likely underestimated because retrospective CD138-unsorted samples were used in methylation-sensitive high-resolution melting analysis. Although only observed in a small subset of patients, the CTBP2 methylation status correlated with adverse clinical parameters, which was also observed in the IA11 cohort. Methylation of CTBP2 intron 1 has also been reported in naïve B-cell-like chronic lymphocytic leukemia with poor prognosis.74,75
To the best of our knowledge, this is the first study to demonstrate CTBP2 as a tumor suppressor targeting the critical MYC-IRF4 axis and activating the immune/interferon pathways. In addition to its direct impact on MYC and IRF4 transcription via H3K27 deacetylation, CTBP2 also repressed MYC indirectly through IFIT3, providing new insights into the mechanisms underlying MYC-IRF4 activation in MM. Widespread restoration of CTBP2 by EZH2i/HDACi in vitro, ex vivo, and in vivo revealed that epigenetic modifications, predominantly histone methylation/deacetylation, downregulate CTBP2 in MM. Reactivation of CTBP2 has emerged as a novel mediating pathway, contributing to the broad therapeutic effects of EZH2i/HDACi in MM. Our study provides additional evidence to support the clinical evaluation of dual EZH2i/HDACi treatment and the development of novel CTBP2-based therapeutics to selectively target the MYC-IRF4 axis to improve the clinical outcomes of this incurable neoplasm.
Acknowledgments
The authors thank Kin-Mang Lau for his advice and the Core Utilities of Cancer Genomics and Pathobiology (Chinese University of Hong Kong) for providing facilities and assistance in support of this research.
The work was partially supported by a grant from the General Research Fund program sponsored by the Research Grants Council in Hong Kong (CUHK M14108719).
Authorship
Contribution: C.H.Y.C. designed and performed the research and wrote the manuscript; C.Z., C.Y.H., X.L., A.Y.F.K., T.X., T.S.K.W., and H.P. performed the research and collected and analyzed the data; N.P.H.C., J.S.C., and R.S.M.W. collected and analyzed the clinical data; X.-B.Z. provided technical support; C.K.C., K.T.L., and M.H.L.N. designed the research and advised on revision of the manuscript; and all authors read and approved the final manuscript.
Conflict-of-interest disclosure: The authors declare no competing financial interests.
Correspondence: Margaret H. L. Ng, Blood Cancer Cytogenetics and Genomics Laboratory, Department of Anatomical and Cellular Pathology, Prince of Wales Hospital, The Chinese University of Hong Kong, Shatin, New Territories, Hong Kong SAR, China; email: margaretng@cuhk.edu.hk.
References
Author notes
RNA-seq data are deposited at https://www.ncbi.nlm.nih.gov/geo/ under accession number GSE255266.
Data are available on request from the corresponding author, Margaret H. L. Ng (margaretng@cuhk.edu.hk).
The full-text version of this article contains a data supplement.

