

Key Points
Sequencing-based karyotyping can challenge conventional karyotyping for ELN-based prognostication of acute myeloid leukemia.
Next-generation karyotyping increases precision for ELN-defining gene alterations but warrants special caution for lowly expressed fusions.

Abstract
Although copy number alterations (CNAs) and translocations constitute the backbone of the diagnosis and prognostication of acute myeloid leukemia (AML), techniques used for their assessment in routine diagnostics have not been reconsidered for decades. We used a combination of 2 next-generation sequencing–based techniques to challenge the currently recommended conventional cytogenetic analysis (CCA), comparing the approaches in a series of 281 intensively treated patients with AML. Shallow whole-genome sequencing (sWGS) outperformed CCA in detecting European Leukemia Net (ELN)–defining CNAs and showed that CCA overestimated monosomies and suboptimally reported karyotype complexity. Still, the concordance between CCA and sWGS for all ELN CNA–related criteria was 94%. Moreover, using in silico dilution, we showed that 1 million reads per patient would be enough to accurately assess ELN-defining CNAs. Total genomic loss, defined as a total loss ≥200 Mb by sWGS, was found to be a better marker for genetic complexity and poor prognosis compared with the CCA-based definition of complex karyotype. For fusion detection, the concordance between CCA and whole-transcriptome sequencing (WTS) was 99%. WTS had better sensitivity in identifying inv(16) and KMT2A rearrangements while showing limitations in detecting lowly expressed PML-RARA fusions. Ligation-dependent reverse transcription polymerase chain reaction was used for validation and was shown to be a fast and reliable method for fusion detection. We conclude that a next-generation sequencing–based approach can replace conventional CCA for karyotyping, provided that efforts are made to cover lowly expressed fusion transcripts.
Introduction
With an incidence rate ∼4 new cases per 100 000 inhabitants yearly, acute myeloid leukemia (AML) represents one third of diagnosed leukemias and ∼1% of all cancers.1 Diagnosis is established from a bone marrow smear showing >20% blasts and/or by detection of AML-specific gene fusions.2 With the exception of t(15;17)(q22~24;q12~21) confirming acute promyelocytic leukemias (APLs) suitable for highly specific and effective treatment,3 molecular characterization of AML has historically been informative for patient care relatively late in the clinical process, as a tool to select candidates for allogeneic cell transplantation.2 With new targeted treatments and the introduction of effective nonchemotherapeutic alternatives, early information on mutations in genes such as FLT3, IDH, and TP53 has become valuable for early treatment choices.2
The genetic characterization of AML has historically been performed by conventional cytogenetic analysis (CCA), consisting of microscopic observation of chromosome rearrangements and aneuploidies in metaphase stage. Although offering a pangenomic view of aberrations, this technique comes with several drawbacks, such as a time-consuming and prone-to-failure cell-culturing step,4 a maximal resolution between 5 and 7 Mbp,5 and a visual interpretation that is dependent on staff experience and knowledge of the disease.
Alternatives to this standard have been proposed but have failed to replace CCA in international recommendations.2 Regarding copy number alterations (CNAs), comparative genomic hybridization and single-nucleotide polymorphism arrays have demonstrated 1000-fold higher resolution, at the price of blindness toward balanced or subclonal rearrangements.6-8 Reverse transcription polymerase chain reaction (RT-PCR) panels have shown sensitivity improvements with regard to gene fusions, while missing the pangenomic feature of CCA.9 RNA sequencing–based panels have made target multiplexing virtually unlimited while losing sensitivity10 and cost efficiency. A step further toward exhaustivity, several tools infer gene fusions from whole-transcriptome RNA sequencing (WTS),11 however bringing many new findings of questionable significance.12 Fluorescence in-situ hybridization (FISH) panels are often used as a complement to CCA for translocations but can also challenge it for CNAs and address some of its drawbacks.13-16
The last 10 years of development in the genetic characterization of AML has shown the importance of somatic mutations,2,17 especially in patients with AML with normal karyotype (NK),18 with several frequently mutated loci or genes of prognostic value. CCA and most of its challengers mentioned above are uninformative on this point, and clinical practice now includes separate DNA-sequencing panels in addition to CCA.2,17,19-22
In this study, we aimed to investigate how NGS-based pangenomic techniques, herein called “next-generation karyotyping” (NGK), performed in comparison with CCA, especially for well-established prognostic features as described by the European Leukemia Net (ELN).2 We implemented NGK in a cohort of 281 consecutive AML cases performing whole-genome sequencing at low coverage (shallow whole-genome sequencing; sWGS) and WTS, validating and breaking ties with FISH and ligation-dependent RT-PCR23 (LD-RTPCR). Somatic mutations were assessed with a DNA-sequencing panel to provide a full genetic characterization of the cases, but this was not evaluated in this study because it is not information provided by CCA.
Materials and methods
Patients and samples
The ClinSeq AML cohort24 included 401 unselected consecutive patients diagnosed in Sweden between 1997 and 2014. All 281 confirmed cases of AML for which CCA, WTS, DNA-sequencing panel, and sWGS could be performed and that passed the quality control, formed the cohort analyzed in this study (supplemental Table 1). Bone marrow or peripheral blood was collected at diagnosis, and separated mononuclear cells were stored at −180°C and later harvested for genomic DNA and RNA. Non-APL patients underwent standard chemotherapy, including Ara-C and anthracycline, equivalent to a 3+7 induction in accordance with Swedish national guidelines.25 Allogeneic stem cell transplantation was performed in 57 of the patients. Survival was analyzed using Kaplan-Meyer estimators and log-rank tests, with P < 5% considered significant. In the context of multiple testing (further detailed in supplemental Methods), P values were corrected into false discovery rates26 (FDRs), with FDR <10% considered significant instead.
CCA and FISH
CCA was performed as part of the diagnostic routine by the respective treating centers; collected reports were later curated to enforce the International System for Human Cytogenetic Nomenclature 2013.27 FISH was used to validate conflicting results between CCA and sWGS as described in supplemental Table 8.
WTS
Total RNA after ribosomal RNA depletion was sequenced, generating a median number of 69.3 million paired-end 126-bp reads per patient (details available in supplemental Methods). Gene fusions were identified with FusionCatcher 1.00,28 enforcing custom filters (supplemental Table 2). KMT2A partial tandem duplications (PTDs), also known as MLL-PTDs, were identified via alignment to chimeric references and exonic sequencing depth comparisons (supplemental Methods) and validated by nested RT-PCR, as previously described.29,30
sWGS
Total genomic DNA was sequenced without capture to provide a median number of 11.5 million single-end 51-bp reads per patient (0.2×). Reads were counted in each 15-kb bin of the genome using QDNAseq,31 and normalized counts were used for segmentation and copy-calling with cghRA,32 excluding sex chromosomes (supplemental Methods). Resulting segments were converted into genomic International System for Human Cytogenetic Nomenclature events, following the algorithm presented in supplemental Figure 1. Chromosome arm–level analysis, minimal common region (MCR) identification, in silico dilutions, and matching with CCA data are fully described in supplemental Methods.
LD-RTPCR
LD-RTPCR was performed for 225 patients, adapting the previously described protocol23 with an extended 243-probe mix (supplemental Tables 3 and 4). Fusion products were identified with Sanger sequencing and dedicated analytic software freely available at https://bioinformatics.ovsa.fr/MLPA.
The study was approved by the Ethical Committee in Stockholm, Sweden.
Results
Recurring CNAs in AML
sWGS identified 901 genomic segments with DNA CNAs in 120 (43%) of the 281 patients (Figure 1A; supplemental Figure 2). At the chromosome arm level, most recurrent events were gains of chromosome 8 (7.8% and 9.6% for the p and q arm, respectively) or chromosome 21 (6.0% and 5.0%, respectively) and losses of 7 (6.8% and 8.9%, respectively) and 17p (5.7%), consistent with known cytogenetic events in AML33,34 (supplemental Table 5).
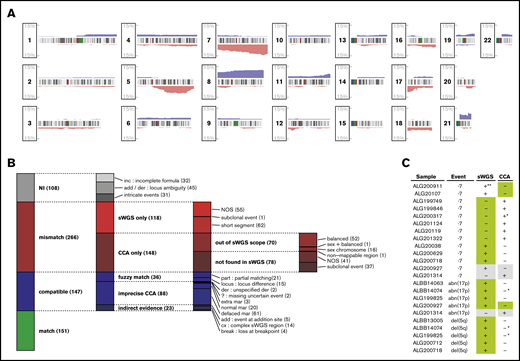
Matching CNAs between sWGS and CCA. (A) Proportion of the 281 patients with AML presenting a copy gain (blue) or loss (red) are presented along the 22 autosomes. Chromosome banding is displayed between the tracks of each chromosome, with centromeres in dark red. (B) The 672 aberrations found by CCA, sWGS, or both in the entire cohort were classified according to criteria fully described in the supplemental Methods. Each column represents a level of subclassification, from the broader terms on the left to the more precise classes on the right. Box heights are proportional to the number of aberrations present in the corresponding class (displayed between parentheses at the end of each class name). Each aberration is present in only 1 class. (C) FISH validation of ELN CNAs differing between sWGS and CCA. In each case, the genotype confirmed by FISH is highlighted in green, and cases in gray correspond to inconclusive FISH experiments. All cases are detailed in supplemental Table 8. NI, not interpretable; NOS, not otherwise specified. *Uncertainty reported in CCA (eg, incomplete formula). **Subclonal event (<10%) in a sample with few cells interpretable by FISH. der, derivative chromosome; mar, marker chromosome.
Matching CNAs between sWGS and CCA. (A) Proportion of the 281 patients with AML presenting a copy gain (blue) or loss (red) are presented along the 22 autosomes. Chromosome banding is displayed between the tracks of each chromosome, with centromeres in dark red. (B) The 672 aberrations found by CCA, sWGS, or both in the entire cohort were classified according to criteria fully described in the supplemental Methods. Each column represents a level of subclassification, from the broader terms on the left to the more precise classes on the right. Box heights are proportional to the number of aberrations present in the corresponding class (displayed between parentheses at the end of each class name). Each aberration is present in only 1 class. (C) FISH validation of ELN CNAs differing between sWGS and CCA. In each case, the genotype confirmed by FISH is highlighted in green, and cases in gray correspond to inconclusive FISH experiments. All cases are detailed in supplemental Table 8. NI, not interpretable; NOS, not otherwise specified. *Uncertainty reported in CCA (eg, incomplete formula). **Subclonal event (<10%) in a sample with few cells interpretable by FISH. der, derivative chromosome; mar, marker chromosome.
Deletions of 5q were shorter (5q14~21 to 5q33~35) and found in 10% of the patients. Two MCRs of equal significance were identified in 5q31 (FDR, 0.2%): the first was almost identical to previous findings,35 pointing to EGR1 and KDM3B as potential drivers, and the second spanned ACSL6, AFF4, CSF2, IRF1, and an interleukin cluster. Other MCRs of interest were deletions of 17q11 centered on SUZ12 and NF136 (19 patients; FDR, 0.7%), deletions of 12p13 spanning ETV6 or CDKN1B37 (13 patients; FDR, 14%), and gains of 21q22 spanning ERG38 in RUNX1 vicinity (26 patients; FDR, 25%; supplemental Figure 3; supplemental Table 6).
TP53 mutations and rearrangements correlated with genome complexity (FDR <1e-10), 5q losses (FDR <1e-10), and most of the MCRs described above (supplemental Figure 4). Mutations associated with NK, such as NPM1 mutations and FLT3 internal tandem duplications, correlated inversely with most of the aforementioned CNA-related features (FDR, 5e-6 and 1e-3, respectively).
Overall matching between sWGS and CCA
Although sWGS and CCA describe CNAs at the whole-genome level, comparing these techniques is challenging, because many aberrations reported in CCA correspond to multiple segments in sWGS. Thus, comparison was performed at the aberration level, grouping sWGS segments as described in supplemental Figure 1. The 2 techniques described 672 aberrations, including 298 (44%) matches and 266 (40%) aberrations found by only 1 technique while excluding 108 (16%) unmatchable aberrations (Figure 1B; supplemental Table 7).
Of the 118 aberrations detected only by sWGS, 52% (62) were shorter than normally detected by CCA (<10 Mbp). For the 148 aberrations found only by CCA, 47.3% (70) were balanced rearrangements or involved sex chromosomes and, thus, were undetectable by sWGS, whereas 25% (37) were subclonal (<30% of CCA mitoses) and, thus, particularly difficult to detect in sWGS. These observations reduced the proportion of clear disagreement between the 2 techniques (“NOS” in Figure 1B) to 17% of the interpretable aberrations.
Representing the biggest share of the 147 likely matches, defined as “compatible” in Figure 1B, 55% (81) sWGS aberrations could be matched with loss of the whole chromosome and the gain of an undescribed marker in CCA (“normal/defaced mar” in Figure 1B). At least 61 of these would indeed result in a complexly rearranged chromosome difficult to identify in CCA, including 3 of the 8 chromothripsis regions identified in the whole series.39 Although not considered mismatches, these cases emphasize the resolution advantage that sWGS provides over CCA and the later’s overestimation of monosomies. Among all aberrations compared between CCA and sWGS, 22% (151) were unambiguous matches.
sWGS is more sensitive in detecting CNAs and reveals false-positive monosomies in CCA
The concordance between sWGS and CCA for ELN-defining CNAs [del(5q), del(17p), and monosomy 7] was specifically evaluated. The agreement between CCA and NGK techniques over these 3 criteria was strong, averaging 96% (all Fisher’s test P values <1e-13; Figure 2A). However, both techniques reported some aberrations not confirmed by the other (18 and 13 for sWGS and CCA, respectively).


Comparison between NGK and CCA over ELN criteria. (A) Agreement between sWGS and CCA on ELN CNA–based criteria at the patient level. The gray boxes represent patients for whom both techniques agreed to call the corresponding aberration. The proportion of patients in the entire cohort with these aberrations are shown inside the gray box. Colored boxes represent other patients for whom such an aberration was called by only 1 of the 2 competing techniques. Validation status of the discrepancies by FISH or LD-RTPCR is further indicated by a darker shade (confirmed) or by stripes (refuted). The scale on the left represents the absolute number of patients in each box. (B) Agreement between WTS and CCA on ELN translocations and PML-RARA, as presented in panel A. (C-D) OS and RFS of 228 non-APL patients treated with curative intent, assessing the ELN classification as performed by NGK (WTS + sWGS) techniques. ELN-defining gene mutations were assessed by DNA panel sequencing. (E-F) Survival of ELN subgroups, as defined by NGK techniques in which complex karyotype (CK) and monosomal karyotype (MK) are replaced by a total genomic loss (TGL) threshold of 200 Mb. (G-H) Survival in ELN subgroups, as defined by NGK techniques.
Comparison between NGK and CCA over ELN criteria. (A) Agreement between sWGS and CCA on ELN CNA–based criteria at the patient level. The gray boxes represent patients for whom both techniques agreed to call the corresponding aberration. The proportion of patients in the entire cohort with these aberrations are shown inside the gray box. Colored boxes represent other patients for whom such an aberration was called by only 1 of the 2 competing techniques. Validation status of the discrepancies by FISH or LD-RTPCR is further indicated by a darker shade (confirmed) or by stripes (refuted). The scale on the left represents the absolute number of patients in each box. (B) Agreement between WTS and CCA on ELN translocations and PML-RARA, as presented in panel A. (C-D) OS and RFS of 228 non-APL patients treated with curative intent, assessing the ELN classification as performed by NGK (WTS + sWGS) techniques. ELN-defining gene mutations were assessed by DNA panel sequencing. (E-F) Survival of ELN subgroups, as defined by NGK techniques in which complex karyotype (CK) and monosomal karyotype (MK) are replaced by a total genomic loss (TGL) threshold of 200 Mb. (G-H) Survival in ELN subgroups, as defined by NGK techniques.
To arbitrate these conflicts, FISH was performed for the 23 mismatched cases for which material for FISH analysis was available. In 20 cases successfully evaluated by FISH, 17 confirmed the result from sWGS, whereas the CCA result was confirmed in 2 cases (Figure 1C; supplemental Table 8). The remaining case was a tie, because the 2 clones opposed by the 2 techniques were found with FISH. For 4 of 17 cases in which CCA was proven wrong, some ambiguity was reported in CCA (incomplete formulas or derivative chromosomes). In contrast, 1 of the 2 cases for which sWGS was proven wrong was reported as a subclonal event (<10% of the sample according to sWGS), which was unlikely to be confirmed, considering that only a few cells could be evaluated by FISH. Overall, the comparison between sWGS and CCA suggests that sWGS is more accurate in detecting isolated ELN-defining CNA aberrations compared with CCA.
Despite a greater sensitivity for sWGS regarding short events, such as del(5q) and abn(17p), monosomy 7 was reported more frequently by CCA alone (9 cases). Most of these were pseudomonosomies, in which chromosome 7 was not totally lost but instead rearranged beyond cytogenetic recognition, as illustrated by chromosome painting on a representative case in Figure 3. Four of 6 cases with monosomy 7 reported only by CCA consisted of shorter deletions on chromosome 7 rather than whole-chromosome losses according to sWGS and FISH (supplemental Table 8). In total, 61 cases of potential pseudomonosomy were identified (Figure 1B); in 67% (8/12) of all cases with monosomy 7 together with ≥1 marker chromosome, or in 33% (8/24) of all monosomy 7 cases, the monosomy was shown to be a pseudomonosomy.
![FISH in a representative case of pseudomonosomy 7. Whole-chromosome painting (WCP) of a case in which CCA, but not sWGS, reported a monosomy 7. (A) WCP using a green probe mix targeting the whole chromosome 7, a red probe mix for whole chromosome 4, and a blue probe highlighting the centromere of chromosome 7 (chromosome enumeration probe [CEP]). Wild-type (WT) chromosomes 4 and 7 can be identified, as well as 2 derivative chromosomes (der) harboring some chromosome 7 material. (B) Corresponding sWGS profile along chromosome 7 shows that most of the chromosome was lost, whereas some segments are present or amplified, suggesting a complex rearrangement of 1 of the chromosomes 7 instead of a clean loss.](https://ash.silverchair-cdn.com/ash/content_public/journal/bloodadvances/5/4/10.1182_bloodadvances.2020002517/2/m_advancesadv2020002517f3.png?Expires=1769671303&Signature=b6lKE0PLAM9r3q0WxcSFkPM1~-piKoCR8D4J2xPENUeAkJmyX907Wt8mG-jgG6PyFjtGvGB~i0ASslTxYbKDqqR8-8TRnJzLxZfUt~-g3x4R1iU~jlxF1hVQd2C0jAccOF8nGPr0qauKXCYU7hGMEQusO-9j6IEbvNc55vUlSoukpadbHLQKHPRyDH28pIzLBHui8N8KreMZ1phuanYaw0m0Tka5fjFI1rcdyEZqWISsVROBXwUKji9xSQ~5VqTEH3YL3OWTICwmNZzjlNt4UcPkOEZYPgv1psOLo7dRRS8MjXyGkITiDF6tb2LnOtGqc6LmWNYPe3MuwSZI4YM8Jg__&Key-Pair-Id=APKAIE5G5CRDK6RD3PGA)
FISH in a representative case of pseudomonosomy 7. Whole-chromosome painting (WCP) of a case in which CCA, but not sWGS, reported a monosomy 7. (A) WCP using a green probe mix targeting the whole chromosome 7, a red probe mix for whole chromosome 4, and a blue probe highlighting the centromere of chromosome 7 (chromosome enumeration probe [CEP]). Wild-type (WT) chromosomes 4 and 7 can be identified, as well as 2 derivative chromosomes (der) harboring some chromosome 7 material. (B) Corresponding sWGS profile along chromosome 7 shows that most of the chromosome was lost, whereas some segments are present or amplified, suggesting a complex rearrangement of 1 of the chromosomes 7 instead of a clean loss.
FISH in a representative case of pseudomonosomy 7. Whole-chromosome painting (WCP) of a case in which CCA, but not sWGS, reported a monosomy 7. (A) WCP using a green probe mix targeting the whole chromosome 7, a red probe mix for whole chromosome 4, and a blue probe highlighting the centromere of chromosome 7 (chromosome enumeration probe [CEP]). Wild-type (WT) chromosomes 4 and 7 can be identified, as well as 2 derivative chromosomes (der) harboring some chromosome 7 material. (B) Corresponding sWGS profile along chromosome 7 shows that most of the chromosome was lost, whereas some segments are present or amplified, suggesting a complex rearrangement of 1 of the chromosomes 7 instead of a clean loss.
Total genomic loss replacing CK in NGS-based analysis
Strictly applying the ELN definition of CK and MK based on sWGS data, groups of similar sizes and poor prognosis were found (supplemental Figure 5A-D,G-J). Applying other CK definitions, such as ≥4 or ≥5 abnormalities, showed P values for survival that were similar to the ELN definition (supplemental Figure 5K-P). Considering previous work on the prognostic value of genomic loss in AML,40,41 as well as the unsuitability of NGS data to define classical CK and MK, TGL was assessed to replace genomic instability as captured by CK and MK. Sorted TGL values suggested 200 Mb as a threshold between heavily (>230 Mb) and moderately (<159 Mb) altered genomes (Figure 4A). Strong redundancy among TGL, CK, MK, and TP53 mutations could be observed; patients with >200 Mb of deletions concentrated most of the TP53 mutated and monosomal cases (P = 4.5e-13 and 4.4e-17, respectively, Fisher’s exact test) and captured the prognostic value of these criteria (relapse-free survival [RFS]; P = .00183; Figure 4B). Conversely, patients with CCA-based CK and TGL <200 Mb failed to demonstrate adverse prognosis (RFS, P = .296). These results corroborate the previous observation of MK’s superiority over CK to assess prognosis in AML,40 and suggest TP53 mutations and TGL >200 Mb as better alternatives in a next-generation implementation of the ELN classification. The 2 patients displaying a hyperdiploid karyotype by CCA were defined as CKs by CCA and had a TGL <200 Mb, but their small number did not allow further analysis.
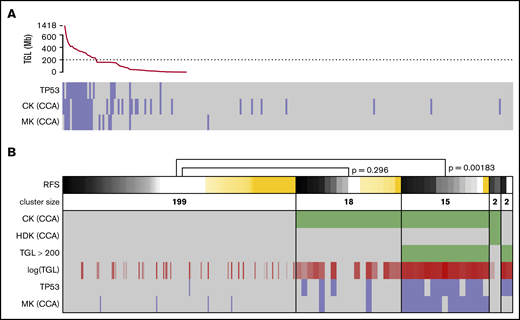
Refining the CKs. (A) TGL, as measured by sWGS, for the 236 intensively treated patients (including 8 APLs) displayed with successively decreasing genomic loss size. TP53 mutational status, as well as CK and MK, as determined by CCA are shown below. (B) The status of 6 factors related to genomic complexity are presented as a heat map for the 236 patients with survival data. Patients (columns) are grouped according to the status of the 3 factors in green: CK and hyperdiploid karyotype (HDK) according to CCA and TGL >200 Mbp by sWGS. TGL is also shown as a continuous value in shades of red; darker shades correspond to higher TGL. TP53 mutation and MK according to CCA are shown at the bottom of the panel (positive cases in blue and negative cases in gray). The top row shows RFS, where relapses or deaths are shown in black/gray (the darker shade represents shorter time to relapse). Patients censored before reaching an event are shown in yellow (the longer the follow-up, the darker the shade). Patients are sorted by survival in each cluster, and P values were calculated using log-rank tests to compare 2 clusters. The width of columns in the first cluster was reduced for better readability.
Refining the CKs. (A) TGL, as measured by sWGS, for the 236 intensively treated patients (including 8 APLs) displayed with successively decreasing genomic loss size. TP53 mutational status, as well as CK and MK, as determined by CCA are shown below. (B) The status of 6 factors related to genomic complexity are presented as a heat map for the 236 patients with survival data. Patients (columns) are grouped according to the status of the 3 factors in green: CK and hyperdiploid karyotype (HDK) according to CCA and TGL >200 Mbp by sWGS. TGL is also shown as a continuous value in shades of red; darker shades correspond to higher TGL. TP53 mutation and MK according to CCA are shown at the bottom of the panel (positive cases in blue and negative cases in gray). The top row shows RFS, where relapses or deaths are shown in black/gray (the darker shade represents shorter time to relapse). Patients censored before reaching an event are shown in yellow (the longer the follow-up, the darker the shade). Patients are sorted by survival in each cluster, and P values were calculated using log-rank tests to compare 2 clusters. The width of columns in the first cluster was reduced for better readability.
Recurring gene fusions in AML by WTS
WTS data from all 281 patients were analyzed by FusionCatcher28 to describe gene fusions, focusing on fusions already reported in the literature (supplemental Methods). Of 74 filtered fusions (supplemental Table 9), 30 were part of the ELN classification and 6 were PML-RARA fusions defining APLs (Figure 5). Neither t(6;9) nor t(9;22) could be identified, consistent with their respective reported frequencies of 0.7%17 and 0.9%,42 whereas all of the other 4 ELN-defining fusions were found.
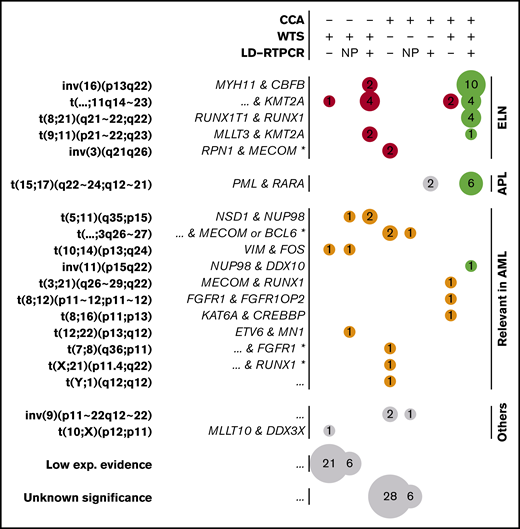
Gene fusions found by CCA, WTS, and LD-RTPCR. Each circle represents a set of gene fusions (in rows, possibly multiple fusions per patient) found by a unique combination of techniques (in columns); the size of the circle is proportional to the event count (also shown inside the circle). The combination of techniques for each column is described at the top of the figure: a plus sign (+) implying that the technique found the fusion, a minus sign (−) implying that it did not report the fusion, and NP denoting that the technique was not performed. Fusions are grouped according to their presence in the ELN classification (red), their relevance in AML according to other publications (orange), or their lack of relation to AML (gray). Perfect matches between the performed techniques are shown in green, whereas fusions found only in WTS with low experimental evidence (few supporting reads) and unknown translocations found only in CCA are further grouped at the bottom of the figure. For each fusion or translocation, the cytogenetic ranges considered are presented in bold type, and the fused genes are shown in italics on the left. For fusions found only by CCA, fused genes could only be inferred according to the locus and are marked by an asterisk (*). Nonrecurring or unknown fused genes are denoted as “...”
Gene fusions found by CCA, WTS, and LD-RTPCR. Each circle represents a set of gene fusions (in rows, possibly multiple fusions per patient) found by a unique combination of techniques (in columns); the size of the circle is proportional to the event count (also shown inside the circle). The combination of techniques for each column is described at the top of the figure: a plus sign (+) implying that the technique found the fusion, a minus sign (−) implying that it did not report the fusion, and NP denoting that the technique was not performed. Fusions are grouped according to their presence in the ELN classification (red), their relevance in AML according to other publications (orange), or their lack of relation to AML (gray). Perfect matches between the performed techniques are shown in green, whereas fusions found only in WTS with low experimental evidence (few supporting reads) and unknown translocations found only in CCA are further grouped at the bottom of the figure. For each fusion or translocation, the cytogenetic ranges considered are presented in bold type, and the fused genes are shown in italics on the left. For fusions found only by CCA, fused genes could only be inferred according to the locus and are marked by an asterisk (*). Nonrecurring or unknown fused genes are denoted as “...”
Ten non-ELN, but potentially relevant, fusions were detected, including NSD1-NUP98,43 MN1-ETV6,44,45 MECOM-RUNX1,46 FGFR1-FGFR1OP2,47 KAT6A-CREBBP,48 and NUP98-DDX10,49,50 all of which have been described previously in AML (Figure 5). Two fusions between VIM and the myeloid differentiation–related51 FOS were also regarded as potentially pathogenic. Finally, a MLLT10-DDX3X fusion previously described in T-cell acute lymphoblastic leukemia,52 as well as 27 other fusions, were detected with low experimental evidence (3 reads).
Matching of gene fusions between WTS and CCA
Fusions detected by WTS were compared with CCA and additionally validated by LD-RTPCR. LD-RTPCR is a multiplex technique interrogating a panel of known AML fusions between 60 genes and 62 of their partners23,53 (243 exons in total; supplemental Tables 3, 4, and 10). CCA and NGK agreement was excellent across the translocation-based ELN criteria, averaging 99.4% (Figure 2B). Overall, WTS demonstrated greater sensitivity than CCA, with 2 extra inversions of chromosome 16 and 7 extra KMT2A rearrangements (including 2 MLLT3-KMT2A fusions related to better prognosis). Seven of these 9 events were confirmed by LD-RTPCR, whereas the KMT2A-MLLT6 and KMT2A-MLLT10 fusions were not covered by the LD-RTPCR panel.
In contrast, inversions of chromosome 3 were systematically missed by WTS as a result of the absence of a fusion transcript in this enhancer-switch–based translocation.54 In addition, 2 of 8 t(15;17) were missed by WTS, despite being confirmed by LD-RTPCR and CCA. Further investigation of WTS data on PML-RARA fusions also revealed evidence for the fusion in those 2 cases, but it was below the threshold set by FusionCatcher (2/3 supporting reads; supplemental Figure 6). The low abundance of fusion transcript can be linked to insufficient sequencing yields in combination with low blast counts for these 2 patients (supplemental Figure 6), whereas reliable threshold levels for sequencing yields and blast counts could not be set because of overlaps. However, this highlights how WTS sensitivity depends on sequencing depth, which is especially critical for cases with PML-RARA that need specific and urgent treatment decisions based on the presence of this transcript. Regarding non-ELN fusions, there was less overlap between techniques (Figure 5). Among 16 non-ELN fusions with potential biological relevance in AML, 4 were detected by WTS and CCA (MECOM-RUNX1, FGFR1-FGFR1OP2, KAT6A-CREBBP, and NUP98-DDX10), 6 were detected only by WTS, and 6 others were detected only by CCA (LD-RTPCR lacked representation for most of these fusions). NSD1-NUP98, which is known to be cryptic,43 was part of the fusions missed by CCA. Aberrations detected by CCA, but not WTS, included 3 potential atypical MECOM or BCL6 translocations (3q26-27), as well as 2 other translocations potentially involving RUNX1 (21q22) and FGFR1 (8p11).
Whole-ELN level comparison between CCA and NGK
By performing DNA panel sequencing in the entire cohort, information on gene mutations (supplemental Figure 7) could be merged with CCA and NGK data to classify patients into ELN categories based on CNAs and fusions detected by these 2 competing approaches. Of all 281 patients, only 17 changed risk group when replacing CCA with NGK, moving 6 from intermediate to adverse, 1 from intermediate to favorable, 7 from adverse to intermediate, and 1 from adverse to favorable. The 2 APL cases missed by WTS moved from favorable to intermediate and adverse risks with NGK.
Focusing on 228 non-APL patients with sufficient survival data, overall survival (OS) and relapse-free survival (RFS) were calculated for ELN risk groups based on NGK with ELN definitions for CK and MK (Figure 2C-D), NGK with TGL as a marker for genome complexity (Figure 2E-F), or CCA (Figure 2G-H). There was no statistically significant difference between CCA's and NGK's ability to identify groups with distinct prognosis using ELN criteria (P = .26 for OS and RFS, likelihood-ratio test).
We also estimated the relative costs in time and money for conventional CCA compared with the NGK approach (WTS + sWGS with or without LD-RTPCR; supplemental Table 11). With regard to the time from sampling to delivering analytic results, this may differ considerably between laboratories as a result of disparities in routines and conditions. For NGK techniques, a 14-day time frame is used in clinical projects at the SciLifeLab in Stockholm, Sweden (https://www.scilifelab.se/facilities/clinical-genomics-stockholm/). Thus, we could estimate that the approaches are comparable under optimal conditions (∼2 weeks). Based on prices at clinical genetics departments and information from clinical sequencing laboratories, we estimate that the costs would be comparable or even somewhat lower for the NGK approach compared with conventional CCA + a FISH panel for translocations/inversions or somewhat lower for CCA if excluding the FISH panel in the conventional approach. This is the case, regardless of adding the additional technique for fusion detection in the NGK approach.
KMT2A-PTDs
Although not included in the ELN classification and with a debated prognostic value,55-58 KMT2A-PTDs (or MLL-PTDs) constitute recurring aberrations in AML. Because KMT2A-PTDs are not normally detected by CCA, we assessed the accuracy of NGK techniques using WTS and data from the DNA-sequencing panel that were used for mutation detection (see supplemental Methods) to detect these aberrations. Differential sequencing depth analysis at the RNA and DNA levels identified 18 patients with KMT2A-PTD (Figure 6A); all were confirmed by nested RT-PCR and/or LD-RTPCR. The 18 KMT2A-PTDs involved exons 2 through 8 in 9 cases, exons 2 through 10 in 7 cases, and exons 2 through 11 and 3 through 6 in the remaining unique cases (supplemental Table 12). Two more KMT2A-PTDs involving exons 4 through 8 were identified at the DNA level but not the RNA level; their confirmation by nested RT-PCR illustrates the limitations of RNA-based techniques to identify 4-8 PTDs, presumably as a result of their natural occurrence by splicing.
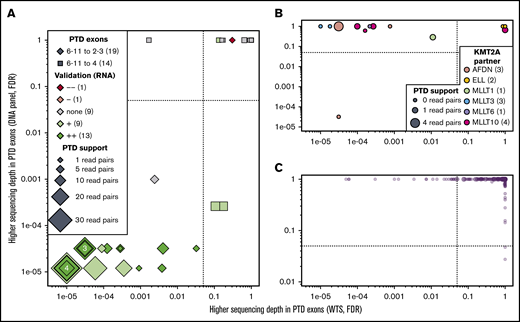
KMT2A-PTD found by WTS, LD-RTPCR, and RT-PCR. In all 3 panels, each patient is represented by a point whose coordinates indicate the significance of a putative KMT2A-PTD in RNA (x-axis, exon sequencing depth difference in WTS) and DNA (y-axis, exon sequencing depth difference in the DNA-sequencing panel). Significance thresholds are indicated by dotted/dashed lines. Point sizes are proportional to the amount of chimeric reads supporting the PTD in WTS. (A) Thirty-three patients with ≥1 chimeric read in WTS (most likely KMT2A-PTDs). (B) Fourteen patients with a KMT2A fusion identified by WTS, CCA, or LD-RTPCR. (C) The 234 remaining patients who are unlikely to harbor a PTD or a fusion of KMT2A. Details about all patients are available in supplemental Table 11.
KMT2A-PTD found by WTS, LD-RTPCR, and RT-PCR. In all 3 panels, each patient is represented by a point whose coordinates indicate the significance of a putative KMT2A-PTD in RNA (x-axis, exon sequencing depth difference in WTS) and DNA (y-axis, exon sequencing depth difference in the DNA-sequencing panel). Significance thresholds are indicated by dotted/dashed lines. Point sizes are proportional to the amount of chimeric reads supporting the PTD in WTS. (A) Thirty-three patients with ≥1 chimeric read in WTS (most likely KMT2A-PTDs). (B) Fourteen patients with a KMT2A fusion identified by WTS, CCA, or LD-RTPCR. (C) The 234 remaining patients who are unlikely to harbor a PTD or a fusion of KMT2A. Details about all patients are available in supplemental Table 11.
In 11 of 14 KMT2A fusion cases, KMT2A exons were deferentially expressed only at the RNA level (Figure 6B). In 1 notable exception, sWGS showed a complex genomic rearrangement with a short deletion of KMT2A and an amplification of the partner AFDN (supplemental Figure 8). Finally, 22 of the 245 patients without evidence of KMT2A-PTD in DNA or KMT2A fusion in RNA showed differential exon expression (Figure 6A,C). KMT2A-PTD was associated with a borderline significantly shorter RFS (P = 5.3%; supplemental Figure 9), but it was not an independent factor for RFS in a multivariable analysis including ELN events (P = .42).
Sequencing depth optimization for sWGS
To determine the minimal sequencing depth sufficient to obtain reliable results for ELN-defining CNAs, in silico dilutions of the sWGS data set were performed on 16 representative samples. Dilutions ranging from 5e6 to 1e4 reads were investigated (Figure 7A; supplemental Figure 10). Dilutions of 1e6 and 1e5 reads were retained because they were able to capture most of the genomic variability.
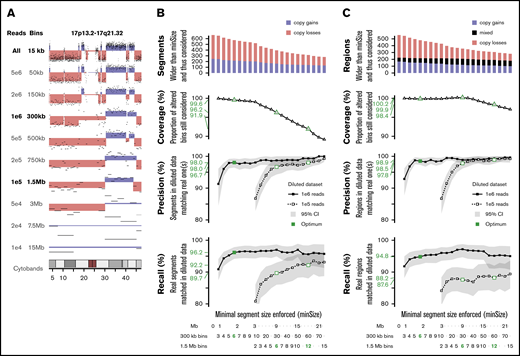
In silico dilution of the sWGS data. (A) Example of dilution on chromosome 17 of sample ALG201322 (see supplemental Figure 10 for full legend and dilution settings). (B-C) Performances of the diluted data sets enforcing various minimal segment sizes. Top panel represents the number of segments in the original data set longer than minSize, sorted by copy number state (gain or loss). The second panel translates this coverage of the whole data set into the proportion of altered bins included in a segment longer than minSize. The third and fourth panels describe, respectively, the precision and recall in both diluted datasets, with 95% confidence intervals plotted in gray and thresholds of interest in green. The scales at the bottom provide 3 representations of minSize, in Mbp and as the number of consecutives bins for the 2 different diluted datasets. (B) Analysis focused on individual segments. (C) Analysis focused on regions, merging consecutive segments with different copy number states.
In silico dilution of the sWGS data. (A) Example of dilution on chromosome 17 of sample ALG201322 (see supplemental Figure 10 for full legend and dilution settings). (B-C) Performances of the diluted data sets enforcing various minimal segment sizes. Top panel represents the number of segments in the original data set longer than minSize, sorted by copy number state (gain or loss). The second panel translates this coverage of the whole data set into the proportion of altered bins included in a segment longer than minSize. The third and fourth panels describe, respectively, the precision and recall in both diluted datasets, with 95% confidence intervals plotted in gray and thresholds of interest in green. The scales at the bottom provide 3 representations of minSize, in Mbp and as the number of consecutives bins for the 2 different diluted datasets. (B) Analysis focused on individual segments. (C) Analysis focused on regions, merging consecutive segments with different copy number states.
The whole series was reanalyzed at these 2 dilution levels, and their respective ability to detect CNAs identified in the nondiluted data set was assessed. Because shallower sequencing requires wider bins and, thus, provides lesser genomic resolution,31 the minimal size of detectable segments was monitored as well. Performances were computed at the segment level (Figure 7B) and the region level (Figure 7C), considering consecutive altered segments as a single altered region. One million reads provided precision of 98% and 98.5% on segments and regions >1.8 Mbp, respectively, as well as recalls of 96.2% and 94.8% on 99.6% to 99.9% of known alterations. Performances with 1e5 reads were lower: 96.7% precision and 89.7% recall on segments >9 Mbp.
With regard to ELN CNAs, 1e6 reads achieved 100% precision and recalls >90% on all 5 criteria (supplemental Table 13), with 10 times fewer reads than the reference data. Two monosomies and 3 CKs were missed, primarily as a result of the challenge of defining criteria suitable for sWGS. Although 1e5 reads showed precision >89% on all criteria, recalls were down to 67% on short aberrations like abn(17p). However, 1e5 reads still outperformed CCA on the 4 other ELN criteria, at a similar resolution level (9 Mbp).
Discussion
The development of sequencing techniques has revolutionized the assessment of genetic aberrations in cancers. Although NGS-based technologies have been integrated in the clinical routine to detect recurrent mutations in AML, conventional karyotyping is still mandatory for AML diagnosis, especially for assessing ELN-defining CNAs and translocations.2 Given the capability of sequencing techniques to assess CNAs and gene fusions, it is surprising that CCA still holds an unchallenged position in the routine diagnosis of AML. Considering that information captured by CCA is also available through NGS-based methods, we compared and challenged CCA in a cohort of 281 intensively treated patients with AML using a combination of WTS and sWGS that we named NGK. Overall, this systematic comparison between CCA and NGK suggests that NGK can challenge CCA for AML routine diagnostics.
Regarding isolated CNAs of prognostic value, such as del(5q), abn(17p) and monosomy 7, sWGS showed a higher sensitivity, as confirmed by FISH. Aside from anecdotal subclonal cases in which the CCA single-cell approach remains superior to such a bulk analysis, genomic resolution was a critical point of this comparison. Although CCA resolution is variable and technically limited to 5 to 7 Mbp,5 DNA-sequencing techniques could attain 1-bp resolution. However, whether to aim for such resolution remains questionable, because the prognostic relevance of short del(5q) or abn(17p) segments invisible to CCA is unknown, especially when they do not overlap known MCRs or when polymorphisms cannot be ruled out. Enforcing a pragmatic approach and using in silico dilution, we estimated that 1 million reads would be sufficient to implement the ELN classification with a 1.8-Mbp minimal segment size consistent with current practice. This lightness of protocol and sequencing yield creates the opportunity to pool sWGS libraries with currently performed DNA mutation panels for joint sequencing, achieving satisfactory accuracy with regard to mutations and CNAs in AML in a single experiment, which could be run on benchtop sequencers, such as the Illumina MiSeq. However, aiming for narrower CNAs (eg, CDKN2A deletion in lymphomas) would require reconsideration of the optimal amount of reads to sequence in an sWGS strategy. In addition, a fairly conservative threshold for filtering germline CNAs was used; thus, we would not advocate for a routine use of germline controls applying this technique. Furthermore, the aim of this study was to challenge the conventional karyotyping for classification and prognostication of AML at the time of diagnosis. Because of the limited sensitivity of sWGS to subclonal aberrations or aberrations highly diluted in normal cells, the technique is not suitable for analysis of minimal residual disease.
The ELN classification also includes the broader concepts of complex and monosomal karyotypes, for which CCA appears to be more prognostically pertinent than sWGS at first glance. However, ELN criteria were selected for their prognostic value based on CCA being the technical standard at the time, enforcing technique-specific thresholds and benefiting from its own approximations. With regard to CK, which is defined by a debated number of aberrations,59 sWGS offers a slightly different scope, detecting smaller CNAs and missing sex chromosomes (in our implementation) and balanced rearrangements. In detecting MK, which has shown superiority over CK for prognostication,40 we found sWGS to provide greater accuracy compared with CCA. We and other investigators60 demonstrated that many monosomies reported by CCA are actually more complex chromosome rearrangements in which material from the targeted chromosome is dispersed through the genome. Through validation by FISH of cases with monosomy 7 detected by CCA that could not be confirmed by sWGS, we conclude that the presence of pseudomonosomies of chromosome 7 are a relatively common event occurring in up to 67% of cases in which CCA also displays a marker chromosome. Thus, sWGS more accurately identifies monosomies than does CCA, which tends to overestimate them. Importantly, the prognostic value of monosomies was established using CCA, which does not distinguish pseudomonosomies from true monosomies. The prognosis of pseudomonosomies may impact our comparison between NGS- and CCA-based data for ELN prognostication; although this comparison did not show any significant difference, additional and larger studies are needed to explore the impact of pseudomonosomies on prognosis. More importantly, this calls for further development, study, and testing of new prognostic systems, including CNAs, that emerge from NGS data.
Because the counting of genomic aberrations for defining CK is less suitable for NGS-based methods, we evaluated TGL with a 200-Mbp threshold, rather than CK or MK, as a way to assess genome complexity using sWGS. Because sWGS detects losses, but not balanced translocations, we could show an especially high redundancy between TGL and MK (compared with CCA CK), as well as TP53 mutations. This suggests that adequate coverage of TP53 mutations (via a DNA-sequencing panel) and/or of whole-genome CNAs (via sWGS) could be sufficient to capture the prognostic value of genome complexity in an NGK-based ELN classification without CCA.
With regard to gene fusions, WTS outperformed CCA but showed some limitations. Indeed, it offered a broader and more consistent coverage of fusions encountered in AML, especially fusions, such as inv(16), that could be missed by cytogenetic analysis, or unusual partners of KMT2A. In a recent cohort, the Beat AML project concluded that WTS did not offer any significant improvement with regard to a panel of known fusions compared with clinical practice, while unfortunately considering only MLLT3 as a KMT2A partner for the comparison.61 Moreover, we were faced with 2 cases of PML-RARA with insufficient supporting evidence for unsupervised calling, highlighting that sequencing depth is critical and should exceed the current standard for gene expression RNA-sequencing. NGS-based solutions to this sensitivity issue could be WTS with deeper sequencing depth, targeted sequencing panels,62 or differently designed shallow DNA-sequencing which could address translocations and CNAs in a single experiment.63 Other non-NGS–based alternatives could also offer reliable, cost-effective, and quick solutions. In this study, we used a specifically designed LD-RTPCR panel for validation of AML fusions,23,53 which could reliably detect fusions at a relatively low cost within 1 day. In addition to fusion detection, WTS could add prognostic value through gene expression patterns24 ; however, this does not fall within the scope of this ELN-based study.
The future will likely see advanced sequencing approaches, such as WGS at greater depth in combination with WTS applied in the clinical routine, displaying the full spectrum of molecular aberrations in AML. However, these approaches are currently challenged by high costs, lack of prognostic marker validation, and problems related to providing reliable results within a sufficiently short time frame. The last is important because AML up-front treatment is becoming more diverse, with novel alternatives to the classical 3+7 induction. With regard to comparing costs in terms of time and money, we estimate that our NGK approach, as presented here, is similar when it comes to time from sampling to providing the analytic result and that the price would be comparable to CCA. Another advantage with a transition from CCA- to NGS-based prognostication is the greater degree of objectivity and lower risk for bias in the analysis of NGS, as well as a reduced dependency on very highly experienced personnel.
Another issue that comes with the introduction of new techniques with better coverage and resolution is the additional information that it gives on genetic aberrations with unknown significance and relevance and how to approach them. However, this is a situation that we already face when CCA detects aberrations with unknown significance or when DNA mutation panels detect mutations with unknown prognostic value. Hopefully, with increasing research within this field, additional genetic markers can be used for prognostication and/or treatment choices in the future.
Although our approach was based on pangenomic techniques for exhaustivity, other studies have tried to circumvent these challenges with targeted approaches. The karyogene assay20 represents an iteration of the DNA mutation panel extended with the CNA-detection capability that we suggest. Sequencing 8673 extra single-nucleotide polymorphisms evenly spread throughout the genome, it should offer a CNA resolution similar to 1 million sWGS reads (1 point per 300 kb), with the added capability to detect copy-neutral losses of heterozygosity, but also potentially introducing extra noise as a result of querying isolated loci rather than binning reads in large regions. He et al19 have described another alternative, combining the joint targeted sequencing of 405 genes in DNA and 265 genes in RNA, collecting ∼20 million reads in each. Although attaining good accuracy with regard to mutations and diluted fusions, the resolution of CNA should be considered with caution, especially when assessing the general karyotype complexity outside well-known loci of interest.
Notably, this study assessed the ability of NGS techniques to recapitulate prognostic markers that have been developed by a conventional method, such as CCA. Because NGS techniques offer increased resolution and sensitivity and are able to detect other molecular features outside the scope of CCA, new NGS-based prognostication markers should be investigated and developed. This will likely improve prognostication and the means to individualize treatment in AML.
Previous results based on partly overlapping data have been published (ref. 24 and Wang M, Lindberg J, Klevebring D, et al. Development and validation of a novel RNA sequencing-based prognostic score for acute myeloid leukemia. J Natl Cancer Inst. 2018;110(10):1094-1101), although the analysis and the data provided in this article are distinctly different.
Processed sequencing data are available at https://doi.org/10.5281/zenodo.292986. Raw sequencing data are not allowed to be publicly deposited according to Swedish law, because they allow identification of individuals based on the DNA sequence. Requests for raw data should be sent to Sören Lehmann (soren.lehmann@ki.se).
Acknowledgments
This work was supported by grants from The Swedish Cancer Foundation, The Swedish Childhood Cancer Fund, The Swedish Research Council, and the County Councils of Stockholm and Uppsala. Bioinformatics processing of sequencing data was performed on resources provided by the Swedish National Infrastructure for Computing (SNIC) through the Uppsala Multidisciplinary Center for Advanced Computational Science (UPPMAX) under Project SNIC sens2017523.
Authorship
Contribution: S.M., A.P., A.L., and S.L. designed the research and wrote the manuscript; S.M. performed bioinformatics analyses and created the figures; J.L., M.R., and H.G. designed and performed WTS and sWGS experiments; A.P. performed LD-RTPCR and nested RT-PCR experiments; P.R., M.E., V.M., and F.J. provided support for LD-RTPCR experiments; L.C. performed FISH and chromosome painting experiments; A.N. provided support for chromosome painting experiments; and C.N., S.B., A.E., M.J., and M.B. curated clinical data and samples.
Conflict-of-interest disclosure: P.R., V.M., and F.J. are inventors on a patent for the LD-RTPCR test used as validation in this study (WO2015036705A1). The remaining authors declare no competing financial interests.
The current affiliation for S.M. is Bioinformatics Group, Plateforme de Séquençage–Hospices Civils de Lyon (NGS-HCL), Bron, France.
Correspondence: Sören Lehmann, Hematology/Oncology Administration, Uppsala University Hospital, Entrance 101, 1st Floor, 751 85 Uppsala, Sweden; e-mail: soren.lehmann@ki.se.

