

Key points
gata2b-deficient zebrafish recapitulate human GATA2 deficiency syndrome–associated hematopoietic phenotypes.
gata2b loss attenuates myelopoiesis and is associated with B-cell lymphopenia despite enhanced lymphoid program in progenitors.

Abstract
Germline heterozygous mutations in GATA2 are associated with a syndrome characterized by cytopenias, atypical infections, and increased risk of hematologic malignancies. Here, we generated a zebrafish mutant of gata2b that recapitulated the myelomonocytopenia and B-cell lymphopenia of GATA2 deficiency syndrome. Using single-cell assay for transposase accessible chromatin with sequencing of marrow cells, we showed that loss of gata2b led to contrasting alterations in chromosome accessibility in early myeloid and lymphoid progenitors, associated with defects in gene expression. Within the myeloid lineage in gata2b mutant zebrafish, we identified an attenuated myeloid differentiation with reduced transcriptional priming and skewing away from the monocytic program. In contrast, in early lymphoid progenitors, gata2b loss led to accumulation of B-lymphoid transcription factor accessibility coupled with increased expression of the B-cell lineage-specification program. However, gata2b mutant zebrafish had incomplete B-cell lymphopoiesis with loss of lineage-specific transcription factor accessibility in differentiating B cells, in the context of aberrantly reduced oxidative metabolic pathways. Our results establish that transcriptional events in early progenitors driven by Gata2 are required to complete normal differentiation.
Introduction
Hematopoietic stem and progenitor cells (HSPCs) meet the lifelong demand for mature cell types of the blood through tightly regulated lineage decisions at various stages of differentiation. The balanced hematopoietic output is mediated by critical transcription factors (TFs) and their activity on gene expression. For example, PAX5 promotes a B-cell commitment program and actively represses other cell fates, such that Pax5-null HSPCs gain myeloid and T-cell differentiation potential.1 GATA2 is a crucial TF for hematopoietic stem cell specification during development and is highly expressed in HSPCs in adult hematopoiesis.2 GATA2-to-GATA1 switch controls the erythroid fate of HSPCs.3 Its direct role in other hematopoietic lineage specification has been inferred from the cytopenias found in GATA2 deficiency syndrome due to heterozygous germline GATA2 mutations. These include monocytopenia, B-cell lymphopenia, and other immune cell deficiencies.4,5 The Gata2+/− mouse has a moderate decrease in repopulating HSPCs with decreased myeloid potential but without significant cytopenias.6,7 Homozygous loss of Gata2 is embryonic lethal by day 10.5 in mammals.2 The lack of phenotype in heterozygous mutants recapitulating GATA2 syndrome–associated cytopenias and embryonic lethality of homozygous mutants in mammalian models prompted us to generate an adult gata2 knockout zebrafish, where homozygous mutants of other critical developmental transcriptional factors, such as RUNX1, have been shown to be viable.8
The hematopoietic system in zebrafish is highly conserved compared with mammals. Zebrafish have 2 orthologs of GATA2. Gata2a has been implicated in lymphovascular development with some expression in HSPCs and eosinophils in adult hematopoiesis.9-12 Gata2b, with 57% identity to gata2a and human GATA2, is restricted to hemogenic endothelium and emerging hematopoietic stem cells during development that contribute to adult hematopoiesis.13 The tissue-restricted expression of the gata2 orthologs provides a potentially unique opportunity to investigate hematopoiesis-specific functions of GATA2.
To study the role of complete gata2b loss in adult hematopoiesis, we generated a novel gata2b germline mutant in zebrafish using CRISPR-Cas9 mutagenesis. Here, we show that while germline loss of gata2b has a mild effect during development, gata2b mutant adult zebrafish recapitulate the monocytopenia and B-cell lymphopenia of human GATA2 deficiency syndrome. We investigated the etiology of these cytopenias using single-cell assay for transposase-accessible chromatin with sequencing (scATAC-seq), and found differential chromatin accessibility states in early progenitors of myeloid and lymphoid lineages with loss of gata2b. This epigenetic effect resulted in gene expression changes that we examined by single-cell RNA sequencing (scRNA-seq). We reveal lineage-specific roles of gata2b in promoting myeloid cell homeostasis, monocytic differentiation, and maintaining lymphoid progenitors for effective B-cell lymphopoiesis.
Methods
Zebrafish lines and embryos
Zebrafish were maintained in accordance to the animal protocol approved by Boston Children’s Hospital Institutional Animal Care and Use Committee. The zebrafish line for generation of gata2a and gata2b mutants was Tg(ubi:Zebrabow-M), described previously.14 Zebrafish line casper (roy−/−;nacre−/−) was used as recipients of the marrow cell transplantations.15 Wild-type AB or Tübingen zebrafish lines were used as helper marrow donors in transplantation assays. Embryos were collected and kept in embryo buffer (5 mM NaCl, 0.17 mM KCl, 0.25 mM CaCl2, and 0.15 mM MgSO4). They were grown at 28.5°C in an incubator for 5 days in embryo buffer and then placed in the nursery for care as per protocol.
Generation and sequencing of CRISPR mutants
Zebrafish line Tg(ubi:Zebrabow-M) was bred, and embryos were collected for microinjection with 90 pg of Cas9 messenger RNA and 15 to 20 pg of individual guide RNAs (gRNAs). Cas9 messenger RNA was made using pCS2-Cas916 using mMESSAGEmMACHINE SP6 Transcription Kit (Invitrogen). All gRNAs were synthesized and validated based on a published protocol.17,18 gRNA sequences without protospacer adjacent motif (PAM) site were as follows: gata2a GAACACATCCACCTCGTCCG (exon 2); gata2b AGAGATGATGGATGCCCCAG (exon 2); gata2b CCCATTATTACAACCAGACG (exon 4). To genotype, genomic DNA was extracted with Quick-DNA miniprep kit (Zymo Research) for marrow cells and fin clip fibroblasts, and using HotSHOT method of hot 50 mM sodium hydroxide and Tris-HCl (1 M, pH 7.5)19 for embryos. The CRISPR loci of the targeted genes were amplified using the following set of primers: gata2a(ex2) FW: ACTATAGTGGTGCTTTCGGGTC; RV: TCTAGCCCGAGAGTTGGAGTAG; gata2b(ex2) FW: AGCTTTTTAATCGCACAGGAAC; RV: GGCTGAGAAATACATCCACCTC; gata2b(ex4) FW: GCATCCCTGTCCTACTGAAAAG; RV: AGTAGGGGTTTCCCTGAGAGTC. Amplification was performed using Phusion High-Fidelity PCR Master Mix with HF Buffer (New England Biolabs), with the following conditions: 98°C, 3 minutes (98°C, 10 seconds; 60°C, 10 seconds; 72°C, 10 seconds) × 35 cycles, 72°C, 5 minutes. Sequencing of the amplicons was performed on the Illumina MiSeq for line generation and analyzed using the Basepair online tool (www.basepairtech.com). For genotyping, CRISPR amplicons were amplified as per the above protocol with 30 cycles of PCR, and then either Sanger sequenced with forward primers, or digested with ScrFI (gata2a), BseYI (gata2b exon 2), and MnlI (gata2b exon 4) (New England Biolabs), all of which digest the wild-type amplicon but not the mutant one.
Flow cytometry and cell sorting
To collect kidney marrows, adult zebrafish (3 to 12 months old) were anesthetized with 0.02% tricaine. Cardiac bleed was performed using heparin-coated (1000 USP units/mL in 1× phosphate-buffered saline [PBS]) p10 or p20 pipette tips to reduce erythrocyte contamination from peripheral blood. The soft tissue of the kidney marrow was placed in cold 0.9× PBS (ThermoFisher) with 2% fetal bovine serum (FBS; Gemini) and 1 USP units/mL heparin (Sigma-Aldrich) (blood buffer), and then mechanically dissociated by repeated pipetting into single-cell suspension and passed through a 40-μm nylon mesh 5 to 10 minutes prior to analysis. Flow cytometric analysis was performed using BD LSRII or Fortessa (BD Biosciences). Sorting of cells for quantitative reverse transcription polymerase chain reaction (qRT-PCR) and scRNA-seq was performed on a BD FACSAriaII sorter into 300 μL of 1× PBS with 50% FBS or 0.04% bovine serum albumin, respectively.
Cytospins
Marrow cells were collected from 3-month-old zebrafish as described. After single-cell resuspension in 500 μL of blood buffer and filtration, 100 to 150 μL of the cells were spun into a double cytology funnel with a filter card (Fisher Scientific), for 5 minutes at 500 rpm and medium acceleration in a Shandon Cytospin Centrifuge, and stained with modified Wright-Giemsa stain (Sigma Aldrich). Three random high-power fields (200×) were photographed for quantification per sample.
In situ hybridization
We followed previously published whole embryo in situ hybridization protocols.20-22 The following probes were used: runx1,23 mpx,24 cmyb,25 fli1, pu.1, rag1,26 and mrc1a using the following primers: GTGTCCCCTCATCAATGCCA (forward) and ACGGCATTCCACAAACCAGA (reverse). The embryos were scored based on individual clutches and were genotyped after scoring.
qRT-PCR
Expression of gata2a in sorted progenitor-precursor cells was detected using Cells-to-CT 1-Step TaqMan Kit (ThermoFisher Scientific). Progenitor-precursor cells were sorted into 500 μL PBS with 50% FBS, spun down at 350g for 5 minutes at 4°C, and resuspended in ice-cold 1× PBS as per manufacturer’s recommendation. RT reaction was performed as per kit protocol using 10 μL of lysis. Quantitative PCR (qPCR) was performed using 20% of complementary DNA reaction from RT, with TaqMan probe and primer mixes for gata2a (Dr03086718_m1, FAM) and actb1 (Dr03432610_m1, VIC), with 2× TaqMan Gene Expression Master mix (Applied Biosystems). qPCR reactions in triplicate were performed with the following program: 50°C, 2 minutes; 96°C, 10 minutes (95°C, 15 seconds; 60°C, 1 minute) × 40 cycles.
Allogeneic marrow cell transplantation
Three-month-old recipient casper zebrafish were irradiated on days −2 and −1 with a 32- to 34-Gy split over 2 days. On day 0, marrow cells were harvested from the donor wild-type, gata2bhet, and gata2bko zebrafish, as well as from wild-type AB or Tübingen strains (4 to 6 months old) as helper marrow, as described above. Each donor’s total marrow cells were equally divided between 5 and 12 casper recipients in 5 independent transplantation experiments with a total of 7 wild-type, 20 gata2bhet, and 21 gata2bko donors. Marrow cells were collected in 500 μL of blood buffer and washed once with 1× PBS. Helper marrow cells were pooled together and equally divided for each recipient. We retroorbitally injected 2.5 μL of cell suspension of donor and helper cell mix per recipient zebrafish. In 2 of the 5 experiments, donor cells were counted; 9200 to 13 000 or 123 000 to 387 000 cells per recipients were injected, with 144 000 helper cells in the latter experiment. Survival of recipient zebrafish ranged from 20% to 74%. Engraftment was defined at ≥1% dTomato+ cells in the total marrow of the recipient by flow cytometry. Only recipient zebrafish with ≥10% engraftment were used to analyze qualitative hematopoietic output in the marrow.
scATAC-seq and analysis
Unsorted marrow cells were used in 2 approaches of scATAC-seq: 1 method used in Buenrostro’s laboratory called sciATAC-seq,27 and the other method using 10× Genomics scATAC-seq platform. Results from both methods (total of 10 individual specimens) were merged for peak calling and cell-type clustering (Figure 2A). To remove potential computational and experimental variables from different platforms, the analysis was performed only on 10× Genomics samples given matching age to scRNA-seq and sample numbers. One wild-type and 1 gata2bko zebrafish were used for sciATAC-seq (11 months old), and 3 wild-type, 2 gata2bhet, and 3 gata2bko zebrafish were used for 10× Genomics scATAC-seq (3 months old); however, both gata2bhet and 1 wild-type zebrafish from the 10× Genomics scATAC-seq run which had low numbers of cells (441 cells) after quality control filtration, were omitted from the analysis. The details of the processing and analysis are in supplemental Methods.
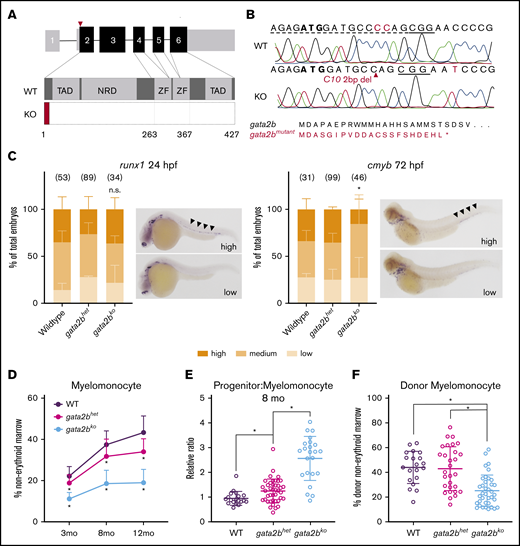
Generation and characterization of developmental and adult hematopoiesis of gata2b mutant zebrafish. (A) Schematic of the gata2b gene with 6 exons. CRISPR gRNA (red triangle) targets in exon 2. KO, gata2bko; NRD, negative regulatory domain; TAD, transactivating domain; WT, wild-type; ZF, zinc finger. (B) CRISPR edit in gata2bko zebrafish at position C10. Dotted line = gRNA sequence; solid line = PAM site. Predicted gata2b mutant protein shown. (C) In situ hybridizations of embryos from gata2bhet in cross for runx1 at 24 hpf (n = 3 clutches), and cmyb at 72 hpf (n = 4 clutches). Bar graphs quantify proportion of embryos (mean ± standard deviation) in blindly scored categories shown in representative images; areas of interest marked by black arrowheads. Number of embryos in each genotype is shown. *P < .02 by unpaired 2-tailed Student t test, gata2bhet (high) vs gata2bko (high); n.s., not significant. (D) Quantification of marrow myelomonocytes in WT, gata2bhet, and gata2bko zebrafish. *P < .03 compared with WT and/or gata2bhet, 1-way ANOVA. WT, n = 18, 19, and 23; gata2bhet, n = 76, 41, and 75; gata2bko, n = 48, 23, and 51, at 3 months, 8 months, and 12 months, respectively. (E) Relative ratio of progenitors to myelomonocytes in the marrow at 8 months. *P < .02, unpaired 2-tailed Student t test, n = 19 WT, n = 41 gata2bhet, n = 23 gata2bko. (F) Quantification of myelomonocytes in the donor cells of whole marrow cell transplantation recipients. Recipients with at least 10% donor engraftment were analyzed. *P < .0001 for WT or gata2bhet vs gata2bko, 1-way ANOVA, n = 20 WT, n = 29 gata2bhet, n = 37 gata2bko recipients.
Generation and characterization of developmental and adult hematopoiesis of gata2b mutant zebrafish. (A) Schematic of the gata2b gene with 6 exons. CRISPR gRNA (red triangle) targets in exon 2. KO, gata2bko; NRD, negative regulatory domain; TAD, transactivating domain; WT, wild-type; ZF, zinc finger. (B) CRISPR edit in gata2bko zebrafish at position C10. Dotted line = gRNA sequence; solid line = PAM site. Predicted gata2b mutant protein shown. (C) In situ hybridizations of embryos from gata2bhet in cross for runx1 at 24 hpf (n = 3 clutches), and cmyb at 72 hpf (n = 4 clutches). Bar graphs quantify proportion of embryos (mean ± standard deviation) in blindly scored categories shown in representative images; areas of interest marked by black arrowheads. Number of embryos in each genotype is shown. *P < .02 by unpaired 2-tailed Student t test, gata2bhet (high) vs gata2bko (high); n.s., not significant. (D) Quantification of marrow myelomonocytes in WT, gata2bhet, and gata2bko zebrafish. *P < .03 compared with WT and/or gata2bhet, 1-way ANOVA. WT, n = 18, 19, and 23; gata2bhet, n = 76, 41, and 75; gata2bko, n = 48, 23, and 51, at 3 months, 8 months, and 12 months, respectively. (E) Relative ratio of progenitors to myelomonocytes in the marrow at 8 months. *P < .02, unpaired 2-tailed Student t test, n = 19 WT, n = 41 gata2bhet, n = 23 gata2bko. (F) Quantification of myelomonocytes in the donor cells of whole marrow cell transplantation recipients. Recipients with at least 10% donor engraftment were analyzed. *P < .0001 for WT or gata2bhet vs gata2bko, 1-way ANOVA, n = 20 WT, n = 29 gata2bhet, n = 37 gata2bko recipients.
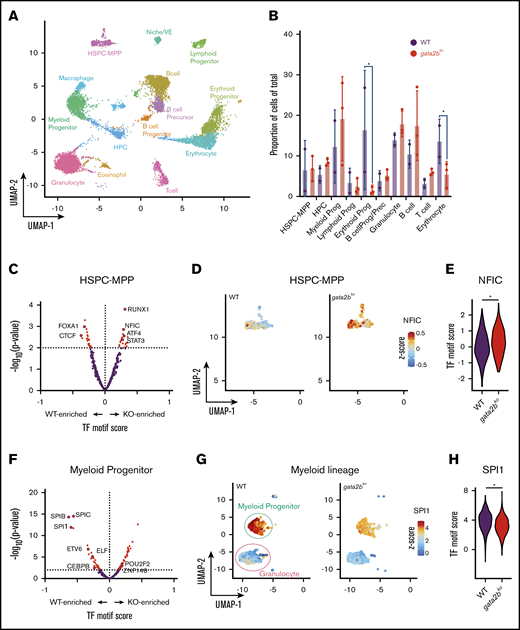
scATAC-seq reveals epigenetic changes associated with decreased myelomonocytic priming in gata2b mutants. (A) Uniform manifold approximation and projection (UMAP) of marrow cells in WT (n = 2), gata2bhet (n = 2), and gata2bko (n = 3). 10× Genomics scATAC-seq data are shown. BcellProg/Prec, B-cell progenitors and precursors; VE, vascular endothelium. (B) Quantification of hematopoietic cell types from scATAC-seq in WT and gata2bko zebrafish. *P < .05, Fisher’s exact test. (C) Differential TF motif score analysis between WT and gata2bko (KO) samples within HSPC-MPP population. (D) Feature plots of WT and gata2bko samples for NFIC motif score within individual cells in the HSPC-MPP population. (E) Violin plot of NFIC TF motif score in WT and gata2bko HSPC-MPPs. *P = .0014, 2-tailed Student t test. (F) Differential TF motif score analysis between WT and gata2bko (KO) samples within myeloid progenitors. (G) Feature plots of WT and gata2bko samples for SPI1 motif score within individual cells in the myeloid progenitor and granulocyte populations. (H) Violin plot of SPI1 TF motif score in WT and gata2bko myeloid progenitors. *P = 1.31 × 10⁻¹², 2-tailed Student t test.
scATAC-seq reveals epigenetic changes associated with decreased myelomonocytic priming in gata2b mutants. (A) Uniform manifold approximation and projection (UMAP) of marrow cells in WT (n = 2), gata2bhet (n = 2), and gata2bko (n = 3). 10× Genomics scATAC-seq data are shown. BcellProg/Prec, B-cell progenitors and precursors; VE, vascular endothelium. (B) Quantification of hematopoietic cell types from scATAC-seq in WT and gata2bko zebrafish. *P < .05, Fisher’s exact test. (C) Differential TF motif score analysis between WT and gata2bko (KO) samples within HSPC-MPP population. (D) Feature plots of WT and gata2bko samples for NFIC motif score within individual cells in the HSPC-MPP population. (E) Violin plot of NFIC TF motif score in WT and gata2bko HSPC-MPPs. *P = .0014, 2-tailed Student t test. (F) Differential TF motif score analysis between WT and gata2bko (KO) samples within myeloid progenitors. (G) Feature plots of WT and gata2bko samples for SPI1 motif score within individual cells in the myeloid progenitor and granulocyte populations. (H) Violin plot of SPI1 TF motif score in WT and gata2bko myeloid progenitors. *P = 1.31 × 10⁻¹², 2-tailed Student t test.
scRNA-seq and analysis
Marrow cells in the lymphocyte/HSPC and progenitor-precursor gates (supplemental Figure 2A) were individually sorted from 3 wild-type, 2 gata2bhet, and 3 gata2bko zebrafish (4 months old), collected in 300 μL 1× PBS with 0.04% bovine serum albumin (Gemini Bio-Products), and processed every 45 to 60 minutes. The sorted samples were processed by the Harvard Medical School Single Cell core (https://singlecellcore.hms.harvard.edu/) using inDrops single-cell barcoding and sequencing methods. Gata2bhet cells were used for clustering and identifying cell types but were omitted from the final analysis. The details of the processing and analysis are in supplemental Methods.
Pseudotime trajectory analysis
Trajectory inference and pseudotime calculations were performed using Monocle3 on scRNA-seq Seurat object using published github code from http://htmlpreview.github.io/?https://github.com/satijalab/seurat-wrappers/blob/master/docs/monocle3.html.28 Partition connection was forced between clusters that were not connected by default. This resulted in some unexpected trajectory connections, such as between HSPCs directly to macrophages, or T cells to B cells, which are likely due to computational processing.
Gene set enrichment analysis
All genes with ln-fold change >0.1 from FindMarkers differential expression analysis in scRNA-seq between wild-type and gata2bko zebrafish within myeloid progenitors and lymphoid progenitors were converted to human orthologs using the DIOPT tool (https://www.flyrnai.org/diopt). One human ortholog per gene was used for duplicated genes in zebrafish, and a few were omitted that did not have a human ortholog. Gene set enrichment analysis (GSEA) preranked analysis was run with the following settings: gene sets database: h.all.v7.1.symbols.gmt (Hallmarks), number of permutations: 1000, enrichment statistic: weighted, mix/max size of overlap: 15 to 500, default settings for advanced fields.
GATA2 ChIP-seq in CD34+ cells
Experimental details are described by Choudhuri and colleagues.29 Briefly, human CD34+ cells were purchased from the Fred Hutchinson Cancer Research Center and maintained as previously described.30 After 6 days of expansion, the cells were stimulated for 2 hours with rhBMP4 (R&D) at a final concentration of 25 ng/mL and harvested for performing chromatin immunoprecipitation with sequencing (ChIP-seq), with GATA2 antibody (Santa Cruz).31 The ChIP-Seq dataset was aligned to UCSC build version hg19 of the human genome using Bowtie2 (version 2.2.1)32 with the following parameters: -end-to-end, -N0, -L20. We used the MACS2 version 2.1.033 peak-finding algorithm to identify regions of ChIP-Seq peaks, with a q-value threshold of enrichment of 0.05 for all datasets. Annotation was performed using ChIPseeker version 1.12.1.34 Overlap of GATA2-bound genes in ChIP-seq and human orthologs of differentially expressed genes in lymphoid progenitors was determined using a Venn diagram (bioinformatics.psb.ugent.be/webtools/Venn), and pathway analysis was performed using Metascape gene annotation and analysis resource (metascape.org).
Quantification and statistical analysis
Data are presented as mean ± standard deviation. N refers to biological replicates. P < .05 was considered statistically significant. Prism software (GraphPad software) or Excel (Microsoft) was used for statistical analyses. Data significance was analyzed using an unpaired 2-tailed Student t test, 1-way analysis of variance (ANOVA) or Fisher’s exact test as detailed in the figure legends.
Results
Genetic knockout of gata2b has mild effects on developmental hematopoiesis but leads to myelomonocytopenia in adulthood
To study the role of gata2b in adult hematopoiesis, we generated CRISPR mutants using gRNAs targeting exon 2 of the gene (Figure 1A). We isolated a zebrafish line with a 2-base-pair deletion resulting in a predicted truncated 22-amino-acid protein, lacking all critical functional domains of Gata2b (Figure 1B; supplemental Figure 1A-B). We evaluated the gata2b exon2 CRISPR mutant (referred hereafter as gata2bhet or gata2bko) embryos for developmental hematopoietic phenotypes using in situ hybridizations probing various lineage-specific genes. We found no difference in runx1 expressing hemogenic endothelium at 24 hours postfertilization (hpf) or HSPCs at 48 hpf in gata2b mutant embryos (Figure 1C; supplemental Figure 1D). Expression of fli1 in the endothelium at 24 hpf was also normal (supplemental Figure 1D). Hematopoietic progenitor cells (HPCs), marked by cmyb expression,35 decreased by 72 hpf (Figure 1C), suggesting a worsening phenotype in gata2bko embryos as definitive hematopoiesis was established. Loss of gata2a in addition to gata2b exacerbated the decrease of cmyb expression at 72 hpf, such that more than half of gata2ako;gata2bko embryos had no cmyb expressing cells with all remaining ones showing only moderate expression (supplemental Figure 1A-C). Primitive myeloid differentiation appeared to be normal at early time points with comparable pu.1 expression at 24 hpf; however, by 48 hpf, there was a significant decrease in mpx expressing myeloid cells arising predominantly from the primitive hematopoietic wave (supplemental Figure 1D). We did not detect any effect of gata2b loss on definitive lymphoid development marked by rag1 expressing thymocytes at 96 hpf (supplemental Figure 1D). Within the lymphovascular compartment, with primarily gata2a expression,13 mrc1a expression was comparable between gata2b mutants and wild-type embryos (supplemental Figure 1D). These data suggested that germline loss of gata2b resulted in a mild decrease in cmyb+ definitive progenitor cells but had no effect on hemogenic endothelium and definitive HSPC specification, and embryonic lymphopoiesis.
We next analyzed the adult hematopoiesis of gata2bko zebrafish starting at 3 months36 (supplemental Figure 2A-B). Gata2bko zebrafish survived to adulthood with an expected Mendelian ratio and did not appear to have any gross morphologic abnormalities (supplemental Figure 2C). They had comparable total marrow cell count (supplemental Figure 2D). Flow cytometric analysis of marrow cells showed marked myelomonocytopenia in gata2bko zebrafish that worsened with age (Figure 1D; supplemental Figure 2B). Mild, progressive myelomonocytopenia was also seen in gata2bhet zebrafish (Figure 1D). The decrease in myelomonocytes was associated with an increase of immature progenitor cells by flow cytometry and morphology (Figure 1E; supplemental Figure 2E-F). In the zebrafish marrow, these progenitors are largely myeloid precursors; thus, the decrease of mature cells with an associated increase of immature compartment suggested a differentiation arrest of the myeloid lineage. The lymphocyte-HSPC compartment of the marrow, which includes a diverse population of mature lymphocytes, immature lymphoid progenitors, and HSPCs, remained intact in gata2bko zebrafish and increased in its relative proportion over time concomitant with myelomonocytopenia (supplemental Figure 3A). We observed a similar progressive myelomonocytopenia in a second independent gata2b mutant line, with a loss of DNA-binding zinc-finger domains (gata2b exon 4 mutant; supplemental Figure 1A-B and 3B). There was no compensatory increase in gata2a expression within sorted gata2bko marrow progenitor cells by qRT-PCR (supplemental Figure 3C). Moreover, marrow cell analysis of gata2a mutant zebrafish showed normal adult myelopoiesis over time (supplemental Figure 3D). Gata2a is critical for early embryogenesis, such that the gata2a homozygous mutants (gata2ako) do not survive to adulthood (supplemental Figure 3D). In gata2ahet;gata2bhet intercrosses, we observed significantly decreased presence of gata2ako adult zebrafish from the expected Mendelian ratio, although this was improved from the occurrence of gata2ako zebrafish from a gata2ahet;gata2bWT intercross (supplemental Figure 3E). Loss of gata2a did not further alter the myelomonocytopenia in adult gata2b-deficient marrow (supplemental Figure 3F). To test the cell autonomous nature of the myelomonocytopenia in gata2bko zebrafish, we performed whole marrow transplantation assays. We observed a similarly reduced myelomonocytic compartment in wild-type recipients of gata2bko total marrow cells, with a trend toward reduced engraftment efficiency (Figure 1F; supplemental Figure 3G-H). These data showed that gata2b loss resulted in a myelomonocytopenia with expanded progenitors suggestive of a dose-dependent attenuation of myeloid differentiation. The effect was cell autonomous and was observed in 2 independent gata2b mutant zebrafish lines.
scATAC-seq identifies changes in chromatin accessibility in distinct cell populations in gata2bko marrow
As a TF, GATA2 binds to DNA and has well-characterized chromatin occupancy in various hematopoietic cell types in mammals.3,37,38 We hypothesized that a complete loss of gata2b would affect chromatin accessibility in hematopoietic progenitors and alter lineage specification via epigenetic dysregulation. To test this, we performed scATAC-seq on unsorted wild-type (n = 2; 3778 cells) and gata2bko (n = 3; 2981 cells) adult marrow cells (supplemental Figure 4A-D). Cluster identities were defined using a chromatin accessibility measurement in the gene body and promoter (referred to as genescore) of lineage-defining genes (Figure 2A-2B; supplemental Table 1; supplemental Figure 4E-F). Unsupervised hierarchical clustering using TF score, a measure of chromatin accessibility of peaks with presence of TF binding motif, identified similar clusters (supplemental Figure 4G).
To identify enrichment of TF motifs, we calculated differential TF motif scores in wild-type and gata2bko cells. HSPC-multipotent progenitors (HSPC-MPPs) in gata2bko zebrafish were enriched for NFIC motif, a TF implicated in lineage decisions of early progenitors,39 as well as for ATF4 and STAT3 motifs, suggesting increased cellular stress (Figure 2C-E).40 Within the myeloid progenitors, we noted significant depletion for SPI motifs in gata2bko cells compared with wild-type, consistent with decreased myelopoiesis (Figure 2F-H). Other myeloid TF motifs, such as CEBPB and ETV6, were also depleted in gata2bko myeloid progenitors (Figure 2F; supplemental Figure 5A-B). In contrast, enrichment of early B-lineage defining TF motif scores was observed in gata2bko HPCs, which are more differentiated but not lineage-committed progenitors, including SPI1, IRF4, and BACH2 (Figure 3A-C), and B-cell lineage-committed progenitors and precursors, including IRF4, BCL11A, and SPIB (Figure 3D-F; supplemental Figure 5D-H). In contrast, TF motif scores associated with late B-cell differentiation, such as PAX5, were reduced in B-cell precursor and mature B-cell clusters (supplemental Figure 5G-H). These data suggested that gata2b loss had significant effects on epigenetic states of early marrow progenitors.

Increased lymphoid epigenetic priming in gata2bkozebrafish by scATAC-seq. (A) Differential TF motif score analysis between WT and gata2bko (KO) zebrafish within HPC population. (B) Feature plots of WT and gata2bko samples for SPI1 motif score within individual cells in the HPC population. (C) Violin plot of SPI1 TF motif score in WT and gata2bko HPCs. *P = 1.68 × 10⁻⁵, 2-tailed Student t test. (D) Differential TF motif score analysis between WT and gata2bko samples within B lineage (LP, LymphProg, B-cell progenitor and precursors, and mature B cells). (E) Feature plots of WT and gata2bko samples for IRF4 motif score within individual cells in lymphoid lineage. (F) Violin plot of IRF4 TF motif score in WT and gata2bko B-cell precursors. *P = 8.37 × 10⁻⁶, 2-tailed Student t test.
Increased lymphoid epigenetic priming in gata2bkozebrafish by scATAC-seq. (A) Differential TF motif score analysis between WT and gata2bko (KO) zebrafish within HPC population. (B) Feature plots of WT and gata2bko samples for SPI1 motif score within individual cells in the HPC population. (C) Violin plot of SPI1 TF motif score in WT and gata2bko HPCs. *P = 1.68 × 10⁻⁵, 2-tailed Student t test. (D) Differential TF motif score analysis between WT and gata2bko samples within B lineage (LP, LymphProg, B-cell progenitor and precursors, and mature B cells). (E) Feature plots of WT and gata2bko samples for IRF4 motif score within individual cells in lymphoid lineage. (F) Violin plot of IRF4 TF motif score in WT and gata2bko B-cell precursors. *P = 8.37 × 10⁻⁶, 2-tailed Student t test.
We next compared chromatin accessibility around gene bodies using the genescores to assess for changes with gata2b loss in lineage-defining genes. We noted a reduced genescore in boka, an HSPC marker in zebrafish,41 within gata2bko HSPC-MPPs (Figure 4A). Reduced chromatin accessibility was observed around cebpa and gata2b, consistent with reduced myeloid priming TF motif scores in gata2bko myeloid progenitors (Figure 4A). Within the B-cell precursors, lower rag1 and rag2 genescores were observed, in agreement with depletion of late B-lineage defining TFs (Figure 4A). The reduced myeloid program was further supported by decreased accessibility around mature myeloid genes, such as lyz and mpx (Figure 4B). In mature B cells, we noted a reduced mpeg1.1 genescore, a marker of B cells in adult zebrafish,42 whereas no change was observed in lck, a marker of mature T cells (Figure 4B). Changes in chromatin accessibility were also noted in peaks >2 kb upstream or downstream of the gene body, suggesting effects on distal elements that can be more cell-type specific (supplemental Figure 5C).38
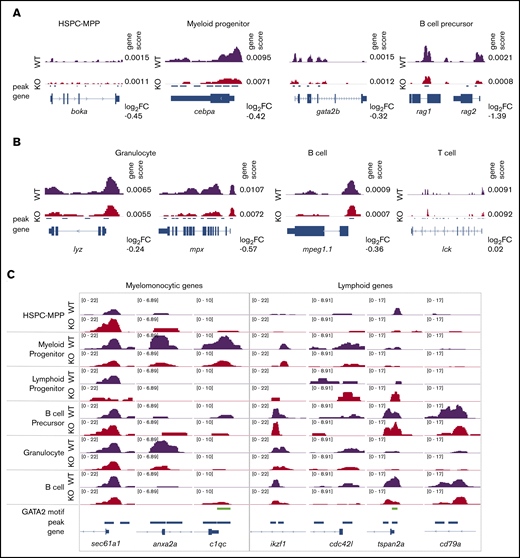
Gata2b loss results in differential chromosome accessibility in lineage-defining loci. (A) Example of scATAC-seq tracks of cell identity defining genes for immature hematopoietic cells. (B) Example of scATAC-seq tracks of cell identity defining genes for mature hematopoietic cells. Genescore denotes chromatin accessibility of the gene body and 2 kb above transcriptional start site. Log2 fold-change (FC) of genescores in KO vs WT samples shown. (C) Examples of scATAC-seq peaks for select genes in WT and gata2bko samples. 10× Genomics scATAC-seq normalized tracks shown; GATA2 motif tracks show presence of GATAAG sequence.
Gata2b loss results in differential chromosome accessibility in lineage-defining loci. (A) Example of scATAC-seq tracks of cell identity defining genes for immature hematopoietic cells. (B) Example of scATAC-seq tracks of cell identity defining genes for mature hematopoietic cells. Genescore denotes chromatin accessibility of the gene body and 2 kb above transcriptional start site. Log2 fold-change (FC) of genescores in KO vs WT samples shown. (C) Examples of scATAC-seq peaks for select genes in WT and gata2bko samples. 10× Genomics scATAC-seq normalized tracks shown; GATA2 motif tracks show presence of GATAAG sequence.
We performed further comparison of differential peaks across hematopoietic differentiation from HSPCs to mature cells (Figure 4C). We found increased chromatin accessibility in gata2bko HSPC-MPPs in sec61a1, a gene associated with neutrophil function,43 and reduced peaks in genes like anxa2a and c1qc, expressed by monocytes and macrophages.41 Conversely, although gata2bko early lymphoid progenitors showed increased peaks for ikzf1 and cdc42l, important for B-cell specification, mature B cells in gata2bko zebrafish exhibited reduced peaks at tspan2a and cd79a, genes expressed for terminal B-cell function (Figure 4C).44 These data showed that loss of gata2b had a differential effect on the chromatin landscape in a lineage-specific manner. It resulted in reduced myelomonocytic priming, which was consistent with the marrow phenotype observed in gata2bko zebrafish. In the lymphoid lineage, gata2b loss increased B-cell lymphoid priming in early progenitors but was associated with reduced lymphoid gene accessibility in maturing B-cell populations.
scRNA-seq reveals attenuated myelomonocytic differentiation
We next assessed gene expression changes in gata2bko zebrafish marrow cells to corroborate our scATAC-seq findings. We performed scRNA-seq on wild-type and gata2bko adult zebrafish using sorted marrow cells to enrich for immature progenitors-precursors and lymphocytes/HSPCs (supplemental Figure 2A). We analyzed sorted marrow cells from wild-type (n = 3; 5284 cells) and gata2bko (n = 3; 4557 cells) clutchmates (inDrops; Figure 5A; supplemental Figure 6A-B). Cell types were identified based on their transcriptional profile and confirmed by inferred differentiation trajectory with pseudotime mapping (supplemental Table 1; supplemental Figure 6C-D).41 We observed comparable frequencies of HSPCs, MPPs, erythroid, and lymphoid progenitors (Figure 5B; supplemental Figure 6E). Gata2bko zebrafish had significantly increased myeloid progenitors (Figure 5B), both early (myeloid progenitor 1) and more committed (myeloid progenitor 2) progenitors, confirming flow cytometric and morphologic observation of increased progenitor to myelomonocyte ratio.
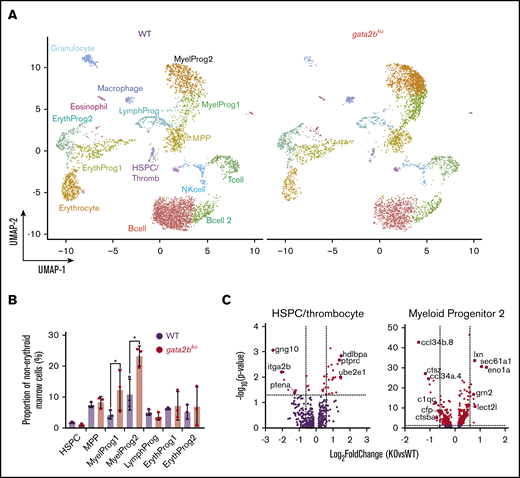
scRNA-seq reveals loss of monocytic program in gata2bkozebrafish. (A) Split UMAP of marrow cells in WT (n = 3) and gata2bko (n = 3) sorted marrow cells (inDrops). ErythProg, erythroid progenitor; LymphProg, lymphoid progenitor; MyelProg1 and 2, myeloid progenitor; Thromb, thrombocytes. (B) Quantification of immature hematopoietic cell types from scRNA-seq in WT and gata2bko zebrafish within the erythrocyte-deplete marrow. *P < .05, Fisher’s exact test. (C) Volcano plots of differential expression of genes within HSPC and myeloid progenitor 2 populations between WT and gata2bko zebrafish. Dashed lines depict log2 fold change of ±0.6 and −log10 (P value) of 1.3. NK, natural killer.
scRNA-seq reveals loss of monocytic program in gata2bkozebrafish. (A) Split UMAP of marrow cells in WT (n = 3) and gata2bko (n = 3) sorted marrow cells (inDrops). ErythProg, erythroid progenitor; LymphProg, lymphoid progenitor; MyelProg1 and 2, myeloid progenitor; Thromb, thrombocytes. (B) Quantification of immature hematopoietic cell types from scRNA-seq in WT and gata2bko zebrafish within the erythrocyte-deplete marrow. *P < .05, Fisher’s exact test. (C) Volcano plots of differential expression of genes within HSPC and myeloid progenitor 2 populations between WT and gata2bko zebrafish. Dashed lines depict log2 fold change of ±0.6 and −log10 (P value) of 1.3. NK, natural killer.
Analysis of differential gene expression in the marrow revealed several important findings. First, gata2bko HSPCs had reduced expression of itga2b (cd41) and ptena, critical for HSPC maintenance and self-renewal (Figure 5C).45,46 Within gata2bko myeloid progenitors, there were decreased monocytic and increased granulocytic programs. We observed downregulation of monocytic cytokines ccl34b.8 and ccl34a.4, and of genes, such as ctsz, c1qc, and ctsba, important for macrophage function, with upregulation of granulocytic genes, such as lxn, lect2l, sec61a1, and eno1a (Figure 5C). These changes suggested an early monocytic lineage specification defect in gata2bko hematopoiesis, a hallmark of GATA2 deficiency with monocytopenia in humans.4,5 GSEA performed within the myeloid progenitors revealed enrichment of hypoxia and TP53-related pathways in gata2bko cells, suggesting increased cellular stress (supplemental Figure 7A). Our data suggested that the myelomonocytopenia in gata2bko zebrafish was due to attenuated differentiation in myeloid progenitors, with affected monocytic specification and preserved granulopoietic program.
Gata2b loss increases lineage-specific transcriptional program in lymphoid progenitors but leads to B-cell lymphopenia
B-cell lymphopenia is a common cytopenia in patients with germline GATA2 deficiency.4,5 Analysis of mature cell frequencies in scRNA-seq revealed reduced mature B-cell frequency in gata2bko zebrafish, with no changes in mature T and natural killer cells (Figure 6A; *P < .05, Fisher’s exact test). We did not detect major gene expression changes within the mature B-cell population between wild-type and gata2bko zebrafish (supplemental Figure 7B). Thus, we reasoned that the defect underlying B-cell lymphopenia is present within the lymphoid progenitors and turned our attention to these cells. We noted that within wild-type marrow cells, lymphoid progenitors expressed gata2b (supplemental Figure 7C). Differential gene expression analysis of lymphoid progenitors in gata2bko zebrafish revealed increased expression of critical genes associated with B-cell development, including ikzf1, cdc42l, dtx4b, jam2a, and ighz (Figure 6B). Further subset analysis of lymphoid progenitors identified several B-cell developmental stages (supplemental Figure 7D-E) and showed a decrease in a subtype of B-cell precursor in gata2bko zebrafish (supplemental Figure 7F). GSEA of differentially expressed genes in the lymphoid progenitor population showed decreased pathways of oxidative phosphorylation (OxPhos) (false discovery rate [FDR] q value = 0), MYC targets (FDR q value = 0.0015), and fatty acid metabolism (FDR q value = 0.2002) in gata2b deficiency compared with wild-types (Figure 6C; supplemental Figure 7G-H). These data suggested that loss of gata2b affects lymphopoiesis at the developmental stage of B-cell precursors, resulting in B-cell lymphopenia.
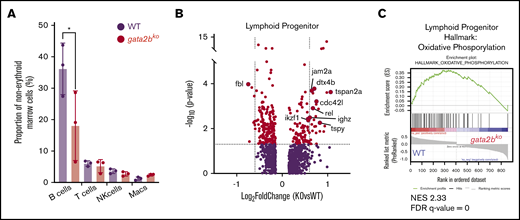
gata2bkozebrafish have increased lymphoid priming with incomplete B-cell development. (A) Quantification of mature hematopoietic cell types from scRNA-seq in WT and gata2bko zebrafish within the erythrocyte-deplete marrow. *P < .05, Fisher’s exact test. (B) Volcano plots of differential expression of genes within lymphoid progenitor cells between WT and gata2bko zebrafish. Dashed lines depict log2 fold change of ±0.6 and −log10 (P value) of 1.3. (C) Enrichment plot of oxidation-phosphorylation signature found highly depleted among differentially regulated genes of gata2bko lymphoid progenitor cells by GSEA. NES, normalized enrichment score.
gata2bkozebrafish have increased lymphoid priming with incomplete B-cell development. (A) Quantification of mature hematopoietic cell types from scRNA-seq in WT and gata2bko zebrafish within the erythrocyte-deplete marrow. *P < .05, Fisher’s exact test. (B) Volcano plots of differential expression of genes within lymphoid progenitor cells between WT and gata2bko zebrafish. Dashed lines depict log2 fold change of ±0.6 and −log10 (P value) of 1.3. (C) Enrichment plot of oxidation-phosphorylation signature found highly depleted among differentially regulated genes of gata2bko lymphoid progenitor cells by GSEA. NES, normalized enrichment score.
Epigenetic dysregulation underlies gene expression changes in gata2bko hematopoietic progenitors
We next addressed whether the gene expression changes seen in scRNA-seq were epigenetically regulated. To do this, we compared gene expression changes in scRNA-seq to change in genescores in scATAC-seq. Strong correlations between epigenetic and transcriptional changes were noted in HSPC-MPPs and myeloid progenitors, within HSPC identity and maintenance genes, such as itga2b and ptena, and monocyte/macrophage lineage-specific genes, such as c1qc and ctsba, respectively (Figure 7A-B). The association between the epigenetic and transcriptional states was not as direct within the lymphoid progenitors; however, the genes identified as critical for early B-cell lymphopoiesis were upregulated by scRNA-seq and had increased genescores by scATAC-seq (Figure 7C). We then performed a cross-species comparison between genes bound by GATA2 in human CD34+ cells by ChIP-seq and genes that were differentially regulated in gata2bko lymphoid progenitors to identify genes or pathways directly affected by loss of gata2b. One of the top terms included hemopoiesis, with genes that have a critical role in B-cell lymphopoiesis, including ikzf1, jak2a, mta3,47 and hspa9.48 Another top-ranking term was OxPhos, also strongly implicated in B-cell development.49 These data show that loss of gata2bko altered critical gene expression programs in early myeloid and lymphoid progenitors via epigenetic regulation.
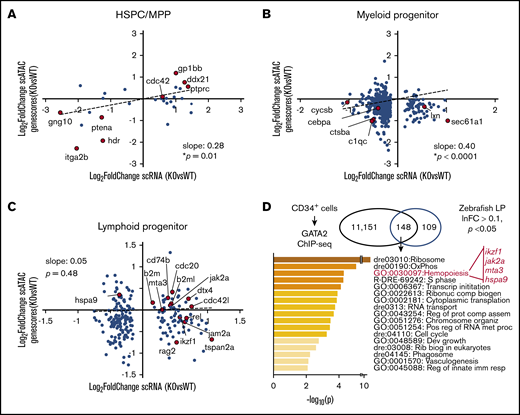
Single-cell epigenetic and transcriptional analyses reveal epigenetic changes regulating gene expression with gata2b loss. Scatter plots of gene expression change in scRNA-seq (log2 fold-change, gata2bko vs WT) and genescore change in scATAC-seq (log2 fold-change, gata2bko vs WT) in (A) HSPC-MPPs (HSPC/thromb vs HSPC-MPP), (B) myeloid progenitors (MyelProg1 vs Myeloid progenitor), and (C) lymphoid progenitors (LymphProg vs HPC). P values are shown for linear regression analysis. (D) Gene annotation and pathway identification within overlap genes between GATA2 bound genes in CD34+ cells via ChIP-sequencing (11 151 genes) and differentially expressed (DE) genes in lymphoid progenitors (LP) with sc-RNA-seq. Of 298 DE genes in LP, 257 with human orthologs were compared. Within the “hemopoiesis” gene ontology (GO) term, the gene list included those critical in B lymphopoiesis.
Single-cell epigenetic and transcriptional analyses reveal epigenetic changes regulating gene expression with gata2b loss. Scatter plots of gene expression change in scRNA-seq (log2 fold-change, gata2bko vs WT) and genescore change in scATAC-seq (log2 fold-change, gata2bko vs WT) in (A) HSPC-MPPs (HSPC/thromb vs HSPC-MPP), (B) myeloid progenitors (MyelProg1 vs Myeloid progenitor), and (C) lymphoid progenitors (LymphProg vs HPC). P values are shown for linear regression analysis. (D) Gene annotation and pathway identification within overlap genes between GATA2 bound genes in CD34+ cells via ChIP-sequencing (11 151 genes) and differentially expressed (DE) genes in lymphoid progenitors (LP) with sc-RNA-seq. Of 298 DE genes in LP, 257 with human orthologs were compared. Within the “hemopoiesis” gene ontology (GO) term, the gene list included those critical in B lymphopoiesis.
Discussion
Here, we describe a novel zebrafish germline mutant of gata2b that recapitulated cytopenias characteristic of individuals with GATA2 deficiency syndrome. Using single-cell chromatin accessibility and transcriptional assays, we revealed contrasting effects of gata2b loss in myeloid and lymphoid lineages that led to these cytopenias. The myelomonocytopenia in our gata2b mutants was apparent as early as 3 months and worsened with age, unaffected by additional loss of gata2a. The analysis of scATAC-seq showed that epigenetic changes with loss of chromatin accessibility of myeloid TF motifs in gata2bko cells underlie this myelomonocytopenia. These changes also related to profound transcriptional effects of gata2b loss within myeloid progenitors with a significant left-shift toward immature states. Within myeloid progenitors, a significant imbalance was evident in myelopoiesis biased toward granulocytes at the expense of monocytic differentiation. The attenuation of differentiation at the myeloid progenitor stage and the heightened cellular stress are potentially related to the early onset risk of myeloid malignancies associated with GATA2 deficiency syndrome.4,50 We did not observe any overt leukemoid phenotype in the gata2b mutants at any age studied. This could be related to the intact gata2a expression, unlike in gata2a intron 4 mutants where both gata2a and gata2b expression is reduced at least during embryogenesis.51 Additional factors such as environmental differences in zebrafish facilities affecting infectious and inflammatory insults may play a role as well.
Loss of gata2b resulted in an accumulation of B-cell lineage-specific TF motifs within the accessible chromatin in lymphoid progenitors, which was precipitously lost in differentiating B-cell precursors and mature B cells. This bottleneck epigenetic signature resulted in incomplete B-cell lymphopoiesis. Differential gene analysis revealed dysregulation of OxPhos and other metabolic pathways, critical for pro– to pre–B-cell transition.52,53 Several B-cell lineage TFs, such as PAX5, IKZF1, and EBF1, have been proposed to be environmental sensors of the metabolic state of the cell.49,54 Gata2b loss affected the expression or the chromatin accessibility for the binding of these factors, potentially indirectly affecting their function in providing the appropriate transcriptionally driven metabolic environment for B-cell development.
Gata2b mutants showed an epigenetic and transcriptional profile of reduced HSPC maintenance with increased cellular stress. Although our analysis did not reach statistical significance, and with the limitation of nonisogenic zebrafish transplantations, there was a clear trend toward reduced engraftment efficiency of total gata2bko marrow cells, a phenotype consistent with reduced HSPC function in the Gata2+/− mice7 and bone marrow failure in GATA2 deficiency syndrome.55 Future studies on the relation of GATA2 loss on HSPCs and lineage-restricted progenitors will be critical for understanding the pathophysiology of aplasia, infections, and increased risk of hematologic malignancies.
In summary, our work demonstrates the multifaceted effects of germline gata2b loss in adult hematopoiesis through combinatorial single-cell epigenomic and transcriptomic analyses. We propose that GATA2 is not only tightly embedded in the myeloid and lymphoid lineage specification circuits, but it has a pivotal role in their regulation. Understanding the interface of this regulation will provide therapeutic opportunities for prevention and treatment of bone marrow failure and hematologic malignancies associated with GATA2 deficiency syndrome.
The data reported in this article have been deposited in the Gene Expression Omnibus database (accession number GSE151232).
Zebrafish lines generated in this study are available with a completed Materials Transfer Agreement. The raw sequencing reads of single-cell ATAC and single-cell RNA sequencing generated and analyzed in this study have been deposited in the Gene Expression Omnibus with the primary accession code GSE151232.
Acknowledgments
The authors thank Jeff Mito for his assistance with sciATAC-seq, Chloé Baron for her assistance with Monocle3 analysis, Elliott Hagedorn for his assistance with designing the mrc1a probe, and Avik Choudhuri for sharing GATA2 ChIP-seq data for comparison. The authors thank many of their colleagues for their discussions and critical reading of the manuscript.
Funding for this study was provided by the Potter Award, Pedals for Pediatrics Award, Edward P. Evans Foundation Young Investigator Award, and Alex’s Lemonade Stand Foundation Young Investigator Award (S.A.). L.I.Z. is a Howard Hughes Medical Institute Investigator.
Authorship
Contribution: S.A. designed the study, conducted experiments, and analyzed data; M.C.W. performed in situ hybridizations and characterization of mutant lines; S.M. performed the bioinformatics analysis; M.P. performed the presentation of scATAC-seq; S.Y. performed mapping of scATAC-seq and scRNAseq to zebrafish genome, and the bioinformatics analysis of CD34+ ChIP-seq; W.P.M. assisted with the generation of the CRISPR mutant lines; S.A., J.D.B., and L.I.Z. supervised the study; S.A. and L.I.Z. wrote the manuscript; and all authors provided feedback.
Conflict-of-interest disclosure: L.I.Z. is a founder and stockholder of Fate Therapeutics, CAMP4 Therapeutics, and Scholar Rock, outside the submitted work. The remaining authors declare no competing financial interests.
Correspondence: Leonard I. Zon, Boston Children's Hospital, 1 Blackfan Cir, Karp 5211, Boston, MA 02115; e-mail: zon@enders.tch.harvard.edu.

