

Key Points
Comprehensive proteomics resource comparing the noncellular compartment of AML and healthy human BM, paired with RNA-sequencing.
Proteomic analysis (>1300 targets) showed that 168 extracellular proteins significantly differed in BM between AML and healthy donors.

Abstract
Acute myeloid leukemia (AML) is a genetically heterogeneous disease that is characterized by abnormal clonal proliferation of myeloid progenitor cells found predominantly within the bone marrow (BM) and blood. Recent studies suggest that genetic and phenotypic alterations in the BM microenvironment support leukemogenesis and allow leukemic cells to survive and evade chemotherapy-induced death. However, despite substantial evidence indicating the role of tumor–host interactions in AML pathogenesis, little is known about the complex microenvironment of the BM. To address this, we performed novel proteomic profiling of the noncellular compartment of the BM microenvironment in patients with AML (n = 10) and age- and sex-matched healthy control subjects (n = 10) using an aptamer-based, highly multiplexed, affinity proteomics platform (SOMAscan). We show that proteomic assessment of blood or RNA-sequencing of BM are suboptimal alternate screening strategies to determine the true proteomic composition of the extracellular soluble compartment of AML patient BM. Proteomic analysis revealed that 168 proteins significantly differed in abundance, with 91 upregulated and 77 downregulated in leukemic BM. A highly connected signaling network of cytokines and chemokines, including IL-8, was found to be the most prominent proteomic signature associated with AML in the BM microenvironment. We report the first description of significantly elevated levels of the myelosuppressive chemokine CCL23 (myeloid progenitor inhibitory factor-1) in both AML and myelodysplastic syndrome patients and perform functional experiments supportive of a role in the suppression of normal hematopoiesis. This unique paired RNA-sequencing and proteomics data set provides innovative mechanistic insights into AML and healthy aging and should serve as a useful public resource.
Introduction
Acute myeloid leukemia (AML) is a complex oligoclonal and genetically heterogeneous disease characterized by the abnormal proliferation of immature myeloid cells. This accumulation of leukemic blasts within the bone marrow (BM) and peripheral blood (PB) is often accompanied by the failure of normal hematopoiesis.1,2 Although a morphologic complete remission is achieved in most patients after standard intensive chemotherapy, approximately two-thirds of the patients remain at risk of relapse due to the persistence of low-level residual disease.3,4 The BM microenvironment is presumed to contribute to leukemic relapse, as the interaction of residual leukemic stem cells with stromal components of the BM niche favors their survival and mediates their resistance to chemotherapy.5-11 However, despite the key role of BM microenvironment during the initiation, progression, and treatment response of AML, the detailed nature and dynamics of niche–leukemic cell interactions that permit leukemia growth are not well understood. Moreover, it remains poorly defined how the composition and architecture of the leukemic niche differ from those of its normal counterpart.
The BM microenvironment is composed of endosteal and vascular niches housing many cellular and noncellular components that collectively participate in regulation, self-renewal, proliferation, and differentiation of normal hematopoietic stem cells (HSCs).12,13 HSCs are preferentially localized in endosteal zones in close proximity to the vascular niche, where they interact with mesenchymal stem/stromal cells (MSCs), sinusoidal endothelial cells, perivascular cells, osteoblasts, osteoclasts, macrophages, adipocytes, autonomic neurons, extracellular vesicles, extracellular matrix components, including collagen, fibronectin, laminin networks, and a variety of adhesion factors, growth factors, and cytokines/chemokines.14 The crosstalk between leukemic blasts and niche cells through the release of soluble niche factors, including cytokines and growth factors, induces a remodeling of the BM niche that contributes to AML progression.15-17 Recent studies have shown that: (1) AML cells induce osteogenic but inhibit adipogenic differentiation of MSCs through secreted bone morphogenetic protein (BMP)–mediated signaling6 ; (2) AML-secreted exosomes transform the BM niche into a microenvironment that favors leukemia growth while suppressing normal hematopoiesis7 ; (3) the pro-inflammatory cytokine interleukin-1 (IL-1) can promote the expansion of AML progenitor cells from patients with AML and in vivo disease progression through aberrant activation of the IL-1/p38MAPK pathway18 ; (4) AML cells in the endosteal BM region release cytokines that lead to remodeling of vasculature with a reduced ability to support normal hematopoiesis19 ; and (5) FoxO1 synergizes with activated β-catenin to stimulate the expression of Jagged1 in osteoblasts. This action triggers aberrant Notch signaling in HSCs and induces their leukemogenic transformation, ultimately leading to the development of AML.10,20
Despite this growing interest in the concept of the tumor microenvironment in AML pathobiology, it has not yet been fully described how the noncellular soluble compartment of the BM niche in patients with AML differs from healthy marrow in terms of its proteomic composition. A recent report detailed the proteomic profile of 151 proteins in BM-derived MSCs from a cohort of patients with AML and healthy control subjects by reverse phase protein array; the study revealed 4 major signatures of MSCs in patients with AML, with varying biological properties and clinical implications.21 However, deeper characterization should allow a more granular understanding of the differences in the BM microenvironment in AML compared with healthy aging.
Here, we provide the first quantitative large-scale proteomic analysis of the noncellular soluble compartment of the BM microenvironment in patients with AML compared with healthy control subjects using the SOMAscan assay. This assay is a highly multiplexed and high-throughput affinity proteomics platform based on the ability of modified aptamers (modified small single-stranded oligonucleotides) to bind >1300 target proteins with high specificity and affinity at slow dissociation rates.22-29 We supplemented this data set with proteomic analysis of PB serum and RNA-sequencing of BM aspirate cells to allow comparison between compartments and detection methodology. This work provides mechanistic insights into the AML BM microenvironment that should serve as a useful comprehensive benchmarking resource for subsequent investigations.
Methods
Clinical samples
Blood and BM aspirate samples were collected after receipt of written informed consent on National Heart, Lung and Blood Institute institutional review board–approved protocols (NCT00071045, NCT00442195, and NCT00217594). For RNA-sequencing and proteomics, samples were collected during 2017 from 10 patients with relapsed/refractory AML (NCT02996474) and 10 age- and sex-matched healthy control subjects. For validation of SOMAscan findings, sera were collected from a large combined cohort of 24 patients with relapsed/refractory AML and 20 age-matched healthy control subjects, including all subjects described earlier and 9 patients with myelodysplastic syndrome (MDS).
Serum samples were collected by drawing PB into serum separator tubes (BD Biosciences), incubation at ambient temperature for at least 30 minutes, and then centrifugation at 1000g for 10 minutes. For BM plasma samples, fresh BM aspirates were diluted 1:1 with phosphate-buffered saline, 8 mL of which was delivered into cell preparation tubes (BD Biosciences), centrifuged at 1500g for 20 minutes, and the resulting supernatant collected. The BM plasma and PB serum samples were immediately aliquoted and stored at −80°C. For RNA-sequencing, BM aspirate was collected in PAXgene BM RNA tubes (Qiagen, Germantown, MD) and stored at -80°C for subsequent RNA extraction.
SOMAscan assay
Proteomic analysis of 1305 target proteins was performed by using a 1.3k assay on a SOMAscan hybridization microarray platform (SomaLogic, Inc., Boulder, CO)30 in 96-well plates on a Freedom Evo 200 High Throughput System (Tecan Group Ltd., Männedorf, Switzerland). Samples were diluted to 3 concentrations (40%, 1%, and 0.005%) to maximize the dynamic range. Calibrators, buffer only, and quality control (QC) samples were randomly assigned to the plate design. SOMAmer reagents were hybridized on microarray slides and abundance quantified in relative fluorescence units. Raw data were corrected by using hybridization control normalization and median signal normalization procedures.31
RNA-sequencing
RNA was isolated from PAXgene BM RNA tubes using the PAXgene BM RNA kit (PreAnalytiX GmbH, Hombrechtikon, Switzerland). RNA quantity was measured by using a Qubit 2.0 Fluorometer (Thermo Fisher Scientific, Waltham, MA), and RNA quality was assessed by using the TapeStation system (Agilent Technologies, Santa Clara, CA). All samples had RNA Integrity Numbers of seven or higher. Libraries were prepared by using the TruSeq Stranded Total RNA Sample Preparation Kit (Illumina Inc., San Diego, CA) with 1 μg of total RNA input, and paired-end 75 bp sequencing was performed on a HiSeq 3000 (Illumina). Data sets have been deposited in the National Center for Biotechnology Information’s Gene Expression Omnibus (GSE138702).
Luminex assay
The Luminex Performance Human XL Cytokine Discovery Panel was used to independently verify the levels of IL-8 (CXCL8) (R&D Systems, Minneapolis, MN). Samples were run in duplicate in one batch, along with blanks, standards, and high and low concentration controls. Fluorescent values beyond the range of the standards were extrapolated (unless the fluorescence intensity was below that of the blanks). Average value of duplicates was used for data analysis.
Enzyme-linked immunosorbent assay
Validation of CKβ8 levels used DuoSet sandwich enzyme-linked immunosorbent assay (ELISA) human myeloid progenitor inhibitory factor (MPIF-1) kits (R&D Systems) and a Synergy LX multimode reader (BioTek Instruments Inc., Winooski, VT) with wavelength correction. A standard curve was calculated with a 4-PL regression model using Gen5 software (BioTek Instruments Inc.).
Clonogenic assay of human CD34+ progenitors
Human BM CD34+ cells from a healthy control were washed in X-VIVO 15 serum-free hematopoietic cell medium (Lonza, Walkersville, MD). The cells were then suspended (500 cells/mL) in MethoCult semisolid medium (STEMCELL Technologies, Cambridge, MA) supplemented with a cocktail of cytokines (human stem cell factor, human IL-3, human IL-6, human erythropoietin, human granulocyte colony-stimulating factor, and human granulocyte-macrophage colony-stimulating factor), plated with recombinant human MPIF-1 isoforms, CKβ8 and CKβ8-1 (R&D Systems), at increasing concentrations (0, 0.5, 5, and 50 ng/mL). Colonies were allowed to grow by incubating the dishes at 37°C in a humidified atmosphere containing 5% carbon dioxide. Resulting colonies were scored under an inverted microscope after 13 days.
Data analysis
Normalized SOMAscan data were analyzed by using a web-based tool (https://foocheung.shinyapps.io/adat_v02/).32 Differential expression of analyzed targets was assessed by using the unpaired Mann-Whitney U test with a false discovery rate (FDR) cutoff of 0.05. Prism version 8.0.2 software (GraphPad Software, La Jolla, CA) was used to perform statistical analyses. The Mann-Whitney U test was used to determine statistically significant differences between groups for IL-8 and MPIF-1 isoform levels. Spearman’s correlation was performed to identify the degree of correlation for analyte levels determined by different assay types (SOMAscan vs Luminex). Two-tailed Student unpaired t tests were used to determine statistical significance of the effect of recombinant human CKβ8 and CKβ8-1 on colony formation by CD34+ cells.
For RNA-sequencing analysis, reads were aligned to human genome assembly GRCh37/hg19 by HISAT2 (version 2.1.0)33 with default setting for paired-end reads. The aligned reads were converted to BAM files and sorted by using SAMtools 1.934 with index files created. The sorted BAM files were processed in R version 3.5 (R Foundation for Statistical Computing, Vienna, Austria) with Bioconductor packages. The count matrix on gene level was generated by featureCounts35 in Rsubread function. The differentially expressed genes were found by edgeR with an FDR cutoff of 0.05 and the fold change (FC) cutoff of 1.5. Gene Set Enrichment Analysis (GSEA) was performed based on preranked genes considering both the direction of enrichment indicated by FC and the level of significance indicated by FDR.36 Three signature databases (Reactome,37 Kyoto Encyclopedia of Genes and Genomes [KEGG],38 and Gene Ontology [GO]39,40 ) were used to identify networks of differentially expressed genes. Heatmaps were plotted with the standardized feature counts, which were first normalized to account for the library size.
STRING database version 11.0 (https://www.string-db.org/) was queried for pathway and cluster analysis of enriched protein sets in the AML group and to construct a protein–protein interaction (PPI) network.41
Results
BM cells from patients with AML harbor significant alterations in global gene expression profiles
We first performed total RNA-sequencing on whole BM aspirate from a cohort of 10 patients with AML (median age, 62 years; range, 30-81 years) (Table 1) and 10 age- and sex-matched healthy donor control subjects (median age, 53.5 years; range, 34-65 years). Comparison of transcriptome profiles revealed distinct gene expression patterns with 4807 genes differentially expressed in AML BM (FC ≥1.5; FDR ≤0.05) (Figure 1A). The full list of upregulated and downregulated genes is provided in supplemental Tables 1 and 2. Hierarchical clustering of the top 100 aberrantly expressed genes resulted in a successful separation of patients with AML and healthy control subjects into 2 distinct groups, indicating a common disease-specific transcriptional signature for AML (Figure 1B).
Clinical characteristics of patients with AML and healthy control subjects included in this study
| Healthy control subjects | Age, y/sex | Patients with AML | Age, y/sex | Diagnosis | Cytogenetics | Mutation status | Previous treatment | AML blast % |
|---|---|---|---|---|---|---|---|---|
| HD 1 | 50/F | AML 1 | 74/M | Relapse (2nd) | inv(16), +8, −20q | DNMT3A | 2 | 5 |
| HD 2 | 50/F | AML 2 | 62/F | Refractory (s/p 2nd relapse) | t(6;14)(q25;q22) | DNMT3A, CUX1, U2AF1, NPM1 | 2 | 9 |
| HD 3 | 48/M | AML 3 | 54/F | Refractory | −7q, +8, −20q | U2AF1 | 2 | 13 |
| HD 4 | 34/M | AML 4 | 30/M | Refractory | t(9;11)(p21.3;q23.3) | None | 3 | 30 |
| HD 5 | 60/M | AML 5 | 71/M | Relapse (late, 1st) | Normal | DNMT3A, TET2 | 1 | 4 |
| HD 6 | 59/M | AML 6 | 51/F | Relapse (early, 1st) | −5q, −7p, −14q, +20q, +21 | NRAS, RUNX1, TP53 | 2 | 33 |
| HD 7 | 65/M | AML 7 | 56/F | Refractory | Normal | DNMT3A, TET2, U2AF1 | 3 | 12 |
| HD 8 | 60/F | AML 8 | 69/M | Refractory | −7, −5q, +1q | TP53, ASXL1 | 1 | 30 |
| HD 9 | 57/F | AML 9 | 62/F | Refractory | Normal | EZH2, SETBP1, ASXL1, STAG2, RUNX1 | 3 | 9 |
| HD 10 | 49/F | AML 10 | 81/M | Refractory | +8 | SRSF2, ASXL1, RUNX1 | 2 | 10 |
F, female; HD, healthy donor; M, male.
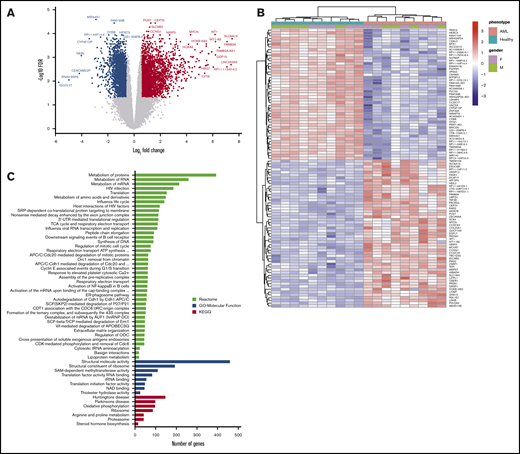
RNA-sequencing of whole BM aspirate cells from patients with AML compared with healthy control subjects. (A) A volcano plot illustrating differentially regulated gene expression in patients with AML (n = 10) compared with healthy control subjects (n = 10). RNA-sequencing analysis revealed a total of 2630 genes upregulated (red) and 2177 genes downregulated (blue) (FC ≥1.5; FDR ≤0.05). The FC (in log2 scale) of the transcript abundance is plotted on the x-axis and the statistical significance expressed as -log10(FDR) on the y-axis. Genes not classified as differentially expressed are plotted in gray. (B) Heatmap of unsupervised hierarchical clustering indicates the top 100 differentially expressed genes ranked based on FDR between patients with AML and healthy control subjects, with high levels of expression shown in red and low levels shown in blue. Color coding is based on standardized and normalized read counts accounting for the library size. (C) GSEA of upregulated genes for Reactome and KEGG pathways, as well as their GO annotation for molecular function terms, reveals the pathways that were significantly altered in patients with AML (FDR ≤ 0.05). ATP, adenosine triphosphate; ER, endoplasmic reticulum; mRNA, messenger RNA; rRNA, ribosomal RNA; UTR, untranslated region.
RNA-sequencing of whole BM aspirate cells from patients with AML compared with healthy control subjects. (A) A volcano plot illustrating differentially regulated gene expression in patients with AML (n = 10) compared with healthy control subjects (n = 10). RNA-sequencing analysis revealed a total of 2630 genes upregulated (red) and 2177 genes downregulated (blue) (FC ≥1.5; FDR ≤0.05). The FC (in log2 scale) of the transcript abundance is plotted on the x-axis and the statistical significance expressed as -log10(FDR) on the y-axis. Genes not classified as differentially expressed are plotted in gray. (B) Heatmap of unsupervised hierarchical clustering indicates the top 100 differentially expressed genes ranked based on FDR between patients with AML and healthy control subjects, with high levels of expression shown in red and low levels shown in blue. Color coding is based on standardized and normalized read counts accounting for the library size. (C) GSEA of upregulated genes for Reactome and KEGG pathways, as well as their GO annotation for molecular function terms, reveals the pathways that were significantly altered in patients with AML (FDR ≤ 0.05). ATP, adenosine triphosphate; ER, endoplasmic reticulum; mRNA, messenger RNA; rRNA, ribosomal RNA; UTR, untranslated region.
Functional assessment of upregulated genes by GSEA using the Reactome, KEGG, and GO databases revealed significant enrichment of gene functions particularly linked to metabolic pathways, including RNA metabolism, protein metabolism, and amino acid metabolism along with translation, oxidative phosphorylation, cell cycle, extracellular matrix organization, and activation of the NF-κB pathway (Figure 1C). Unlike the upregulated genes that were enriched for diverse functions, the GSEA of downregulated genes revealed no significantly enriched pathways or terms with adequate statistical power.
Our RNA-sequencing approach only represents a single, static, and spatiotemporal snapshot of stable RNA molecules present in whole BM aspirate cells of patients with AML compared with healthy control subjects. Moreover, given that the plasma proteome is secreted from multiple cell types residing in BM, RNA derived from intracellular sources of BM may not reflect the proteomic composition of the extracellular compartment. We therefore complemented these findings with a high throughput proteomic analysis of BM plasma.
SOMAscan analysis enables identification of numerous novel proteins differentially expressed in the BM niche of patients with AML
To identify differentially abundant proteins, we performed proteomic analyses of 1305 proteins in BM plasma samples derived from the same patients with AML and healthy control subjects described earlier using the aptamer-based SOMAscan proteomics assay. We first performed principal component analysis to validate the data generated with the SOMAscan platform, which showed clear separation of buffers, calibrators, internal/external QC controls, and BM plasma samples used in the screening assays (Figure 2A). In total, 168 analytes that passed our filtering criteria (FC ≥ 1.5; FDR ≤ 0.05) were identified as significantly different in BM plasma samples from patients with AML vs healthy control subjects (Figure 2B). Of these, 91 proteins were significantly more abundant and 77 proteins less abundant in leukemic marrow compared with healthy marrow (supplemental Tables 3 and 4, respectively). In addition to proteins with an established role in the pathophysiology of AML such as iron homeostasis regulators (eg, erythropoietin, hepcidin, ferritin) and dysregulated pathways previously identified as disease-relevant (eg, arginase),42 we identified numerous proteins whose role in AML pathogenesis or treatment is currently undescribed. The unsupervised hierarchical clustering of subjects based on their expression levels of the 168 differentially expressed proteins accurately discriminated patients with AML and healthy control subjects, with only one exception (Figure 3A).
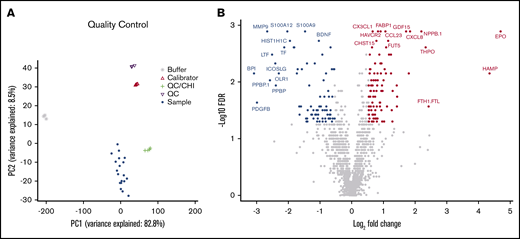
High-throughput SOMAscan proteomics platform identifies differentially expressed proteins in the BM microenvironment of patients with AML. (A) A principal component analysis showing variance between the SomaLogic calibrators, SomaLogic QC samples, internal QC samples, and biological samples. (B) A volcano plot showing differentially abundant proteins in BM plasma samples obtained from patients with AML (n = 10) compared with healthy control subjects (n = 10). The SOMAscan analysis revealed a total of 168 proteins that were differentially abundant in the AML BM microenvironment compared with healthy control subjects (unpaired Mann-Whitney U test, FC ≥1.5; FDR ≤0.05). Data for proteins that were not classified as differentially expressed after filtering are plotted in gray. Data for proteins that are upregulated and downregulated are denoted by red and blue symbols, respectively.
High-throughput SOMAscan proteomics platform identifies differentially expressed proteins in the BM microenvironment of patients with AML. (A) A principal component analysis showing variance between the SomaLogic calibrators, SomaLogic QC samples, internal QC samples, and biological samples. (B) A volcano plot showing differentially abundant proteins in BM plasma samples obtained from patients with AML (n = 10) compared with healthy control subjects (n = 10). The SOMAscan analysis revealed a total of 168 proteins that were differentially abundant in the AML BM microenvironment compared with healthy control subjects (unpaired Mann-Whitney U test, FC ≥1.5; FDR ≤0.05). Data for proteins that were not classified as differentially expressed after filtering are plotted in gray. Data for proteins that are upregulated and downregulated are denoted by red and blue symbols, respectively.
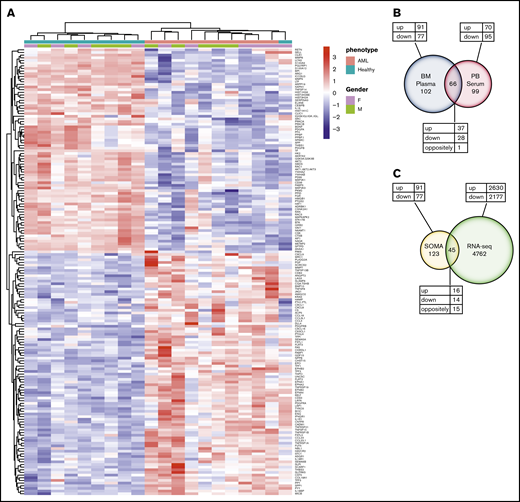
Differential protein expression in the BM of patients with AML compared with healthy control subjects. (A) A heatmap representation of a total of 168 differentially expressed analytes measured by SOMAscan assay using the BM plasma samples obtained from patients with AML (n = 10) and healthy control subjects (n = 10). Heatmap rows and columns were hierarchically clustered (unsupervised) within the groups. Color scale indicates relative expression, with more abundant proteins shown in red and less abundant proteins shown in blue. (B) A Venn diagram of unique and shared proteins identified as dysregulated by SOMAscan analysis of the BM plasma and PB serum samples obtained from patients with AML and healthy control subjects. Comparison of SOMAscan proteomic signatures of patients with AML vs healthy control subjects revealed 65 analytes similarly regulated and 1 analyte differently regulated in BM plasma and PB serum samples. (C) A Venn diagram illustrating the unique and overlapping differential expression events between the proteomics data obtained from SOMAscan analysis of BM plasma samples and the transcriptome data generated by in-depth bulk RNA-sequencing of whole BM aspirate cells.
Differential protein expression in the BM of patients with AML compared with healthy control subjects. (A) A heatmap representation of a total of 168 differentially expressed analytes measured by SOMAscan assay using the BM plasma samples obtained from patients with AML (n = 10) and healthy control subjects (n = 10). Heatmap rows and columns were hierarchically clustered (unsupervised) within the groups. Color scale indicates relative expression, with more abundant proteins shown in red and less abundant proteins shown in blue. (B) A Venn diagram of unique and shared proteins identified as dysregulated by SOMAscan analysis of the BM plasma and PB serum samples obtained from patients with AML and healthy control subjects. Comparison of SOMAscan proteomic signatures of patients with AML vs healthy control subjects revealed 65 analytes similarly regulated and 1 analyte differently regulated in BM plasma and PB serum samples. (C) A Venn diagram illustrating the unique and overlapping differential expression events between the proteomics data obtained from SOMAscan analysis of BM plasma samples and the transcriptome data generated by in-depth bulk RNA-sequencing of whole BM aspirate cells.
We next examined the similarities and differences in the proteomic profile of the BM microenvironment and the PB by performing the SOMAscan assay on PB serum samples collected in parallel from the same patients with AML and healthy control subjects. Comparative analysis between PB serum and BM plasma samples identified 65 similarly regulated proteins (37 upregulated vs 28 downregulated) and 1 differently regulated protein (MetAP2) (Figure 3B; supplemental Table 5). Full lists of upregulated and downregulated proteins identified in the PB serum of patients with AML are provided in supplemental Tables 6 and 7, respectively. Of the total 168 and 165 proteins differentially expressed in BM plasma and PB serum samples, 102 proteins were specifically dysregulated only in the BM compartment.
We further compared the transcriptome data generated by in-depth bulk RNA-sequencing of whole BM aspirate cells with the proteomics data obtained from the SOMAscan analysis. The transcriptomic and proteomic data only partially overlapped. In total, of the 168 proteins identified as differentially expressed by the SOMAscan platform, only 45 were also identified as dysregulated by RNA-sequencing. Of the similarly regulated genes, 16 were upregulated and 14 were downregulated. However, a total of 15 genes were found to be differently regulated when compared with SOMAscan analysis (Figure 3C; supplemental Table 8). These findings highlight the limited utility of RNA-sequencing of BM to determine changes in functionally relevant BM extracellular protein levels.
The proteomic signature of the leukemic BM niche reveals perturbation of signaling networks particularly associated with cytokine and chemokine signaling
To gain further insight into the biological relevance of proteins identified as upregulated in the BM plasma of patients with AML, STRING software was used to construct a PPI network and perform a network and cluster analysis. This analysis showed that the majority of upregulated proteins were connected by significantly more interactions than expected through at least one association, either directly or indirectly (248 vs 55 expected edges; P < 10−16) (Figure 4A), which indicates that upregulated proteins in the leukemic BM niche can form large and complex protein interaction networks. Subsequent functional enrichment analysis revealed that the highly connected signaling network of cytokines and chemokines (including several cytokines, chemokines, interleukins, members of the transforming growth factor β [TGF-β]/BMP superfamily, tumor necrosis factor superfamily, and their receptors) was the most significant and notable pathway enriched by the majority of the upregulated proteins across all 3 databases (KEGG, Reactome, and GO) (Figure 4B; supplemental Table 9). In addition, neuronal differentiation–related pathways such as ephrin receptor signaling and axon guidance were significantly altered in leukemic BM niche compared with healthy marrow. We identified many other proteins important in numerous signaling pathways as upregulated in leukemic marrow compared with healthy marrow.

Physical and functional interaction network of upregulated proteins in the BM microenvironment of patients with AML. (A) STRING 11.0 (Search Tool for the Retrieval of Interacting Genes) was used to visualize the predicted PPIs for the upregulated proteins identified by SOMAscan assay in the AML BM microenvironment compared with healthy controls (https://string-db.org/). Network nodes represent proteins and the lines reflect physical and/or functional interactions of proteins. Empty nodes represent the proteins of unknown three-dimensional structure, and filled nodes represent the proteins with some three-dimensional structure known or predicted. Different colored lines between the proteins represent the various types of interaction evidence in STRING (databases, experiments, neighborhood, gene fusion, cooccurrence, text mining, coexpression, and homology). (B) Upregulated proteins were subjected to enrichment analyses for KEGG and Reactome pathways as well as GO annotation for “Molecular Function” terms using STRING 11.0 tool. Graph indicates the top 29 significantly enriched GO-Molecular Function terms ranked based on -Log10(FDR) ≥3. For all other analysis, FDR ≤0.05 was used as the threshold value, and the number of proteins enriched in each pathway was ≥2. The full list of enriched pathways and terms with associated FDRs is given in supplemental Table 9.
Physical and functional interaction network of upregulated proteins in the BM microenvironment of patients with AML. (A) STRING 11.0 (Search Tool for the Retrieval of Interacting Genes) was used to visualize the predicted PPIs for the upregulated proteins identified by SOMAscan assay in the AML BM microenvironment compared with healthy controls (https://string-db.org/). Network nodes represent proteins and the lines reflect physical and/or functional interactions of proteins. Empty nodes represent the proteins of unknown three-dimensional structure, and filled nodes represent the proteins with some three-dimensional structure known or predicted. Different colored lines between the proteins represent the various types of interaction evidence in STRING (databases, experiments, neighborhood, gene fusion, cooccurrence, text mining, coexpression, and homology). (B) Upregulated proteins were subjected to enrichment analyses for KEGG and Reactome pathways as well as GO annotation for “Molecular Function” terms using STRING 11.0 tool. Graph indicates the top 29 significantly enriched GO-Molecular Function terms ranked based on -Log10(FDR) ≥3. For all other analysis, FDR ≤0.05 was used as the threshold value, and the number of proteins enriched in each pathway was ≥2. The full list of enriched pathways and terms with associated FDRs is given in supplemental Table 9.
We also performed equivalent analyses to identify biological pathways specific to the downregulated proteins in the BM plasma samples of patients with AML. These analyses found substantial overlap with upregulated protein networks, particularly in KEGG pathways including aberrant pathway alterations associated with cytokine/chemokine signaling (supplemental Figure 1A). The upregulation and downregulation of proteins across these signaling pathways suggests a coordinated impairment of multiple regulatory mechanisms. We also identified a large number of unique pathways and terms enriched for downregulated proteins, particularly neutrophil degranulation and platelet function, known to be impaired in AML (supplemental Table 10).
We applied the same PPI network and pathway analyses to the SOMAscan data set obtained for PB serum samples (supplemental Figure 1B-C; supplemental Tables 11 and 12) and identified substantial overlap with many of the same top-ranked, enriched pathways identified in the BM plasma proteome.
IL-8 is overexpressed in the BM microenvironment of patients with AML
The pro-inflammatory cytokine IL-8 (CXCL8) was identified as the hub protein located at the center of the cytokine/chemokine signaling network (Figure 4). The high sensitivity of the SOMAscan platform enabled identification of significantly elevated levels of IL-8 in leukemic BM plasma samples compared with healthy BM plasma (P = .0001) (Figure 5A).

SOMAscan proteomic analysis identifies significantly elevated levels of IL-8 and MPIF-1 isoforms in the BM plasma and PB serum samples of patients with AML. (A) Boxplot shows the relative abundance of IL-8 displayed in relative fluorescence units (RFUs) in the BM plasma samples from patients with AML (n = 10) vs healthy control subjects (n = 10) obtained using the SOMAscan platform. ***P = .0001, vs control using unpaired Mann-Whitney U test. (B) Boxplots show the levels of CKβ8 (left panel) and CKβ8-1 (right panel) isoforms in the BM plasma samples from patients with AML (n = 10) vs healthy control subjects (n = 10) obtained using the SOMAscan platform. ****P < .0001; ***P = .0003, vs control using unpaired Mann-Whitney U test. (C) Boxplots show the relative abundance of CKβ8 (left panel) and CKβ8-1 (right panel) isoforms in the PB serum samples from patients with AML (n = 10) vs healthy control subjects (n = 10) analyzed by using the SOMAscan platform. ****P < .0001; *** P = .0007, vs control using unpaired Mann-Whitney U test. (D) CKβ8 protein levels in the PB serum samples from patients with MDS (n = 9) and patients with AML (n = 24) vs healthy control subjects (n = 20) were analyzed by using ELISA. *P = .0436 for MDS group; **P = .0095 for AML group, vs control using unpaired Mann-Whitney U test. (E) Effect of CKβ8 and CKβ8-1 isoforms on colony formation by CD34+ progenitor cells. Results are given as the mean of 2 technical replicates. Significant reduction in CFU-GM and CFU-GEMM was observed when treated with either isoform at 50 ng/mL concentration. P < .05, vs control using a 2-tailed Student unpaired t test.
SOMAscan proteomic analysis identifies significantly elevated levels of IL-8 and MPIF-1 isoforms in the BM plasma and PB serum samples of patients with AML. (A) Boxplot shows the relative abundance of IL-8 displayed in relative fluorescence units (RFUs) in the BM plasma samples from patients with AML (n = 10) vs healthy control subjects (n = 10) obtained using the SOMAscan platform. ***P = .0001, vs control using unpaired Mann-Whitney U test. (B) Boxplots show the levels of CKβ8 (left panel) and CKβ8-1 (right panel) isoforms in the BM plasma samples from patients with AML (n = 10) vs healthy control subjects (n = 10) obtained using the SOMAscan platform. ****P < .0001; ***P = .0003, vs control using unpaired Mann-Whitney U test. (C) Boxplots show the relative abundance of CKβ8 (left panel) and CKβ8-1 (right panel) isoforms in the PB serum samples from patients with AML (n = 10) vs healthy control subjects (n = 10) analyzed by using the SOMAscan platform. ****P < .0001; *** P = .0007, vs control using unpaired Mann-Whitney U test. (D) CKβ8 protein levels in the PB serum samples from patients with MDS (n = 9) and patients with AML (n = 24) vs healthy control subjects (n = 20) were analyzed by using ELISA. *P = .0436 for MDS group; **P = .0095 for AML group, vs control using unpaired Mann-Whitney U test. (E) Effect of CKβ8 and CKβ8-1 isoforms on colony formation by CD34+ progenitor cells. Results are given as the mean of 2 technical replicates. Significant reduction in CFU-GM and CFU-GEMM was observed when treated with either isoform at 50 ng/mL concentration. P < .05, vs control using a 2-tailed Student unpaired t test.
Our group has previously reported PB serum IL-8 levels using the Luminex immunoassay assay in a larger combined cohort of 24 patients with relapsed/refractory AML (median age, 59 years; age range, 22-81 years; 14 male subjects, 10 female subjects) and 20 age-matched healthy control subjects (median age, 50 years; age range, 24-84 years; 9 male subjects, 11 female subjects).43 In this large cohort, which also included all subjects evaluated in this study, PB serum IL-8 levels were statistically elevated in patients with AML compared with healthy control subjects (P = .017).
This overlap between cohorts also allowed orthogonal validation of our proteomics screen across multiple platforms. PB serum IL-8 levels were positively correlated between the SOMAscan and Luminex assays (Spearman r = 0.8090; P ≤ .0001) (supplemental Figure 2).
BM plasma from patients with AML display higher levels of CKβ8 and CKβ8-1 isoforms compared with healthy BM
MPIF-1, also known as CCL23 or CKβ8, is a myelosuppressive chemokine that reportedly suppresses hematopoietic progenitor cells.44 In these patients with AML, the levels of both CKβ8 and CKβ8-1 isoforms resulting from alternative splicing of the MPIF-1 gene were significantly higher in both BM plasma (Figure 5B) and PB serum (Figure 5C) samples compared with those of healthy control subjects. Subsequent analysis of CKβ8 levels in PB serum from the cohort of 24 patients with relapsed/refractory AML and 20 age-matched healthy control subjects described earlier and a group of 9 patients with MDS (median age, 56 years; age range, 26-72 years) using an ELISA-based immunoassay showed statistically significant increased levels in both MDS and AML patients compared with healthy controls, with the greatest increase seen in patients with AML (Figure 5D). These data suggest that MPIF-1 may have a role in the suppression of normal hematopoiesis that is typically associated with AML.
Given the critical importance of cytopenias (often disproportional to the degree of leukemic marrow involvement) in the morbidity and mortality of patients with MDS/AML, we examined this hypothesis further by testing the in vitro myelosuppressive effects of recombinant human CKβ8 and CKβ8-1 isoforms on human BM CD34+ progenitor cells obtained from a healthy control. Culture of CD34+ cells in colony-forming unit (CFU) assays with either isoform at a concentration of 50 ng/mL resulted in significant suppression of granulocyte-macrophage (CFU-GM) and multipotential (CFU-GEMM) progenitor cells but not erythroid (BFU-E), granulocyte (CFU-G), and macrophage (CFU-M) progenitor cells under the culture conditions of our assays (Figure 5E).
Discussion
Factors found within the extracellular compartment of BM can activate numerous signal transduction pathways in leukemic cells involved in survival, proliferation, and acquisition of drug resistance.17 Previous proteomic profiling studies of AML aimed to identify novel diagnostic markers or reveal insights into disease pathogenesis but were performed on blood samples, patient leukemic blasts, or in primary/established cell lines.21,45,46 In this study, we performed a novel comprehensive proteomic analysis of 1305 proteins directly on plasma samples from the BM of patients with AML and healthy subjects. Compared with other proteomics technologies, the high binding affinity and selectivity of the SOMAscan method used here enabled multiplexed, accurate, sensitive, and fast screening of many targets30,47-49 across a wide dynamic range of 8 orders of magnitude.30,50,51
We identified a total of 168 proteins that were significantly dysregulated in the BM plasma of patients with AML vs that of healthy control subjects (Figures 2B, 3A). This included proteins already known to be dysregulated in patients with AML (eg, erythropoietin, hepcidin, ferritin, thrombopoietin)52,53 as well as perturbations not previously described. It is not possible to determine, based on this study, if changes in soluble protein expression levels observed in AML BM, compared with that from healthy donors, are from the leukemic cells themselves, the nonmalignant BM microenvironment, or some combination of both. Only 45 of the 168 proteins identified as dysregulated in the BM microenvironment were also identified as having an altered gene expression profile by RNA-sequencing of BM aspirate. Analysis of PB serum identified a total of 165 proteins that were significantly dysregulated in patients with AML vs healthy control subjects, of which only 66 overlap with those altered in the BM plasma. This multimodal reference data set highlights the importance of profiling the correct compartment by using the appropriate methodology.54
Using systems biology tools, we identified the cytokine/chemokine signaling network as the most striking AML-associated proteomic alteration in the BM microenvironment. Significantly elevated levels of chemokines, cytokines, and cytokine receptors were observed. String pathway analysis showed that these proteins form a large and complex cytokine/chemokine interaction network. IL-8 was identified as a differentially expressed and key central molecule of this network in AML, suggesting this pathway may be an attractive therapeutic target.55-61
Unlike IL-8, the role of MPIF-1 in myeloid malignancies has not previously been described. MPIF-1 is an inhibitory cytokine with potent myelosuppressive activity, and it inhibits proliferation and differentiation of myeloid progenitor cells.44 Studies indicate that extensive remodeling of the BM microenvironment by AML leukemic cells impairs normal hematopoiesis and interferes with the function of hematopoietic stem and progenitor cells by impeding their differentiation.5,62 Consistent with this, we found significant enrichment of downregulated proteins involved in neutrophil degranulation and platelet function pathways (supplemental Table 10). Significantly elevated levels of both MPIF-1 isoforms, CKβ8 and CKβ8-1, were found in BM plasma and PB serum samples. Incubation of CD34+ cells with either isoform of recombinant human MPIF-1 led to a significant suppression of CFU-GM and CFU-GEMM, suggesting that MPIF-1 may play a role in suppression of the normal myelopoiesis commonly seen in patients with myeloid malignancy.
Recent studies have shown that cytokines derived from AML cells shift the BM microenvironment toward a pre-osteoblastic niche by simultaneously inducing osteogenic differentiation and inhibiting adipogenic differentiation of MSCs, resulting in a growth advantage and expansion of AML cells.6,63,64 Simultaneous activation of osteoclasts and induction of osteolytic activities in leukemic marrow results in osteopenia/osteoporosis.63,65 The pro-osteoclastic chemokine CCL3, elevated in the BM plasma of leukemic mice and patients with AML, is believed to inhibit osteoblastic cell functions and contribute to remodeling.66 AML cells induce an osteoprogenitor niche while also activating osteoclasts and blocking differentiation of MSCs into mature osteoblasts.67 TGF-β superfamily cytokines cooperate with other TGF-β factors and cytokines to regulate bone organogenesis and homeostasis.68 We found significantly elevated levels and a highly interconnected network of proteins involved in bone homeostasis, including BMP10, GDF15 (a member of TGF-β superfamily), CCL3, CX3CL1, osteopontin, endoglin (a part of the TGF-β receptor complex), parathyroid hormone–like hormone, the secreted regulators of BMP signaling pathway that include the follistatin family of proteins (FSTL3 and FSTL1), chordin-like protein 1, matrilysin (MMP-7), and neuroblastoma suppressor of tumorigenicity 1; also recorded were decreased levels of osteonectin in the BM plasma of patients with AML. These findings suggest their coordinated involvement in regulating the osteogenic and osteolytic activities in leukemic marrow.
Significantly elevated protein levels of several Ephrin ligands (Ephrin A4 and Ephrin B2) and receptors (EphA1, EphA2, and EphB2) were identified in patients with AML. The Ephrin signaling system is believed to mediate different aspects of bone homeostasis and also hematopoiesis, including growth, survival, differentiation, and motility of BM cell populations.69 Notch ligands Jagged1 and DLL4 were elevated in patients with AML, in line with previous observations indicating a role for Notch signaling in crosstalk between BM stromal cells and leukemic cells to induce AML progression.10,20,70 S100A calcium-binding proteins A9 (S100A9) and A12 (S100A12) were significantly lower in leukemic vs healthy marrow consistent with the reported role of S100A9 in suppressing AML growth and progression.71
Finally, we identified increased TIM-3, CD84, and LAG-3 inhibitory immune checkpoint molecules at both the RNA and protein level in leukemic marrow. An autocrine stimulatory loop involving TIM-3 on the surface of human leukemic stem cells and its secreted ligand galectin-9 has been shown to promote self-renewal of the stem cells and leukemic progression in a range of myeloid malignancies.72 We also identified a higher abundance of the stress protein MICB in AML marrow, consistent with escape of immune surveillance through proteolytic shedding of this ligand for the natural killer cell–activating receptor NKG2D.73
In conclusion, we previously reported a detailed analysis of the cellular compartment of human BM using single-cell RNA-sequencing benchmarked to immunophenotyping using flow and mass cytometry.74 We now report the first comprehensive proteomics analysis of the noncellular soluble compartment of the BM microenvironment, leading to new insights into AML disease pathobiology. Our comprehensive proteomics data set, with paired RNA-sequencing, of AML and healthy human BM should serve as a foundational resource for future research in this area.
Acknowledgments
The authors appreciate the BM evaluations performed by the Department of Laboratory Medicine, National Institutes of Health (NIH). They thank the nurses, staff, and fellows of the NIH clinical center who participated in the care of these patients. They also acknowledge the contribution of subjects and their families to this research.
This research was supported by the Intramural Research Program of the National Heart, Lung, and Blood Institute of the NIH (1-ZIAHL006163-07).
Authorship
Contribution: H.Ç., K.E.L., B.P., G.F., G.G., A.B., J.C., F.C., and G.S. performed experiments and/or analyzed the associated data; J.C., F.C., and G.G. prepared figures and text for the article; J.V., M.G., C.D., C.L., J.T., J.Y.G., R.H.S., C.L.D., A.L., and L.W.D. contributed technical expertise and/or performed clinical research; M.G., B.P., L.W.D., and C.S.H. reviewed and edited the manuscript; C.S.H. and H.Ç. conceived and designed the study, oversaw the research, analyzed data, and wrote the paper; and all authors read and approved the manuscript for submission.
Conflict-of-interest disclosure: C.S.H. has received laboratory research funding from Merck, Sharpe & Dohme, and SELLAS Life Sciences Group AG. C.L. has served on an advisory board for Agios, Daiichi Sankyo, and Jazz Pharmaceuticals; and as a speaker for Astellas and Jazz Pharmaceuticals. The remaining authors declare no competing financial interests.
Correspondence: Christopher S. Hourigan, Laboratory of Myeloid Malignancies, National Heart, Lung, and Blood Institute, National Institutes of Health, Room 10CRC 5-5130, 10 Center Dr, Bethesda, MD 20892-1476; e-mail: hourigan@nih.gov.

