

Key Points
Macrophage infiltration is a key feature of the tumor microenvironment across the GZL spectrum.
GEP distinguishes 2 types of GZL, resembling PMBCL vs DLBCL phenotypes that are associated with presentation in the “thymic” anatomic niche.

Abstract
Gray zone lymphoma (GZL), a B-cell lymphoma with features intermediate between large B-cell lymphoma (LBCL) and classic Hodgkin lymphoma (cHL), is a rare and poorly defined entity. Alongside GZL, a subset of Epstein-Barr virus (EBV)–positive diffuse large B-cell lymphoma (DLBCL) has been described with polymorphic/GZL-like morphology (polymorphic-EBV-L). To fill the important gap in our understanding of the pathogenic process underlying these entities, we performed a gene expression study of a large international cohort of GZL and polymorphic-EBV-L, combined with cHL and primary mediastinal large B-cell lymphoma (PMBCL) cases. In an unsupervised principal component analysis, GZL cases presented with intermediate scores in a spectrum between cHL and PMBCL, whereas polymorphic-EBV-L clustered distinctly. The main biological pathways underlying the GZL spectrum were related to cell cycle, reflecting tumor cell content, and extracellular matrix signatures related to the cellular tumor microenvironment. Differential expression analysis and phenotypic characterization of the tumor microenvironment highlighted the predominance of regulatory macrophages in GZL compared with cHL and PMBCL. Two distinct subtypes of GZL were distinguishable that were phenotypically reminiscent of PMBCL and DLBCL, and we observed an association of PMBCL-type GZL with clinical presentation in the “thymic” anatomic niche. In summary, gene expression profiling (GEP) enabled us to add precision to the GZL spectrum, describe the biological distinction compared with polymorphic-EBV-L, and distinguish cases with and without thymic involvement as 2 subgroups of GZL, namely PMBCL-like and DLBCL-like GZL.
Introduction
Lymphomas are a heterogeneous group of cancers categorized in the World Health Organization (WHO) classification into >60 distinct entities based on morphology, immunophenotype, genetic alterations, and clinical features.1 Next-generation sequencing and gene expression profiling (GEP) studies, in revolutionary fashion, changed the definition and classification of different entities, resulting in changes in treatment paradigms and discovery of new drugs.2 However, despite these recent advances in our understanding of lymphomas, cases remain that cannot be accurately classified into any of the recognized entities. Such cases have been referred to as “gray zone lymphomas” (GZLs), and their currently nebulous definition may lead to confusion for diagnosis and treatment. Among these, “GZLs with intermediate features between diffuse large B-cell lymphoma (DLBCL) and classical Hodgkin lymphoma (cHL),” initially described in 1998,3 entered the WHO classification in 2008 as a specific entity presenting intermediate clinical, morphologic, and phenotypical features between cHL and large B-cell lymphoma (LBCL) and, in particular, primary mediastinal (thymic) large B-cell lymphoma (PMBCL).1 Given the commonalities in GEP and the mutational landscape between cHL and PMBCL,4,5 it has been postulated that GZL might represent a biological transition state between these 2 entities, with a thymic B cell as the common cell of origin.6 Along with GZL, a subset of Epstein-Barr virus (EBV)–positive DLBCLs have been described with polymorphic and GZL-like morphology (polymorphic-EBV-L),7 and these cases have been classified as a form of EBV-positive DLBCL not otherwise specified in the WHO classification.1
The pathologic definition of GZL implies an intermediate morphology and discordant phenotype,1 but the diagnostic boundaries with the parental entities are not clear. To add precision to the GZL characterization, we previously proposed a morphologic and phenotypical spectrum ranging from cHL to LBCL, comprising 4 categories (groups 0 to 3).8 Briefly, group 0 corresponds to cases with morphology and cytologic appearance more typical of cHL but with expression of B-cell program markers (ie, strong and diffuse expression of CD20 on all tumor cells, frequently associated with other B-cell markers on all tumor cells), whereas group 3 is represented by cases with a more typical morphology of LBCL but with intense and diffuse CD30 expression. Between these 2 extremes are cases with a more intermediate morphology and divergent immunophenotypes (groups 1 and 2, herein referred to as bona fide GZL based on their concordance with the WHO definition1 ).
Despite this recent progress in describing GZL diversity, some important controversies and unmet questions persist. First, EBV infection is virtually absent in PMBCL but is reported in up to 20% of nodular sclerosis (NS) cHL. Polymorphic-EBV-L cases9 have a morphology closely related with cHL features,1,7,10 and the impact of EBV on the molecular phenotype of the tumor cells and tumor microenvironment (TME) compared with GZL is poorly characterized. Second, ∼30% of patients with a GZL diagnosis do not clinically present with mediastinal involvement, and a large anterior mass in particular.8,11-13 This observation highlights the open question of the cell of origin for GZL (ie, thymic vs non-thymic B cell). Third, the WHO classification defines GZL as an “intermediate” morphology group (bona fide GZL),1 but its molecular features compared with the parental entities are not well characterized.
To provide a better characterization of GZL and decipher underlying biological pathways, we performed GEP using whole-transcriptome RNA sequencing (RNA-seq) of a large retrospective and multicenter GZL cohort, jointly with polymorphic-EBV-L, cHL, and PMBCL samples. Combined with immunohistochemistry (IHC) validation, this analysis revealed that macrophage infiltration is a key feature of the TME along the GZL spectrum and that EBV is a key modulator of gene expression among B-cell lymphomas with intermediate morphology. We also identified 2 subtypes of bona fide GZL phenotypically resembling PMBCL and DLBCL, with PMBCL-type GZL being associated with a “thymic” anatomic location.
Methods
Study cohort
Cases were collected from the Lymphoma Study Association (LYSA) and the British Columbia Cancer Centre for Lymphoid Cancer tissue repositories; all cases were centrally reviewed by an international panel of experts in hematopathology (supplemental Figure 1), as previously reported8 and explained in detail in the supplemental Methods. In this study, all LBCL EBV-positive cases with a polymorphic morphology were labeled as polymorphic-EBV-L, and all GZL cases were EBV negative, in accordance with the WHO classification.1 As described in our previous report,8 cases with a morphology and cytologic appearance more typical of cHL but with strong and diffuse expression of CD20 on all tumor cells (group 0) and cases with LBCL morphology with CD30 expression on all tumor cells (group 3) were included to help with the definition of molecular boundaries.
In addition to the GZL and polymorphic-EBV-L cohorts, cHL and PMBCL cohorts were included in the study as a comparator. Institutional review board approval was granted (LYSA: 2017-006B, BCCRC IRB approval: H18-01460).
Nucleic acid extraction
Following deparaffinization, RNA was extracted from up to five 10 µm formalin-fixed paraffin-embedded tissue full sections using a FormaPure kit (Beckman Coulter Life Sciences, Indianapolis, IN) according to manufacturer’s instructions, including DNase treatment. RNA was quantified by using a spectrophotometer (NanoDrop; Thermo Fisher Scientific, Dreieich, Germany).
Library construction and sequencing
RNAs were subjected to library construction by using an NEBNext rRNA depletion Ultra II kit (New England Biolabs, Ipswich, MA) and 7 minutes of enzymatic fragmentation (RNase H). Cases were sequenced in pooled libraries on the NextSeq platform (paired-end 75 bp reads; Illumina, San Diego, CA).
Alignment and quality control
RNA-seq reads were aligned to GRCh38, and per-gene counts were generated by using the STAR aligner (version 2.5.3a_modified) (supplemental Methods). Picard version 2.18.1 (Broad Institute, Cambridge, MA) was used to calculate the proportion of usable bases (bases mapping to an exon or untranslated region) in each sample. A threshold for this value was calculated as the median minus 2 median absolute deviations, and samples with usable bases below this threshold were removed from downstream analysis (supplemental Figure 1 provides detailed patient numbers).
Differential expression analysis
The final cohort for GEP included 85 GZL-spectrum, 27 polymorphic-EBV-L, 14 cHL, and 14 PMBCL cases. GEP analysis was performed in R version 3.4.4 (R Foundation for Statistical Computing, Vienna, Austria) using the DESeq2 package (version 1.18.1). Raw count data were used to identify genes with counts per million ≥1 in at least 5% of the samples. Normalized log counts for these genes were calculated by using the vst function and were used as input for principal component analysis (PCA) and expression visualization. Differential expression (DE) comparisons were performed by using the DESeq function.
Gene set enrichment analysis
Preranked analysis was performed by using gene set enrichment analysis (GSEA) version 4.0.3. For enrichment based on DE, genes were ranked with a DE score calculated as –log10(q-value)*sign(log2FC). For enrichment of pathways associated with principal components (PCs), genes were ranked by Pearson correlation between expression of the gene and the PC score.
IHC analysis
Tissue microarray (TMA) and antibody information is provided in the supplemental Methods. TMAs were stained for T lymphocyte markers (CD4, CD8, CD3, Forkhead winged helix protein-3 [FOXP3], programmed cell death-1 [PD-1], and lymphocyte-activation gene 3 [LAG-3]), macrophage markers (CD68 and CD163), HLA-A/B/C (major histocompatibility complex-1 [MHC-I]), and HLA-DP/DQ/DR (MHC-II). The proportions of positive cells among all nucleated cells were independently calculated by 3 expert hematopathologists (K.T., T.M.-T., and P.F.). Discordant cases were discussed to reach consensus. MHC-I/II and programmed cell death-ligand 1/2 (PD-L1/2) scoring procedures are explained in the supplemental Methods.
Results
Clinical characteristics of the GZL, cHL, and PMBCL cohorts
As shown in Figure 1A, among the 85 GZL-spectrum cases, 56 (65%) were classified as bona fide GZL (group 1, n = 31 [36%]; group 2, n = 25 [29%]), 11 cases (13%) as group 0, and 18 cases (21%) as group 3 (detailed clinical characteristics are provided in Table 1). The median age of the bona fide GZL patients was 48 years, and the sex ratio was 1.1 (female/male). The median age of the polymorphic-EBV-L patients was 53 years, and the sex ratio was 0.5. The majority (63%) of bona fide GZL patients had anterior-mediastinal (referred to as “thymic”) involvement on computed tomography/positron emission tomography imaging at diagnosis, and the remaining cases had either non-anterior mediastinal involvement (12%) or no mediastinal involvement (25%) (referred to as “non-thymic” collectively). Polymorphic-EBV-L cases had less thymic involvement (33%) compared with bona fide GZL cases (P = .002), a similar rate of extranodal disease (52% vs 45% for polymorphic-EBV-L vs bona fide GZL) but with a distinct distribution of extranodal sites (mainly spleen and liver in polymorphic-EBV-L vs lung and bone marrow in bona fide GZL). Characteristics of the cHL cohorts (RNAseq, n = 14; TMA, n = 22) and the PMBCLs (n = 14) are presented in supplemental Table 1. Outcome data for patients treated with rituximab, cyclophosphamide, doxorubicin, vincristine, and prednisone (R-CHOP) and with doxorubicin, bleomycin, vinblastine, and dacarbazine (ABVD) are provided in supplemental Table 2.
![PCA in the combined cHL, GZL, polymorphic-EBV-L, and PMBCL dataset. (A) Schematic summarizing the GZL pathologic spectrum. Group 0 corresponds to cases with morphology more typical of cHL but with strong and diffuse CD20 expression on all tumor cells, whereas group 3 is represented by cases with a more typical morphology of LBCL but intense and diffuse CD30 expression. Group 3 samples can present with either PMBCL or DLBCL morphology. Between these 2 extremes are cases with a more intermediate morphology (labeled as bona fide GZL) with an immunophenotype divergent from the morphology. *Group 0 cases with mixed-cellularity–like morphology have less fibrosis. **Group 3 samples with PMBCL morphology can present with fibrosis. $Some group 2 cases can present a partial loss of CD20 expression. (B) The GZL, polymorphic-EBV-L, cHL, and PMBCL cases are shown in PC space. The x-axis represents the PC1 score (explaining 20% of the variance in the dataset), and the y-axis represents the PC2 score (17% of the variance). Each point represents a patient, colored based on its pathologic classification (cHL, PMBCL, polymorphic-EBV-L [“EBV”] or GZL group 0-3). cHL samples have high PC2 and low PC1 scores, whereas PMBCL samples have high PC1 and low PC2 scores. GZL samples lie in between, supporting the spectrum hypothesis of GZL as a continuum between cHL and PMBCL. The majority of the polymorphic-EBV-L samples can be isolated within PC2. The main biological pathways associated with PC1 and PC2 are described in colored boxes, and the direction of the corresponding arrows reflects positive enrichment of the pathway. H, Hodgkin; Ig, immunoglobulin; M/L, medium to large; NK, natural killer; RS, Reed-Sternberg.](https://ash.silverchair-cdn.com/ash/content_public/journal/bloodadvances/4/11/10.1182_bloodadvances.2020001923/1/m_advancesadv2020001923f1.png?Expires=1765883814&Signature=D4AYpKF-~LQaAuR~7JsEW612NDzFfklOdjrwk1qOQBohke3iMRg-JkOChm5xQvaLDlp1qmWOUEFFa~CXI7Cw5jcCGFTTzXPB4hTcsAmwNORAjX-iFFBiDnxBjzwpnbqYTaQCmn7S5pKI1LnKi5s~2R3VnMWjQIttJWOPpiZ0Lq9acKVXJzvlmhqHlifwKuJiUbAPHZUL2kTZ3V~5d48ZPxpQxfvSDexj9nTA3f0wL4x6rW-lsfVXQdr~n0ZYwjVCRaBgIjo26dAbrcRkoh7Ef2-i1OVk27aXeU8mDw8MvfUpg5vBGf6h97ao-zBtq5C2zy3lSBYgoHxXXw37CftDsA__&Key-Pair-Id=APKAIE5G5CRDK6RD3PGA)
PCA in the combined cHL, GZL, polymorphic-EBV-L, and PMBCL dataset. (A) Schematic summarizing the GZL pathologic spectrum. Group 0 corresponds to cases with morphology more typical of cHL but with strong and diffuse CD20 expression on all tumor cells, whereas group 3 is represented by cases with a more typical morphology of LBCL but intense and diffuse CD30 expression. Group 3 samples can present with either PMBCL or DLBCL morphology. Between these 2 extremes are cases with a more intermediate morphology (labeled as bona fide GZL) with an immunophenotype divergent from the morphology. *Group 0 cases with mixed-cellularity–like morphology have less fibrosis. **Group 3 samples with PMBCL morphology can present with fibrosis. $Some group 2 cases can present a partial loss of CD20 expression. (B) The GZL, polymorphic-EBV-L, cHL, and PMBCL cases are shown in PC space. The x-axis represents the PC1 score (explaining 20% of the variance in the dataset), and the y-axis represents the PC2 score (17% of the variance). Each point represents a patient, colored based on its pathologic classification (cHL, PMBCL, polymorphic-EBV-L [“EBV”] or GZL group 0-3). cHL samples have high PC2 and low PC1 scores, whereas PMBCL samples have high PC1 and low PC2 scores. GZL samples lie in between, supporting the spectrum hypothesis of GZL as a continuum between cHL and PMBCL. The majority of the polymorphic-EBV-L samples can be isolated within PC2. The main biological pathways associated with PC1 and PC2 are described in colored boxes, and the direction of the corresponding arrows reflects positive enrichment of the pathway. H, Hodgkin; Ig, immunoglobulin; M/L, medium to large; NK, natural killer; RS, Reed-Sternberg.
PCA in the combined cHL, GZL, polymorphic-EBV-L, and PMBCL dataset. (A) Schematic summarizing the GZL pathologic spectrum. Group 0 corresponds to cases with morphology more typical of cHL but with strong and diffuse CD20 expression on all tumor cells, whereas group 3 is represented by cases with a more typical morphology of LBCL but intense and diffuse CD30 expression. Group 3 samples can present with either PMBCL or DLBCL morphology. Between these 2 extremes are cases with a more intermediate morphology (labeled as bona fide GZL) with an immunophenotype divergent from the morphology. *Group 0 cases with mixed-cellularity–like morphology have less fibrosis. **Group 3 samples with PMBCL morphology can present with fibrosis. $Some group 2 cases can present a partial loss of CD20 expression. (B) The GZL, polymorphic-EBV-L, cHL, and PMBCL cases are shown in PC space. The x-axis represents the PC1 score (explaining 20% of the variance in the dataset), and the y-axis represents the PC2 score (17% of the variance). Each point represents a patient, colored based on its pathologic classification (cHL, PMBCL, polymorphic-EBV-L [“EBV”] or GZL group 0-3). cHL samples have high PC2 and low PC1 scores, whereas PMBCL samples have high PC1 and low PC2 scores. GZL samples lie in between, supporting the spectrum hypothesis of GZL as a continuum between cHL and PMBCL. The majority of the polymorphic-EBV-L samples can be isolated within PC2. The main biological pathways associated with PC1 and PC2 are described in colored boxes, and the direction of the corresponding arrows reflects positive enrichment of the pathway. H, Hodgkin; Ig, immunoglobulin; M/L, medium to large; NK, natural killer; RS, Reed-Sternberg.
Clinical characteristics of the GZL spectrum and polymorphic-EBV-DLBCL cohorts (N = 112)
| Variable | GZL spectrum, n = 85 | Polymorphic-EBV-L, n = 27 | ||
|---|---|---|---|---|
| Group 0, n = 11 | Bona fide (Group 1-2), n = 56 | Group 3, n = 18 | ||
| Center, n (%) | ||||
| Centre for Lymphoid Cancer | 1 (10) | 7 (13) | 15 (83) | 3 (11) |
| LYSA | 10 (90) | 49 (87) | 3 (17) | 24 (89) |
| Age | ||||
| Median (range), y | 26 (14-55) | 48 (19-90) | 66 (19-79) | 53 (16-79) |
| >60 y, n (%) | 0 (0) | 16 (33) | 12 (18) | 11 (41) |
| Sex, n (%) | ||||
| Female | 6 (55) | 30 (54) | 9 (50) | 8 (47) |
| Male | 5 (45) | 26 (46) | 9 (50) | 19 (53) |
| Mediastinal involvement, n (%) | n = 10 | n = 52 | n = 18 | n = 26 |
| Thymic | 8 (80) | 33 (63)* | 3 (17) | 7 (27) |
| Mediastinal, non-thymic | 0 (0) | 6 (12) | 4 (22) | 8 (31) |
| Nonmediastinal | 2 (20) | 13 (25) | 11 (61) | 11 (42) |
| Not available, n | 1 | 4 | 0 | 1 |
| Pathology group, n | Not applicable† | |||
| 0 | 11 | — | — | |
| 1 | — | 31 | — | |
| 2 | — | 25 | — | |
| 3 | — | — | 18 | |
| Hemoglobin | n = 11 | n = 48 | n = 17 | n = 21 |
| <12 g/dL, n (%) | 4 (36) | 24 (50) | 4 (24) | 12 (57) |
| Bulky disease (10 cm), n/N (%) | 2/11 (18) | 16/47 (34) | 4/18 (22) | 2/16 (12) |
| Ann Arbor stage, n (%) | n = 11 | n = 51 | n = 18 | n = 23 |
| 1-2 | 5 (45) | 24 (47) | 9 (50) | 8 (35) |
| 3-4 | 6 (55) | 27 (53) | 9 (50) | 15 (65) |
| Cases with extranodal involvement, n/N (%) | 6/11 (54) | 23/51 (45) | 9/18 (50) | 12/23 (52) |
| Spleen enlargement, n (%) | 2 (33) | 6 (26) | 0 (0) | 11 (91) |
| Liver, n (%) | 0 (0) | 4 (17) | 0 (0) | 4 (33) |
| Lung, n (%) | 3 (50) | 10 (44) | 1 (11) | 2 (16) |
| Bone marrow, n (%) | 1 (17) | 8 (35) | 3 (33) | 2 (16) |
| LDH > UNL, n/N (%) | 3/11 (27) | 26/45 (58) | 8/18 (44) | 10/21 (48) |
| aaIPI, n (%) | n = 11 | n = 47 | n = 18 | n = 22 |
| 0-1 | 8 (73) | 28 (60) | 10 (55) | 10 (45) |
| 2-3 | 3 (27) | 19 (40) | 8 (45) | 12 (55) |
Characteristics of the 56 bona fide GZL and 27 polymorphic-EBV-DLBCL (polymorphic-EBV-L) cases are presented. To provide a full characterization of the spectrum, the cohort also included 11 group 0 cases (cHL-like morphology with intense and diffuse CD20 expression on all tumor cells) and 18 group 3 cases (large B-cell morphology with intense and diffuse CD30 expression on all tumor cells).
aaIPI, age-adjusted International Prognostic Index; LDH, lactate dehydrogenase; UNL, upper limit of normal.
Two cases with a lung biopsy not included in DEA.
Groups for polymorphic-EBV-L are not applicable here because these cases are not defined as GZL in the WHO classification.1
TME biology and thymic anatomic location are main drivers of GZL variance
PCA was performed on GEP data from the cHL, GZL, polymorphic-EBV-L, and PMBCL cases. Much of the total variance was explained by PC1 and PC2 (20% and 17%, respectively) (supplemental Figure 2). The distribution of the samples based on their PC1 and PC2 scores produced a spectrum from cHL to PMBCL, with the GZL samples in-between. As shown in Figure 1B, cHL, bona fide GZL (groups 1-2), and group 0 samples tended to be more interspersed with each other compared with PMBCL and group 3 samples.
The main pathways enriched in the PC1- and PC2-associated genes were cell cycle, DNA replication (enriched in PMBCL/group 3 cases), TME (T cells, natural killer cells, humoral immune response, MHC-I presentation) and extracellular matrix (matrisome). The top 10 genes in the significantly enriched GSEA pathways could be grouped into 7 major classes, and expression of these showed expected variance across the dataset (Figure 2). PMBCL and group 3 cases were mostly clustered and exhibited a high replication signature (“cell cycle”), whereas cHL cases tended to be more mixed with bona fide GZL and group 0 cases. Most polymorphic-EBV-L cases formed a cluster enriched in TME and interferon (IFN)-related genes.
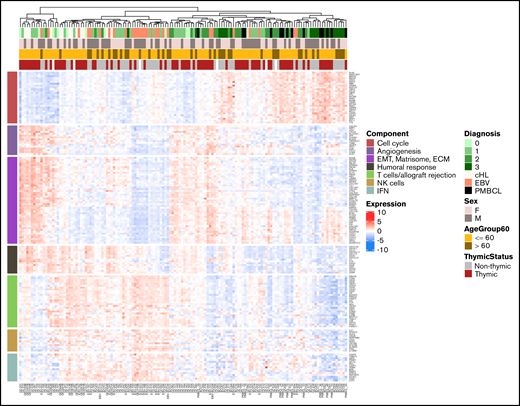
Unsupervised clustering of the cHL, GZL, polymorphic-EBV-L, and PMBCL samples based on the main biological pathways. Pathways were identified by using preranked GSEA of genes ordered by their correlation with PC1 or PC2 scores. The top 10 genes included in the core set of the significant pathways were selected. The pathways were grouped into functional categories including cell cycle (high in PMBCL and group 3), epithelial-mesenchymal transition (EMT)/matrisome/extracellular matrix (ECM), cellular microenvironment (NK cells, T cells/allograft rejection, IFN), and humoral response. Unsupervised clustering of the samples based on expression of these pathway genes revealed a spectrum with PMBCL and group 3 at one extreme, and cHL cases mixed with GZL groups 0, 1, and 2.
Unsupervised clustering of the cHL, GZL, polymorphic-EBV-L, and PMBCL samples based on the main biological pathways. Pathways were identified by using preranked GSEA of genes ordered by their correlation with PC1 or PC2 scores. The top 10 genes included in the core set of the significant pathways were selected. The pathways were grouped into functional categories including cell cycle (high in PMBCL and group 3), epithelial-mesenchymal transition (EMT)/matrisome/extracellular matrix (ECM), cellular microenvironment (NK cells, T cells/allograft rejection, IFN), and humoral response. Unsupervised clustering of the samples based on expression of these pathway genes revealed a spectrum with PMBCL and group 3 at one extreme, and cHL cases mixed with GZL groups 0, 1, and 2.
As a second step, we performed PCA with only the group 0, bona fide GZL, and group 3 cases to further examine the spectrum. In this analysis, PC1 reflected 20% of the variance and was strongly correlated with group 3 status (P = 2.4e−5) (Figure 3A). Within the bona fide GZL, groups 1 and 2 presented a similar PC1 score (P = .25), suggesting that they could be analyzed jointly at the gene expression level. In contrast to group 3, group 0 cases were not significantly distinguishable from bona fide GZL in any of the first 5 PCs (reflecting 96% of the total variance). PC1 was also associated with thymic status (P = 4.8e−5) and with the MHC-I processing pathway by preranked GSEA (P < .001). This is consistent with IHC data in which cases with thymic involvement were almost exclusively negative for MHC-I surface expression in contrast to non-thymic cases (97% and 66%, respectively; χ2 test, P = .0066) (Figure 3B).
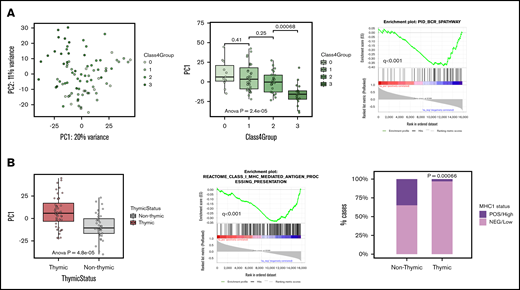
PCA of GZL spectrum samples. (A) The left plot shows group 0, bona fide GZL, and group 3 samples in PC1 vs PC2 space, reflecting 20% and 11% of the variance, respectively. The middle box plot shows the distribution of PC1 scores based on GZL group (each point represents a sample). Group 3 cases have significantly distinct PC1 scores, whereas group 0 do not (pairwise Student t tests). Group 1 and 2 GZL cases (bona fide GZL) also have similar PC1 scores (P = .25). The right plot shows that B-cell receptor (BCR) pathway genes were strongly negatively correlated with PC1 score, suggesting association with group 3 cases. (B) The left box plot shows PC1 scores based on thymic status within this cohort. In preranked GSEA (middle panel), genes negatively correlated with PC1 score were enriched in the class I antigen presentation pathway, suggesting that non-thymic cases may present a stronger MHC-I presentation machinery compared with thymic cases. Validating the GSEA findings, cases with thymic involvement had significantly lower MHC-I expression (assessed via IHC) compared with cases without thymic involvement (97% vs 66% for thymic vs non-thymic, respectively; χ2 test, P = .00066).
PCA of GZL spectrum samples. (A) The left plot shows group 0, bona fide GZL, and group 3 samples in PC1 vs PC2 space, reflecting 20% and 11% of the variance, respectively. The middle box plot shows the distribution of PC1 scores based on GZL group (each point represents a sample). Group 3 cases have significantly distinct PC1 scores, whereas group 0 do not (pairwise Student t tests). Group 1 and 2 GZL cases (bona fide GZL) also have similar PC1 scores (P = .25). The right plot shows that B-cell receptor (BCR) pathway genes were strongly negatively correlated with PC1 score, suggesting association with group 3 cases. (B) The left box plot shows PC1 scores based on thymic status within this cohort. In preranked GSEA (middle panel), genes negatively correlated with PC1 score were enriched in the class I antigen presentation pathway, suggesting that non-thymic cases may present a stronger MHC-I presentation machinery compared with thymic cases. Validating the GSEA findings, cases with thymic involvement had significantly lower MHC-I expression (assessed via IHC) compared with cases without thymic involvement (97% vs 66% for thymic vs non-thymic, respectively; χ2 test, P = .00066).
Detailed characterization of thymic bona fide GZL
PC analysis identified bona fide GZL with thymic involvement as a relatively uniform group. We therefore compared these cases (n = 31, referred to as thymic-GZL) with EBVneg cHL (n = 12, NS morphology) and PMBCL (n = 14) using differential gene expression analysis (DEA) (2 thymic-GZL cases were excluded due to the presence of >50% lung tissue in the FFPE section). Concordant with a “spectrum” hypothesis reflecting the tumor content, the expression level of known genes expressed by malignant cells (JAK2, STAT1, PDCD1LG2, and TRAF1) increased from cHL to thymic-GZL to PMBCL. Reciprocally, the expression level of TME-related genes (CD3E, CD3D, CD4, and CD8B) decreased.
We next aimed to identify GZL-specific genes by identifying those significantly upregulated or downregulated in both the thymic-GZL/cHL and thymic-GZL/PMBCL comparisons (q-value < 0.05 and absolute log2FC ≥1), but not significantly differentially expressed between cHL and PMBCL. We identified 8 genes downregulated and 61 upregulated in thymic-GZL compared to the parental entities. Pathway enrichment analysis of the upregulated genes (GSEA Molecular Signatures Database) highlighted TME-related biology in addition to some tumor-related pathways, including tumor necrosis factor-α signaling via NF-κB, MAPKK, and the AP-1 pathway (Table 2), which are also commonly disrupted in cHL biology.14 Unsupervised clustering using expression of the GZL-specific genes identified a GZL-predominant cluster and a cHL- and PMBCL-predominant cluster, as expected (Figure 4). Interestingly, 2 PMBCL cases clustered with thymic-GZL. One of them (PMBCL-39) was characterized by a region of the tumor with Reed-Sternberg–like cells and the other (PMBCL-90) by extensive macrophage infiltration. Four of the 8 downregulated genes were related to the presence of B cells or plasma cells (ie, TME B cells in the cHL samples and tumor cells in the PMBCL samples; VPREB3, CD79A, CD79B, and IGKV3OR2-268), suggesting that thymic-GZL are characterized by low B-cell content in the TME compared with cHL (supplemental Figure 3A-B).
GSEA using the 61 genes upregulated in thymic bona fide GZL compared with cHL and PMBCL
| Gene set name | No. of genes in gene set (K) | Description | Genes in overlap (k) | k/K | P | FDR q value |
|---|---|---|---|---|---|---|
| REACTOME_METALLOTHIONEINS_BIND_METALS | 11 | Metallothioneins bind metals | MT2A, MT1F, MT1G, MTIH, MT1M | 0.4545 | 4.1E-12 | 9.23E-9 |
| REACTOME_RESPONSE_TO_METAL_IONS | 14 | Response to metal ions | MT2A, MT1F, MT1G, MTIH, MT1M | 0.3571 | 1.77E-11 | 1.99E-8 |
| HALLMARK_TNFA_SIGNALING_VIA_NFKB | 200 | Genes regulated by NF-κB in response to TNF | IL1B, LIF, PTGS2, CXCL3, FOS, DUSP1, NR4A1, FOSB, NR4A2 | 0.0450 | 3.5E-11 | 2.62E-8 |
| REACTOME_INTERLEUKIN_10_SIGNALING | 46 | IL-10 signaling | IL1B, LIF, PTGS2, CXCL8, IL1RN | 0.1087 | 1.17E-8 | 6.56E-6 |
| NABA_MATRISOME | 1026 | Ensemble of genes encoding extracellular matrix and extracellular matrix-associated proteins | IL1B, LIF, CXCL3, CXCL8, IL1RN, THPO, HPX, MMP13, ADAMTS18, HYAL4, ASPN, EYS12 | 0.0117 | 7.15E-8 | 3.22E-5 |
| PID_AP1_PATHWAY | 70 | AP-1 transcription factor network | FOS, FOSB, MT2A, DUSP1, CXCL8 | 0.0714 | 1,00E-07 | 3.75E-5 |
| NABA_MATRISOME_ASSOCIATED | 751 | Ensemble of genes encoding ECM-associated proteins including ECM-affiliated proteins, ECM regulators and secreted factors | IL1B, LIF, CXCL3, CXCL8, IL1RN, THPO, HPX, MMP13, ADAMTS18, HYAL4 | 0.0133 | 3.07E-7 | 9.87E-5 |
| HALLMARK_INFLAMMATORY_RESPONSE | 200 | Genes defining inflammatory response | IL1B, LIF, CXCL8, MET, KCNJ2, FFAR2 | 0.0300 | 8.53E-7 | 2.4E-4 |
| REACTOME_INTERLEUKIN_4_AND_INTERLEUKIN_13_SIGNALING | 111 | IL-4 and IL-13 signaling | IL1B, LIF, PTGS2, FOS, CXCL8 | 0.0450 | 1.01E-6 | 2.52E-4 |
| REACTOME_CELLULAR_RESPONSES_TO_EXTERNAL_STIMULI | 535 | Cellular responses to external stimuli | MT2A, MT1F, MT1G, MTIH, MT1M, FOS, CXCL8, HSPA6 | 0.0150 | 2.22E-6 | 4.99E-4 |
GSEA was performed by using the Hallmark and C2 canonical pathway databases. FDR, false discovery rate.
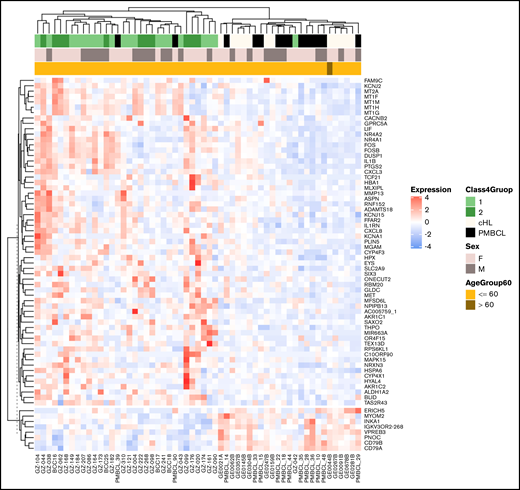
Expression of the bona fide GZL signature genes. Unsupervised clustering of the thymic bona fide GZL (groups 1-2), cHL (EBVneg only), and PMBCL cases shows 2 distinct clusters, with a small number of discordant PMBCL and GZL cases.
Expression of the bona fide GZL signature genes. Unsupervised clustering of the thymic bona fide GZL (groups 1-2), cHL (EBVneg only), and PMBCL cases shows 2 distinct clusters, with a small number of discordant PMBCL and GZL cases.
Among the GZL-specific pathways related to the TME was interleukin-10 (IL-10) signaling (IL1B, LIF, PTGS2, CXCL8, and IL1RN), suggesting a strong regulatory immune profile in thymic-GZL. Interestingly, at the IHC level, the expression of the regulatory T-cell marker FOXP3 tended to be higher in thymic-GZL compared with cHL and PMBCL (median percentage of FOXP3+ nucleated cells 10%, 4%, and 3% in thymic-GZL, cHL, and PMBCL, respectively) (Figure 5). Other TME-related pathways included matrisome (IL1B, LIF, CXCL3, CXCL8, IL1RN, THPO, HPX, MMP13, ADAMTS18, HYAL4, ASPN, and EYS12) and metallothioneins (MT2A, MT1F, MT1G, MTIH, and MT1M). Metallothioneins have been shown to promote tumor survival via inhibition of apoptosis and NF-κB pathway stimulation,15 and immune escape through tumor-associated macrophages (TAMs),16 reduction of MHC-I expression,17 angiogenesis, and extracellular matrix formation. Interestingly, all the thymic-GZL tumors showed loss of membranous MHC-I expression according to IHC (supplemental Figure 4A-B).

Microenvironment composition as assessed by IHC staining. (A) Box plots represent the percentage of nucleated cells that are positive for each given marker (P values calculated with Student t tests). T-cell subsets were analyzed by using CD3, CD4, CD8, FOXP3, PD1, and LAG-3. Macrophage subsets were identified by using CD68 and CD163. (B) Representative images of cHL, thymic bona fide GZL (ie, groups 1 and 2 with thymic involvement), and PMBCL tissue stains. Original magnification at 400× for all images. **P ≤ 0.01; ***P ≤ .001; ****P ≤ .0001. H&E, hematoxylin and eosin; ns, not significant (P > .05).
Microenvironment composition as assessed by IHC staining. (A) Box plots represent the percentage of nucleated cells that are positive for each given marker (P values calculated with Student t tests). T-cell subsets were analyzed by using CD3, CD4, CD8, FOXP3, PD1, and LAG-3. Macrophage subsets were identified by using CD68 and CD163. (B) Representative images of cHL, thymic bona fide GZL (ie, groups 1 and 2 with thymic involvement), and PMBCL tissue stains. Original magnification at 400× for all images. **P ≤ 0.01; ***P ≤ .001; ****P ≤ .0001. H&E, hematoxylin and eosin; ns, not significant (P > .05).
This prompted us to further investigate the TME in thymic-GZL, cHL, and PMBCL by using IHC. The total percentage of CD3+ T cells in the thymic-GZL TME was intermediate between cHL and PMBCL, as well as CD4+ T lymphocytes, in agreement with the gene expression findings. The presence of the regulatory T-cell markers LAG-3, PD1, and FOXP3 showed an immunosuppressive TME. Indeed, the fraction of positive cells was similar compared with cHL, even though the total number of CD4+ T cells was significantly less (Figure 5). As suggested by the GSEA signature, the bona fide GZL TME was enriched in TAMs, as shown by strong CD163 positivity and a significantly greater infiltrate compared with both cHL and PMBCL.
The thymic vs non-thymic bona fide GZL comparison sheds light on the specificity of the anatomic niche
We next investigated the relationship between thymic (n = 31) and non-thymic (n = 19) bona fide GZL cases (thymic involvement was unknown for 4 cases). We used the genes comprising the Lymph3Cx gene-set signature,18 which distinguishes PMBCL from DLBCL, to perform hierarchical clustering of the bona fide GZL cases. DLBCL-related genes formed a uniform cluster, suggesting that these genes provide insight into tumor cell expression phenotypes (Figure 6A). The majority of the non-thymic cases clustered together with higher expression of the DLBCL genes, compared with thymic cases that presented stronger expression of the PMBCL-related genes. However, several non-thymic cases also exhibited expression of some PMBCL genes, which might reflect the presence of Reed-Sternberg–like cells known to have a gene expression profile similar to that of PMBCL.4,5 A preranked GSEA interrogating genes in the Lymph3Cx gene-set confirmed strong enrichment of the PMBCL-related genes in thymic bona fide GZL and of the DLBCL-related genes in non-thymic cases (Figure 6B).
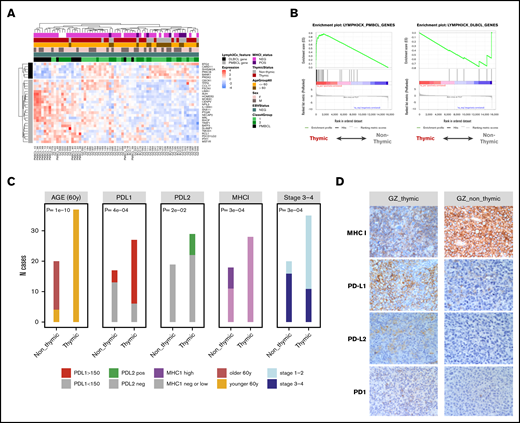
Comparison of thymic and non-thymic bona fide GZL cases. (A) Unsupervised clustering of the bona fide GZL (groups 1-2) samples using the 30 genes defined in the Lymph3Cx signature. The 6 DLBCL genes form a distinct cluster, suggesting that the sample clustering may reflect tumor cell biology. The majority of non-thymic GZL cases form a cluster on the right with high DLBCL gene expression. Conversely, the thymic cases show high expression of the PMBCL genes. (B) Enrichment of the 6 DLBCL and 24 PMBCL Lymph3Cx genes was assessed in the GZL cases using preranked GSEA, with genes ordered by the DE score between thymic and non-thymic GZL. Thymic cases are enriched in the PMBCL signature (adjusted P < .0001), whereas non-thymic cases were enriched in the DLBCL signature (adjusted P = .05). (C) Main clinical and IHC distinctions between thymic and non-thymic GZL. The H score for PDL1 was dichotomized as high (≥150) or low (<150). The H score for PDL2 was dichotomized as positive (>0) or negative (= 0). The MHC-I score was dichotomized as negative, low (cytoplasmic or no expression, or membranous expression in <90% of the tumor cells), or high (membranous expression in >90% of the tumor cells). (D) IHC of representative bona fide GZL thymic and non-thymic tumors for PD1, PD-L1, PD-L2, and MHC-I staining. Original magnification at 400× for all images.
Comparison of thymic and non-thymic bona fide GZL cases. (A) Unsupervised clustering of the bona fide GZL (groups 1-2) samples using the 30 genes defined in the Lymph3Cx signature. The 6 DLBCL genes form a distinct cluster, suggesting that the sample clustering may reflect tumor cell biology. The majority of non-thymic GZL cases form a cluster on the right with high DLBCL gene expression. Conversely, the thymic cases show high expression of the PMBCL genes. (B) Enrichment of the 6 DLBCL and 24 PMBCL Lymph3Cx genes was assessed in the GZL cases using preranked GSEA, with genes ordered by the DE score between thymic and non-thymic GZL. Thymic cases are enriched in the PMBCL signature (adjusted P < .0001), whereas non-thymic cases were enriched in the DLBCL signature (adjusted P = .05). (C) Main clinical and IHC distinctions between thymic and non-thymic GZL. The H score for PDL1 was dichotomized as high (≥150) or low (<150). The H score for PDL2 was dichotomized as positive (>0) or negative (= 0). The MHC-I score was dichotomized as negative, low (cytoplasmic or no expression, or membranous expression in <90% of the tumor cells), or high (membranous expression in >90% of the tumor cells). (D) IHC of representative bona fide GZL thymic and non-thymic tumors for PD1, PD-L1, PD-L2, and MHC-I staining. Original magnification at 400× for all images.
Moreover, loss of MHC-I membranous expression was found in all PMBCL and thymic bona fide GZL cases (supplemental Figure 4A) vs 24% and 39% cHL and non-thymic bona fide GZL, respectively (P = .0007). PD-L2 (24% positive vs 0%; P = .02) and PD-L1 (78% with H score >150 vs 23%; P = 4.e−4) expression was higher in the thymic vs non-thymic cases (Figure 6C-D). MHC-II expression was similar across PMBCL, cHL, and thymic and non-thymic bona fide GZL (loss of membranous expression in 40%, 27%, 44%, and 38% of cases, respectively).
These data support the concept of 2 distinct types of GZL: one related to NS-cHL and PMBCL (with a postulated thymic B-cell cell of origin) and a second more closely related to cHL (non-NS) and DLBCL. TME features in the non-thymic cases were consistent with an intermediate morphology and a spectrum of T lymphocyte infiltration with exhaustion or regulatory markers. The greater TAM infiltrate, specific to GZL, was also found in the non-thymic cases (supplemental Figure 4B). The clinical presentation also supports the concept of a PMBCL vs DLBCL dichotomy (Table 1; supplemental Table 4), in which patients presenting with thymic GZL were younger and frequently presented with localized and bulky disease, in contrast to non-thymic GZL cases, which were characterized by disseminated disease with different extranodal sites.
In summary, the non-thymic cases (“DLBCL-like GZL”), although presenting with intermediate morphology and TME features between cHL and LBCL, are distinct from the thymic cases (“PMBCL-like GZL”) and are not part of the same cHL-GZL-PMBCL spectrum.
Group 0 and group 3: where should we draw the GZL border?
We next sought to revisit the GZL spectrum extremes and assess their relationship with the parental entities, cHL (EBVneg) and PMBCL, to determine if groups 0 and 3 should be considered part of the GZL spectrum.
We performed DE between cHL (EBVneg) and the group 0 cases (n = 11). Among the genes downregulated in group 0 vs cHL, we observed many immunoglobulin genes, reflecting the abundance of small B cells in the cHL TME. This was further confirmed at the IHC level, where group 0 had fewer small B-cell infiltrates compared with cHL (although evaluation was limited to the TMA area) but higher TAM infiltration (CD163 and CD163/CD68 ratio) (supplemental Figure 5A-B). GZL-specific genes identified in bona fide GZL were also enriched within group 0 compared with cHL (supplemental Figure 5C), suggesting that these cases might be part of the GZL spectrum with an intermediate phenotype between cHL and bona fide GZL consistent with the overall PCA analysis (Figure 1B).
In the group 3 vs PMBCL PCA analysis, PC2 (13% of the variance) reflected the LymphC3x classification18,19 (assessed via DLBCL90 NanoString assay18 ) (supplemental Methods), with clear separation of the samples based on their DLBCL/PMBCL status (supplemental Figure 6A). In contrast, GZL-specific gene expression was not correlated with PC2 and could not discriminate group 3 samples from PMBCL (supplemental Figure 6B-C).
These data confirm the results of the initial PC analysis in which bona fide GZL and group 0 were intermingled and group 3 cases clustered separately in PC3. In summary, this suggests that group 0 cases should be included in the GZL spectrum, whereas group 3 cases more closely resemble DLBCL/PMBCL.
EBV-associated phenotypes
To further investigate the relationship between GZL and polymorphic-EBV-L, DEA was performed between these 2 entities. Given the close relationship between bona fide GZL and group 0 shown by DE and PCA, we included both bona fide GZL and group 0 in this analysis. Polymorphic-EBV-L cases were not significantly older (53 vs 46 years of age) but did have a male bias (70% vs 46%; P = .03). They presented with less thymic (27% vs 66%; P < .001) and less bulky disease compared with GZL cases (12% bulky in polymorphic-EBV-L vs 31% in GZL; P = .1) (supplemental Table 5).
The DEA included 27 polymorphic-EBV-L cases and 65 GZL cases that passed quality filtering (as before, 2 cases were excluded due to lung involvement). A total of 743 genes passed the significance threshold (q-value <0.05 and absolute log2FC ≥1) (supplemental Figure 7A). Among the most significant genes upregulated in polymorphic-EBV-L, CD160 is a glycoprotein strongly associated with natural killer cells and CD8+ lymphocytes, which was confirmed by IHC in which polymorphic-EBV-L cases had more CD8 cells compared with GZL (P = .06). Conversely, various interleukin receptors and ligands, such as IL17RB, IL13RA2, IL5RA, and CCR4, were upregulated in GZL cases, whereas the CCR4 paralog CX3CR1 was significantly upregulated in polymorphic-EBV-L, highlighting the modulation in chemokine expression induced by EBV. Using preranked GSEA, we examined the enrichment of the GZL-specific genes in the polymorphic-EBV-L vs GZL DE results. As shown in supplemental Figure 7A, GZL were strongly enriched in the GZL-specific signature compared with polymorphic-EBV-L cases. Concordantly, the tumor necrosis factor-α via NF-κB pathway and IL-2/STAT5 signaling pathways (GSEA hallmarks) were significantly upregulated in GZL cases, whereas IFN-γ and T-cell receptor signaling pathways were upregulated in polymorphic-EBV-L (supplemental Table 6). According to IHC, CD163 and CD8 cells were enriched in polymorphic-EBV-L vs GZL cases (mean, 25% vs 17% and 39% vs 28%, respectively; P = .02) (supplemental Figure 7B).
Discussion
We present here the molecular characterization and description of the TME in a large series of GZL and polymorphic-EBV-L cases. Using RNA-seq analysis, we highlight the main biological processes underlying the cHL-GZL-PMBCL spectrum related to immune cell infiltration and extracellular matrix components. Although heterogeneous, GZLs are characterized by a specific immunomodulatory TME composed of TAMs and T-cell subsets expressing regulatory markers. Leveraging the comparison of GZL to polymorphic-EBV-L, we highlight the correlates of latent EBV infection on the level of changes in GEP and TME composition. Moreover, within the GZL, 2 subtypes could be distinguished: (1) cases resembling PMBCL that were associated with the thymic anatomic niche (PMBCL-like GZL); and (2) cases resembling DLBCL that presented predominantly in non-thymic locations (DLBCL-like GZL). PMBCL-like GZL (thymic-GZL) presented a prominent immune escape phenotype with loss of MHC-I expression in nearly all cases, expression of CD4 inhibitory markers (FOXP3, LAG-3, and PD-1), and high abundance of TAMs.
Our results suggest macrophages as a key element of the GZL TME. Interestingly, the presence of macrophages was associated with a low small B-cell content, a feature that is consistent with findings in cHL at both pretreatment and relapse time points20 and has been described as being associated with a poor treatment outcome.21-23 These data synergize with a study by Pittaluga et al24 reporting a stronger macrophage signature in 20 mediastinal-GZL patients compared with PMBCL but weaker compared with cHL. This TAM-rich cHL-like TME might in part explain the previously reported chemo-refractory phenotype among GZL,25,26 even though the prognostic impact of TAMs in other B-cell malignancies remains controversial.27 Interestingly, the study by Pittaluga et al24 identified a NF-κB signature that was stronger in mediastinal GZL compared with PMBCL, but it remains an open question if this signature is reflecting mostly tumor cells or macrophage biology or both. Of note, Wilson et al26 reported that among 24 GZL patients treated with dose-adjusted etoposide, prednisone, vincristine, cyclophosphamide, doxorubicin, and rituximab (DA-EPOCH-R), DC-SIGN–postitive tumor-associated dendritic cell/macrophage infiltration was associated with inferior outcome. We also found that a higher infiltration of CD163/CD68 cells tended to be associated with worse outcome in our GZL cohort (data not shown), but the heterogeneity of treatment should be considered as a major confounder. Recently, a macrophage immune checkpoint inhibitor blocking CD4728 has shown promising activity in non-Hodgkin lymphoma when combined with rituximab, further emphasizing the importance of this finding for GZL.
A key feature revealed by our analysis is the presence of associations with a thymic or anterior mediastinal involvement, as reported in PMBCL or NS cHL. The younger age of patients with mediastinal involvement was previously reported by others,29 but the detailed characterization of the distinct clinical presentation shown here adds further support toward a distinction from non-thymic cases. Moreover, the DEA revealed distinct phenotypic differences between thymic and non-thymic GZL, reminiscent of a previously described PMBCL vs DLBCL dichotomization.5,18 This suggests a potentially distinct cell of origin for these 2 groups of GZL, with implications for differential modes of evolution and acquisition of somatic gene mutations yet to be uncovered. Supporting the DEA, we also found that PD-L1 and PD-L2 protein expression was higher in the thymic cases. This finding is consistent with data from Eberle et al,29 who reported 9p24.1 gain/amplification in 3 (38%) of 8 non-mediastinal samples vs 14 (61%) of 23 mediastinal samples, which further supports the rationale for PD-1 checkpoint inhibition in this disease.8 A similar frequency of 9p alterations was also found in our previous report,30 even though no significant distinction between thymic and non-thymic cases was observed (supplemental Table 7). Finally, the pattern of MHC-I expression across the full cohort was of particular interest. Indeed, all the PMBCL as well as all the thymic-GZL cases presented MHC-I membranous loss of expression, as opposed to only 76% of the EBVneg-cHL and 61% of the non-thymic GZL. We also confirmed the loss of MHC-I membranous expression as a specific PMBCL feature in a larger cohort of 68 cases (97% of loss; data not shown). Frequent loss of MHC-I expression in PMBCL has been reported previously31,32 but not to this extent. The pattern observed in the non-thymic GZL is consistent with the 55% of MHC-I loss reported in DLBCL.33,34 One of the underlying mechanisms responsible for this loss of expression includes deleterious B2M mutations reported in up to 50% of PMBCL cases,35,36 but extrapolation of this mechanism to GZL requires further mutational analysis.
To provide a full spectrum of phenotypic and morphologic variation between LBCL- and cHL-like cases, we purposefully included group 3 (CD30+ LBCL) and group 0 (CD20+ cHL-like) cases in our analysis.8 For group 3, our data suggest removal of these cases from the GZL spectrum due to strong B-cell receptor signaling and the absence of a GZL-specific signature. For the group 0 cases, there is significant inconsistency in the literature and in pathology practice how cases with a cHL morphology and expression of B-cell program markers are classified (ie, GZL or cHL). Indeed in this cohort, one-half of the group 0 cases were treated with a DLBCL-like regimen including rituximab, which provided the primary rationale to study these cases on the molecular level. In our data, the GZL-like gene expression signature and TME features of the group 0 cases, with low number of small B cells and a high TAM infiltrate, imply that they should be defined as part of the GZL spectrum. Additional molecular data and/or confirmatory results in independent cohorts would be of great interest to inform on future GZL classification systems.
Finally, EBV status was a key modulator of gene expression in this dataset. EBV-specific pathways related to IFN-γ, cytotoxic T cells, antigen processing, and innate immunity with a greater TAM content, as previously described in EBVpos cHL,37,38 were highlighted. Others previously reported a specific TME for EBV-DLBCL vs DLBCL, with an elevated M2 macrophage score as assessed by using NanoString methods.39 These polymorphic-EBV-L patients might benefit from improved therapeutic approaches, such as emerging EBV-specific cellular therapy options.40,41
In conclusion, we provide a comprehensive phenotypic characterization of GZL, highlighting the importance of TME biology and macrophage infiltration in particular. We confirmed and further characterized the existence of 2 distinct groups of GZL with presumably distinct cells of origin and evolutionary modes. Mutational analysis is warranted to further explore the biological mechanisms leading to these distinct phenotypes.
Requests for data-sharing may be submitted to the corresponding author (Christian Steidl; e-mail: csteidl@bccancer.bc.ca).
Acknowledgments
The authors thank the Centre for Lymphoid Cancer, the Lymphopath Consortium, and the CeVi Collection Project from the CALYM Carnot Institute (funded by the French National Research Council [ANR]) for sending their samples.
The authors thank the LYSARC (The Lymphoma Academic Research Organisation) and the LYSA-Pathology group included the following: Véronique Jalloux, Nadine Vailhen, Emeline Mollaret, Aurélie Gaultier, Pauline Desormeaux, Lauriane Brand, and Cassandre Houdin. The platform for digital slides of the Institut Mondor de Recherche Biomédicale was supported by the ARC foundation and submitted to a validation plan executed by the LYSARC.
This study was supported by the Allen Frontiers Group (Allen Distinguished Investigator Award to C. Steidl), the Terry Fox Research Institute (team grant #1061), and the BC Cancer Foundation. C. Sarkozy is supported by the Nuovo Soldati foundation and a fellowships grant from Plan Cancer 2014-2019, soutien 2017 de l’ITMO Cancer pour la formation à la recherche translationnelle en cancérologie 2017 (Allocation ASC17021CSA, project C17021CS). C. Steidl is supported by the Michael Smith Foundation for Health Research (Career Investigator Award) and the Canadian Institutes of Health Research (New Investigator Award).
Authorship
Contribution: C. Sarkozy, L.C., A.T.-G., and C. Steidl designed and performed the research, analyzed and interpreted data, and wrote the paper; E.A.C. performed library construction and RNA-seq; K.T., T.M.-T., G.W.S., P.F., A.M., A.T.-G., C.C.-B., and D.D. contributed to the pathological review of the cases; K.T., T.M.-T., and P.F. stained and scored IHC work; L.C. and G.D. provided bioinformatics assistance; C. Sarkozy, M.B., and A.T. performed RNA extractions and helped in sample collection; C.L., C.C.B., T.J.M., P.F., G.A.S., and A.T.-G. provided the patient samples; C. Sarkozy, D.W.S., K.J.S., and G.A.S. treated the patients and collected the clinical data;, C.Sarkozy, C.Steidl, K.J.S., G.A.S., and D.W.S. assembled and interpreted clinical data; and A.T.-G. and C. Steidl supervised the study.
Conflict-of-interest disclosure: C. Steidl has performed consultancy for Seattle Genetics, Curis Inc., Roche, AbbVie, Juno Therapeutics, and Bayer; and has received research funding from Bristol-Myers Squibb and Trillium Therapeutics Inc. D.W.S. has performed consultancy for Janssen and Celgene; and received research funding from Roche/Genentech, Janssen, and NanoString Technologies. K.J.S. received honoraria and provided consultancy to Bristol-Myers Squibb, Merck, Takeda, Verastem, and Servier. The remaining authors declare no competing financial interests.
Correspondence: Christian Steidl, Centre for Lymphoid Cancer, British Columbia Cancer, 675 W 10th Ave, Vancouver, BC V5Z1L3, Canada; e-mail: csteidl@bccancer.bc.ca.

