

Key Points
MF exhibits substantial genetic subclones, with a median of 6 subclones across samples.
Stage progression was correlated with an increase in intratumoral heterogeneity and redistribution of mutations from stem to clades.

Abstract
Mycosis fungoides (MF) is a slowly progressive cutaneous T-cell lymphoma (CTCL) for which there is no cure. In the early plaque stage, the disease is indolent, but development of tumors heralds an increased risk of metastasis and death. Previous research into the genomic landscape of CTCL revealed a complex pattern of >50 driver mutations implicated in more than a dozen signaling pathways. However, the genomic mechanisms governing disease progression and treatment resistance remain unknown. Building on our previous discovery of the clonotypic heterogeneity of MF, we hypothesized that this lymphoma does not progress in a linear fashion as currently thought but comprises heterogeneous mutational subclones. We sequenced exomes of 49 cases of MF and identified 28 previously unreported putative driver genes. MF exhibited extensive intratumoral heterogeneity (ITH) of a median of 6 subclones showing a branched phylogenetic relationship pattern. Stage progression was correlated with an increase in ITH and redistribution of mutations from stem to clades. The pattern of clonal driver mutations was highly variable, with no consistent mutations among patients. Similar intratumoral heterogeneity was detected in leukemic CTCL (Sézary syndrome). Based on these findings, we propose a model of MF pathogenesis comprising divergent evolution of cancer subclones and discuss how ITH affects the efficacy of targeted drug therapies and immunotherapies for CTCL.
Introduction
Cutaneous T-cell lymphoma (CTCL) is the most common form of T-cell neoplasm, representing 5% to 10% of total non-Hodgkin lymphomas.1,2 The prevalent form of CTCL is mycosis fungoides (MF), which initially presents as erythematous scaly patches and plaques on the skin (stage T1-T2, early lesions) and eventually progresses to advanced lesions, tumors (T3), and erythroderma (T4). Progression to stage T3 is a threshold event during the clinical progression of MF, associated with a rapid drop in 5-year overall survival from >80% to 44%. Like many other T-cell lymphomas, MF comprises an area of unmet clinical need. There are no curative treatments available, and the current understanding of the pathogenesis of CTCL is incomplete and has not yet provided clues for effective targeted therapies. Previous analyses of the genomic landscape of CTCL revealed involvement of numerous, potentially druggable pathways in CTCL, such as NF-κB, NOTCH, and JAK-STAT signaling or disturbance in the biochemical machinery ensuring DNA repair and chromatin stability.3-6 Unfortunately, the interindividual variability in the genomic mutation pattern is extensive, and no recurrent mutations have been discovered.
For decades, CTCL has been considered a monoclonal disease, originating from a single, transformed memory T cell residing in the skin. Our recent data challenged this view. We proposed that MF is a complex, polyclonal disease likely to be caused by seeding of clonally diverse precursors to the skin.7 MF, even in early stages, shows vast clonotypic diversity, both within the single skin lesion and between different skin lesions (topographic heterogeneity). Because the diverse malignant T-cell clones are likely subject to different selective pressures during tumor evolution, we hypothesized that MF is heterogeneous with respect to the pattern of genomic mutations. We considered this hypothesis worthwhile to examine because genomic heterogeneity of malignant tumors is now considered to be of clinical relevance.8 Subclonal heterogeneity provides material for tumor evolution, is a source of drug resistance, and offers a mechanism by which cancers escape immune surveillance. Tumors with extensive subclonal heterogeneity have an overall worse prognosis than cancers that are clonal with respect to driver mutations.
The primary objective of this study was to investigate the hypothesis that MF exhibits subclonal genomic heterogeneity in terms of single-nucleotide mutations and somatic copy-number aberrations (gains or losses of chromosomal segments). We also addressed the practically relevant issue of the clonality of driver mutations and examined the differences between low-risk (patch and plaque) and high-risk lesions (tumors). Our results indicate that MF is subclonally heterogeneous, which may explain the low rate of response to therapy and development of resistance in relapsing disease.
Material and methods
Samples and sequencing
Ethical approval HREBA.CC-16-0820-REN1 was obtained from the Health Research Ethics Board of Alberta Cancer Committee. Material (4-mm punch skin biopsies from lesional skin and 10 mL of blood) was collected from 31 consented patients with a diagnosis of MF in stages IA to IVA2 (Figure 1; supplemental Table 1). The biopsies and blood were processed for storage as explained in previous methods.7 Frozen biopsies were sectioned at 10 µm and microdissected to isolate clusters of malignant cells, as previously described in detail.7 Peripheral blood mononuclear cells were used as a source of control DNA, except for sample MF2, for which we did not have matching blood and therefore used microdissected epithelial cells from epidermis as the control. The NEBNext Ultra II DNA Library Prep Kit for Illumina (catalog #E7645S; New England Biolabs, Ipswich, MA) was used for DNA library preparation, and SSELXT Human All Exon V6 +UTR probes (Agilent Technologies, Santa Clara, CA) were used for the exome and untranslated region sequence capture. The DNA libraries were sequenced on an Illumina HiSeq 1500 sequencer using a paired-end 150-bp kit (catalog #PE-402-4002; Hiseq PE Rapid Cluster Kit V2) or NovaSeq 6000 S4 Reagent Kit (300 cycles; catalog #20012866). Mean depth (defined as the mean number of reads covering the captured coding sequence of a haploid reference) was 156.7× for the samples and 152.3× for the normal controls, with 94.7% of the genome covered >30×. Detailed depth for each sample is provided in supplemental Table 2.
![Summary of experimental methods and data analysis. (A) From 31 patients with MF, 49 biopsies were obtained. In 6 patients with tumor (TMR) stage disease, paired biopsies from TMRs and late-stage plaques (LSPs) were obtained. (B) TMR cell clusters microdissected from the lesional skin and matching control tissue (peripheral blood or the epidermis; not shown) were sequenced by whole-exome sequencing (WES). (C) The genetic aberration data (single-nucleotide variants [SNVs] and CNAs) were used for the reconstruction of MF phylogenetic trees. CNA, copy-number aberration; ESP, early-stage plaque; GATK, Genome Analysis Toolkit; PCR, polymerase chain reaction; SSV, single-somatic variants; TCF, tumor cell fraction; WGS, whole-genome sequencing.](https://ash.silverchair-cdn.com/ash/content_public/journal/bloodadvances/4/11/10.1182_bloodadvances.2020001441/1/m_advancesadv2020001441f1.png?Expires=1769100352&Signature=To6Hz~yUDau5ozYMOEqzpu-aRWllXkOV4sbpWC5CWDVnNcrB-~W76R8bDekYF46gKUGE~oFKT5d7etnXKz009Cp3DCvFFlwIaPS~xStXSkW5ZqOuXYgyTASnE3~BzBbFsqF9D-9RbkLEu-8YlRw4HzRxqON0vD-7vtElnQ0L4HNaq8juApaG8AB0a~yu5ogWqYeCxIgL8z00WfUBSetE4uroBTwbFSrmWkRgWI8hK8QqUwXYMUND5iV7pV4t4Fu4pSolNfQuzO4-BLttn6u2Th5z~c5Jz-PdTRE2CANdwcWrLmx42twdndreVYzncG-pOhU5-bjbpntHEKIbwejRbw__&Key-Pair-Id=APKAIE5G5CRDK6RD3PGA)
Summary of experimental methods and data analysis. (A) From 31 patients with MF, 49 biopsies were obtained. In 6 patients with tumor (TMR) stage disease, paired biopsies from TMRs and late-stage plaques (LSPs) were obtained. (B) TMR cell clusters microdissected from the lesional skin and matching control tissue (peripheral blood or the epidermis; not shown) were sequenced by whole-exome sequencing (WES). (C) The genetic aberration data (single-nucleotide variants [SNVs] and CNAs) were used for the reconstruction of MF phylogenetic trees. CNA, copy-number aberration; ESP, early-stage plaque; GATK, Genome Analysis Toolkit; PCR, polymerase chain reaction; SSV, single-somatic variants; TCF, tumor cell fraction; WGS, whole-genome sequencing.
Summary of experimental methods and data analysis. (A) From 31 patients with MF, 49 biopsies were obtained. In 6 patients with tumor (TMR) stage disease, paired biopsies from TMRs and late-stage plaques (LSPs) were obtained. (B) TMR cell clusters microdissected from the lesional skin and matching control tissue (peripheral blood or the epidermis; not shown) were sequenced by whole-exome sequencing (WES). (C) The genetic aberration data (single-nucleotide variants [SNVs] and CNAs) were used for the reconstruction of MF phylogenetic trees. CNA, copy-number aberration; ESP, early-stage plaque; GATK, Genome Analysis Toolkit; PCR, polymerase chain reaction; SSV, single-somatic variants; TCF, tumor cell fraction; WGS, whole-genome sequencing.
Bioinformatic analysis
The raw fastq files generated from whole-exome sequencing were processed through the GATK (version 4.0.10) best practices workflow9 and aligned to the hg38 reference genome. Somatic variants (SVs), including single somatic mutations and indels, were identified by 2 different variant callers: MuTect2 (version 2.1)9,10 and Strelka2 (version 2.9.10).11 The variants filtering as “passed” by both variant callers were used for downstream analysis at the threshold value of 0.25. The functional effects of SVs were identified by the Variant Effect Predictor (version 95.2).12 CNAs and TCF were identified using TitanCNA (version 1.20.1).12,13 PhyloWGS (version 1.0-rc2) was used for phylogenetic analysis to identify clones and subclones (Figure 1).12-14 The T-cell receptor (TCR) clonotypes were identified using MiXCR (version 2.1.10).15
Sequencing data from previous sequencing studies (supplemental Table 3) in CTCL were obtained from public databases and were subjected to the same bioinformatic analysis as described, with the exception that only MuTect2 was used for variant calling.
Results
Genomic landscape of driver genes in MF
We decided to revisit the genomics of MF because previous studies largely focused on Sézary syndrome (SS), a rare leukemia-lymphoma syndrome that, although related to MF, is considered a separate entity. Only 11% of all previously sequenced CTCL cases were MF, and the material for sequencing was the entire skin biopsy, which might have introduced errors resulting from the contribution of mutations from cells other than lymphoma.16 To enrich the material in neoplastic cells, we microdissected clusters of lymphoma cells from 49 skin biopsies from 31 MF patients in various stages of disease (I-IV) (supplemental Table 1) for whole-exome sequencing (Figure 1). For the analysis, we decided to group the samples not only by clinical stage but also by morphological features of the biopsied lesion. In stages I to IIA, the lesions as per definition were either patches or plaques (ESPs), but in stages ≥IIB, we distinguished between biopsies from tumors and plaques (LSPs).
We identified a median of 765 nonsynonymous SVs in ESPs, 1269 in LSPs, and 2133 in tumors (Figure 2), demonstrating that mutations accumulate during disease progression. The increased mutation with disease progression was found to be significant, with a P value of .0399. These numbers are an order of magnitude higher than those previously found in a meta-analysis of studies on CTCL genomics (median, 42 nonsynonymous mutations6 ), although other research groups also reported high mutational burden in CTCL.5 The high number of mutations was likely a result of the high TCF in our material (supplemental Figure 1) as well as the deeper exome sequencing compared with the previously published data. However, the observed increased mutational load in tumor samples was not due to increased tumor cell purity, because the range and median values of TCF did not differ, and there was no significant correlation between TCF and SVs of ESPs, LSPs, and tumors (supplemental Figure 1B-C). Among the mutations detected in our material, 265 genes were previously adjudicated as driver genes in cancer17 and 56 genes were reported in CTCL.3,4,6,18-23 The current analysis adds 28 genes fulfilling the criteria for cancer drivers17 that we found to be mutated in >20% of patients (Figure 2; supplemental Table 4 provides a complete list of the mutated genes). Among these 28 genes, 5 (ZFHX3, CIC, EP300, PIK3CB, and HUWE1) were found in 33% to 45% of the samples (Figure 2). Most mutated genes previously described as drivers mapped to already-known pathways, such as transcription factors (34 genes) followed by chromatin modification (22 genes). The new mutated pathways found here were the Wnt/B catenin (4 mutated genes), microRNA processing (DICER1), protein homeostasis (HUWE1), and genome integrity pathways (POLE, PDS5B). Lastly, we found that mutations in the tumor suppressor genes dominated the known oncogenes (supplemental Figure 2), analogous to findings previously reported in other heterogeneous solid tumors.24,25
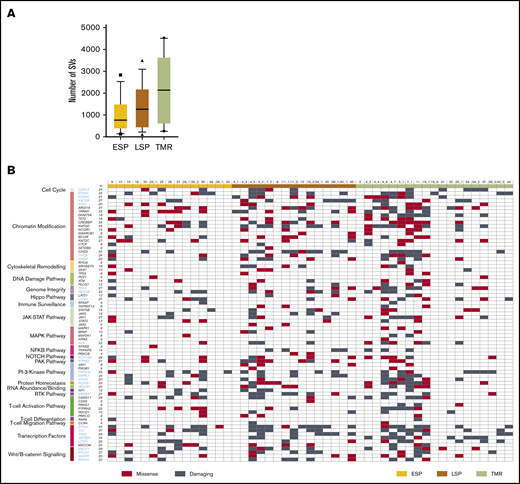
Mutational landscape of putative driver genes in MF. (A) Number of nonsynonymous SVs in ESP, LSP, and tumor (TMR) samples. Box-and-whisker plot showing 90th percentile, respectively. Filled square indicates 10th percentile; filled triangle indicates 90th percentile. (B) Identification of amino acid–altering mutations in 75 putative driver genes across 21 different pathways. Black gene symbols annotate the previously reported 47 driver genes in CTCL; the previously unreported 28 potential drivers identified in this study are highlighted in blue. Damaging mutations indicate frameshift mutations, short read insertion and deletion (<6 bp), stop gain, or stop loss.
Mutational landscape of putative driver genes in MF. (A) Number of nonsynonymous SVs in ESP, LSP, and tumor (TMR) samples. Box-and-whisker plot showing 90th percentile, respectively. Filled square indicates 10th percentile; filled triangle indicates 90th percentile. (B) Identification of amino acid–altering mutations in 75 putative driver genes across 21 different pathways. Black gene symbols annotate the previously reported 47 driver genes in CTCL; the previously unreported 28 potential drivers identified in this study are highlighted in blue. Damaging mutations indicate frameshift mutations, short read insertion and deletion (<6 bp), stop gain, or stop loss.
We also investigated the CNA profiles for all our samples (Figure 3A) and were able to confirm the previously noted amplifications of chromosomes 1 and 7 and deletions in chromosome 9 in MF.26 The patterns of change in the CNA profiles were similar for tumor and LSP samples but different in ESP samples, which surprisingly were characterized by larger CNA fragments and increased copy number gains across all chromosomes except 6, 9, 13, 19, and 21 (Figure 3A). We also analyzed CNA changes in the putative driver genes. We reproduced the previous finding of Choi et al4,7 regarding the deletion of TNFAIP3 and found additional genes that were affected in all investigated samples: deletions in RHOA (tumor suppressors) and amplifications in the oncogene BRAF (Figure 3B). In summary, we found that progression from early-stage (I) to advanced-stage disease (≥IIB) was associated with an increased number of nonsynonymous SNVs, both in tumors and plaques. Many of these aberrations affected potential driver genes and are reported here for the first time.
![Genomic copy-number changes in MF. (A) Heatmap showing copy-number changes for the 49 MF samples separated by type of lesion (ESP, LSP, tumor [TMR]). Red bars indicate amplifications; blue bars indicate deletions. Numbers of amplifications and deletions are presented on a log2 scale. Bar charts at the top show the difference in numbers of amplifications (+1 per sample) or deletions (−1 per sample) at each chromosome across lesion types. (B) Difference in numbers of amplifications or deletions for putative driver genes in each subgroup of MF samples.](https://ash.silverchair-cdn.com/ash/content_public/journal/bloodadvances/4/11/10.1182_bloodadvances.2020001441/1/m_advancesadv2020001441f3.png?Expires=1769100352&Signature=38Hf~zqbQVBEI5t-Vp~n9meyMSBT6dgygxxNjfV~pxrd9YcCBgUqAykLXA4pyzV919Em-E2QROa8MrLE77iyJWbI7ppUmmwO09dgypcXr6iJfloI-opO1lsXwAoMPRaFzMLw5OS3rma5wCzfF~53wk4nTXdzyTRtlYtchy9x1zhN1ykzi3sDNAv0moe0RJcSdY39sFvPQtKtqsSAl2ehuKS22lhcjn2r-g7Sry3BsbezjX37FSUOsw6b5bC65FknCKtCLFFmWGQuki4FrZgHEub7iVVgSlqUNBIYm8OZN4H-nPDLQnJKHkSxXpODnjqm6jbb0ZXRNdEOrnJmTnva7Q__&Key-Pair-Id=APKAIE5G5CRDK6RD3PGA)
Genomic copy-number changes in MF. (A) Heatmap showing copy-number changes for the 49 MF samples separated by type of lesion (ESP, LSP, tumor [TMR]). Red bars indicate amplifications; blue bars indicate deletions. Numbers of amplifications and deletions are presented on a log2 scale. Bar charts at the top show the difference in numbers of amplifications (+1 per sample) or deletions (−1 per sample) at each chromosome across lesion types. (B) Difference in numbers of amplifications or deletions for putative driver genes in each subgroup of MF samples.
Genomic copy-number changes in MF. (A) Heatmap showing copy-number changes for the 49 MF samples separated by type of lesion (ESP, LSP, tumor [TMR]). Red bars indicate amplifications; blue bars indicate deletions. Numbers of amplifications and deletions are presented on a log2 scale. Bar charts at the top show the difference in numbers of amplifications (+1 per sample) or deletions (−1 per sample) at each chromosome across lesion types. (B) Difference in numbers of amplifications or deletions for putative driver genes in each subgroup of MF samples.
MF is rich in mutations, with respect to both SNVs and CNAs. We therefore investigated whether those mutations are clonal or rather a manifestation of the subclonal architecture of MF.
Intratumor heterogeneity in MF
Genetic aberrations (SVs and CNAs) in solid tumors often have clonal (present in all cells) or subclonal distribution. The subclones may be present in the common stem (trunk) of the phylogenetic tree or may occur as a result of branched evolution. In the latter situation, the subclonal mutations present in only a subset of cancer cells, often referred to as the clades, or branches, of the tree (Figure 1).27,28
To investigate whether MF is characterized by a subclonal structure, we used a bioinformatic approach where the combined information from SVs and CNAs for each of our samples was used to reconstruct a phylogenetic tree. None of the 49 MF samples analyzed here were clonal. We found a median of 6 subclones, with a maximum of 9 clones (Figure 4A; supplemental Figure 3). Tumor samples tended to have more subclones than ESPs or LSPs, and the phylogenetic trees of tumors were also more branched than those of plaques. Highly branched trees (>1 branching node) were found in 12 of 19 tumors (95% confidence interval, 40.9%-81.8%) and 14 (52%) of 27 plaques (95% confidence interval, 33.6%-69.8%). Only in a minority of cases did phylogenetic tracing show a linear pattern of subclones (1 case of ESP and 2 cases of LSP and tumor; Figure 4B; supplemental Figure 3).
![Intratumoral heterogeneity in MF. Combined data from SVs and CNAs for each sample underwent phylogenetic analysis to identify genetic subclones, as in Figure 1. (A) Rainbow graph representing the number and frequency of the subclones identified in each sample. Samples are arranged by an increasing number of subclones. Top bar graph shows TCF for each sample; color of the bar indicates type of lesion (ESP, LSP, tumor [TMR]). (B) Examples of 3 major categories of phylogenetic trees: nonbranched linear sequence of subclones (upper), simple branched structure with 1 generation of subclones (middle), and complex structure with several generations of subclones (lower). All phylogenetic trees are shown in supplemental Figure 3. (C) Bubble plot showing correlation between the number of neoplastic clonotypes and number of subclones in the samples. Size of the bubble is proportional to the frequency of the first-ranked (most abundant) clonotype. Dashed line highlights the samples where the first-ranked clonotype had a relative frequency of ≥60%.](https://ash.silverchair-cdn.com/ash/content_public/journal/bloodadvances/4/11/10.1182_bloodadvances.2020001441/1/m_advancesadv2020001441f4.png?Expires=1769100352&Signature=dF7NfL~Out021Swp0~914R3aOwITuA2Nmsf8neyZZPkydxGQy4qsiBd7NoB6SX0DykSxOAWrVy8WfEk66t8Ne9KbwZxmVr1Z~mDSENZ-NVxFoR3P4~tV7Obh6xa61UT9CmdFe2~DzvzgbVDxZpeDFyqkRuAt6KBVjpb2yUKuBCoTHnVB05wMKtOgb~MJBbrvFx5prE5tN8cOdndmDm6YOFSksESszcbOM3Aw0xphK0PsI0KGTDxUMPLFPfkABMkMVkw~Zzeii~NY4Qg-d2~X~HY0b~DNbETAMUANZnb6R-qBvW7vP7zBvCF4smAfIGhbps0oqBPiU0JirMEd41V~xA__&Key-Pair-Id=APKAIE5G5CRDK6RD3PGA)
Intratumoral heterogeneity in MF. Combined data from SVs and CNAs for each sample underwent phylogenetic analysis to identify genetic subclones, as in Figure 1. (A) Rainbow graph representing the number and frequency of the subclones identified in each sample. Samples are arranged by an increasing number of subclones. Top bar graph shows TCF for each sample; color of the bar indicates type of lesion (ESP, LSP, tumor [TMR]). (B) Examples of 3 major categories of phylogenetic trees: nonbranched linear sequence of subclones (upper), simple branched structure with 1 generation of subclones (middle), and complex structure with several generations of subclones (lower). All phylogenetic trees are shown in supplemental Figure 3. (C) Bubble plot showing correlation between the number of neoplastic clonotypes and number of subclones in the samples. Size of the bubble is proportional to the frequency of the first-ranked (most abundant) clonotype. Dashed line highlights the samples where the first-ranked clonotype had a relative frequency of ≥60%.
Intratumoral heterogeneity in MF. Combined data from SVs and CNAs for each sample underwent phylogenetic analysis to identify genetic subclones, as in Figure 1. (A) Rainbow graph representing the number and frequency of the subclones identified in each sample. Samples are arranged by an increasing number of subclones. Top bar graph shows TCF for each sample; color of the bar indicates type of lesion (ESP, LSP, tumor [TMR]). (B) Examples of 3 major categories of phylogenetic trees: nonbranched linear sequence of subclones (upper), simple branched structure with 1 generation of subclones (middle), and complex structure with several generations of subclones (lower). All phylogenetic trees are shown in supplemental Figure 3. (C) Bubble plot showing correlation between the number of neoplastic clonotypes and number of subclones in the samples. Size of the bubble is proportional to the frequency of the first-ranked (most abundant) clonotype. Dashed line highlights the samples where the first-ranked clonotype had a relative frequency of ≥60%.
The phylogenetic trees reconstructed from the mutation distribution analysis do not necessarily reflect the presence of actual cellular clones, defined as a group of identical cells that share a common ancestry. However, being derived from mature T cells, MF provides an additional opportunity to analyze clonal composition by counting the clonotypes, the unique CDR3 sequences of rearranged TCRB genes.29 Because the TCRB locus is rearranged on only 1 allele and not re-rearranged in mature T cells, it is possible to calculate the richness and diversity of the repertoire of T cells. To avoid confusion between different definitions of clones, we refer to TCR heterogeneity as clonotypic.
There was a weak but significant correlation between intratumoral heterogeneity (ITH) and clonotypic richness (Figure 4C) and between the respective Simpson diversity indices (supplemental Figure 4). This suggests that MF is characterized by a divergent evolution, in which the individual T-cell clones accumulate mutations independently of one another. However, we also noticed that the samples in which the most abundant TCRβ clonotype outnumbered the remaining clonotypes (relative frequency, ≥60%) also had multiple mutational subclones (>5; Figure 4C). This represented expansion of some neoplastic clones and further branching into multiple mutational subclones (examples of such highly branched phylogenetic trees are MF5_1, MF32_1, MF19_1, and MF4_6, which presented with 8-9 subclones; supplemental Figure 3). Of note, we did not see any evidence indicating the influence of previous therapy on subclonal composition (supplemental Table 1 provides clinical data).
To further examine whether ITH is present in other types of CTCL, we reanalyzed the sequencing data from 56 SS, 13 MF, and 8 CTCL not specified samples, available through data sharing platforms (supplemental Table 2). Seven SS samples did not present any ITH, whereas the remaining cases demonstrated different degrees of ITH, ranging from 2 to 9 subclones (median, 4 subclones; supplemental Figure 5A). All MF samples showed ITH similar to that found in our material.
Subclonal distribution of mutations in MF
We compared the mutational burden in the stem and clades of phylogenetic trees. The distribution of mutational burden changed with disease progression. In most ESPs (11 [73%] of 15), a majority (>50%) of the mutations were concentrated in the stem (Figure 5A). The situation was reversed in advanced stages. In 73% of LSPs and 68% of TMRs, >50% of the mutations were in the clades rather than stem. Gradual enrichment in the mutations in the clades has been found to be characteristic of divergent evolution,30 which underscores our conclusion that this is the dominant evolutionary pattern of MF. In only 5 of 49 samples, all mutations were concentrated in the stem, and these were also the samples with the lowest number of subclones (2-3 subclones; Figure 5A). A slightly higher number of cases with clonal (stem) mutations were found in SS (23%; supplemental Figure 5B), but direct comparison with our data may have been affected by different TCF values (supplemental Figure 1A).

Distribution of mutations in the stem and clades in MF. (A) Percentage of all SNV mutations in the stem (blue) and clades (red) of the phylogenetic tree. (B) Mutational landscape of the putative driver genes in the stem and clades of the phylogenetic tree. Black square indicates a function-changing mutation (missense, frameshift, insertion, deletion, stop gain or loss, or variant in 3′ or 5′ untranslated region). Mutations of the same gene found both in the stem and clades signify different positions of the mutation. TMR, tumor.
Distribution of mutations in the stem and clades in MF. (A) Percentage of all SNV mutations in the stem (blue) and clades (red) of the phylogenetic tree. (B) Mutational landscape of the putative driver genes in the stem and clades of the phylogenetic tree. Black square indicates a function-changing mutation (missense, frameshift, insertion, deletion, stop gain or loss, or variant in 3′ or 5′ untranslated region). Mutations of the same gene found both in the stem and clades signify different positions of the mutation. TMR, tumor.
We also analyzed the distribution of mutations in the putative driver genes in the stem and clades. Generally, the pattern of driver mutations followed the pattern seen for all SNVs, with an increasing proportion of mutations in the clades during stage progression (Figure 5B). Driver genes such as CDK12, POT1, LAST1, STAT5B, NFKB2, and CD28, representing the pathways of T-cell activation, DNA damage, growth, and proliferation, were mutated equally between the stem and clades. However, mutations in some other drivers showed a nonrandom distribution between the stem and clades. PIK3CB and ERBB3 were found only in the stem, whereas KMT2C, RFXAP, and TNFAIP3 (essential for chromatin modification and immune surveillance) were found only in the clades, which may have functional importance for the pathogenesis of MF.
Topologic subclonal heterogeneity in MF
We have previously shown that lesions of MF in the same patient have different clonotypic compositions, a phenomenon we call topologic heterogeneity.7 To investigate whether the topologic (interlesional) heterogeneity is also detectable in relation to tumor subclones, we determined the phylogenetic relationships between the subclones in different skin lesions of a single patient. We collected pairs of tumor and plaque biopsies from 6 MF patients and used combined data of single somatic mutations and CNAs from both lesions to map the phylogenetic trees (Figure 6). Two patients (MF5, MF40) had no common ancestral clone shared between the lesions, and 3 other patients (MF4, MF7, MF38) had only a single clone shared between the LSP and tumor samples. Each of the lesions presented an independent phylogenetic branch with multiple subclones (Figure 6). We interpret these findings as additional evidence of the divergent evolution of MF, with each lesion evolving in relative isolation from other lesions.
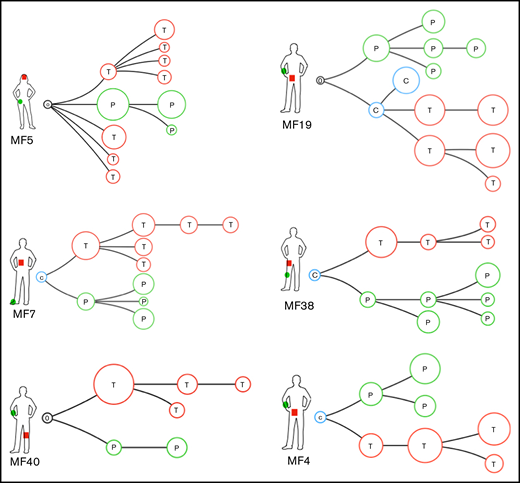
Phylogenetic relationship between different lesions in the same patient: topologic heterogeneity in MF. Pairs of LSP and tumor (TMR) biopsies were collected from 6 patients and analyzed as in Figure 4. Red branches represent TMR (T), green branches symbolize evolution of the LSP (P). Blue circles represent common clones shared by TMRs and LSPs (C). Black circle represents a phylogenetic tree without an identifiable ancestor clone.
Phylogenetic relationship between different lesions in the same patient: topologic heterogeneity in MF. Pairs of LSP and tumor (TMR) biopsies were collected from 6 patients and analyzed as in Figure 4. Red branches represent TMR (T), green branches symbolize evolution of the LSP (P). Blue circles represent common clones shared by TMRs and LSPs (C). Black circle represents a phylogenetic tree without an identifiable ancestor clone.
Discussion
ITH refers to the recently described phenomenon of the distribution of somatic mutations in subsets of malignant cells (subclones) rather than being found in all malignant cells (clonal mutations). ITH has been documented in solid tumors27,31 and in non-Hodgkin lymphomas32-34 and is considered a genomic manifestation of tumor evolution. ITH arises as a result of differences in the proliferation and survival of cells bearing different mutations and enhances evolution by providing material for natural selection, where the fittest subclones determine prognosis and resistance to therapy.35
Here we demonstrate that MF is a highly heterogeneous neoplasm composed of multiple subclones. We found evidence of branched evolution in a majority (92%) of the MF cases analyzed. In addition, a subclonal structure was found in SS, which indicates that ITH is a general feature of CTCL.
Although extensive ITH has been found even in the early stages of MF (T1 in stage IA), disease progression was associated with further accumulation of mutations (SVs and CNAs) and increased ITH. Therefore, in contrast to the widely held presumption that progression of MF is caused by selection and expansion of a single aggressive clone,36 our data indicate that it is caused by evolutionary branching, leading to enrichment in neoplastic subclones. Although we did not investigate the mechanisms responsible for subclonal enrichment, we hypothesize that mutual competition among the subclones (eg, competition for space and nutrients) may play a role. These types of “rock-paper-scissors” interactions among populations have been studied in evolutionary biology and are well documented as increasing genetic diversity in the ecosystem37 and driving divergent evolution. The divergent evolution model is compatible with the finding of an increased number of clade vs stem mutations30 and explains our previous finding of the comparability between the number of malignant T-cell clonotypes in early- and late-stage disease. Malignant T cells expand and branch into subclones that cohabit the skin niche without evidence of clonal elimination.
It has been shown in several types of cancer that ITH is negatively correlated with sensitivity to chemotherapy or immunotherapy because multiple, genetically diverse malignant subclones provide material for selection of resistant cells.35,38 We explored this question further by analyzing the clonality of putative driver mutations in MF. We added 28 new potential driver mutations to the list of known mutated driver genes in CTCL, now including important targetable genes such as JAK1, JAK3, BRAF, ALK, MTOR, and PTCH1. Unfortunately, we did not find any consistent pattern in the clonal driver mutations, which were heterogeneous and varied vastly from patient to patient. However, we found that certain pathways, particularly chromatin modification and transcription factors, were frequently mutated in the phylogenetic stem in at least 1 constituent gene in most samples. Based on this observation, pathway targeting could be a more promising therapeutic strategy in MF as compared with targeting specific mutations. Efficacy of drugs that affect chromatin modification mechanisms, such as histone deacetylase blockers, has already been shown in MF.39,40
Most potential driver mutations in advanced disease are confined to the subclones (clades), which is likely to limit the efficacy of targeted treatment. However, it is worthwhile to mention here that even subclonal mutations may present with drug targeting opportunities, if the given subclone is important for the progression of the entire tumor.41-43 Disruption of the putative “rock-paper-scissors” interaction circuits between the clones might be an interesting therapeutic approach and could potentially be achieved by the targeting of Wnt and Hedgehog,41 the pathway which we show here to be frequently mutated in MF (genes MACF1, PTCH1, RNF43).
Perhaps a better understanding of ITH and the impact of therapy on the subclonal evolution of MF could be gained using multiomic single-cell sequencing of the samples collected before and after treatment. The subclones detected by bioinformatic reconstruction of phylogenetic trees do not necessarily identify true cellular clones, defined as a group of mutationally identical cells derived from a common ancestor. We recently discovered, along with other groups, that CTCL is heterogeneous at transcriptomic and protein levels.44-47 A single-cell approach would allow for precise mapping of malignant T-cell clones identified by a unique pair of rearranged TCRA and TCRB sequences to the mutational pattern and gene expression profiles. However, our results identified 1 potential problem in studies on ITH in multifocal tumors such as MF. In comparing ITH between samples taken from different lesions, we found only a very weak phylogenetic relationship between the subclones. In 2 of 6 cases, the distant lesions did not share any parental clone. This could be a result of the germ line normalization technique, because peripheral blood mononuclear cells isolated from patients’ blood were used as controls to identify germ line variants. Recent studies from our group and those of others provide evidence of malignant T cells in the circulating blood of CTCL patients.7,48,49 By using blood as germ line normalization, we may have misclassified certain genetic aberrations as germ line normal, thus leading to loss of certain genetic clones. Furthermore, lack of relatedness between discrete lesions could be a result of sampling and missing the lesion that provides a phylogenetic link. This may indicate that ITH of the totality of MF exceeds significantly the ITH found in single biopsies. A similar conclusion was reached regarding ITH of lung cancer by mutational analysis of multiple biopsies.31 Driver mutations that were clonal in some biopsies were found to be subclonal in other areas of the tumor. We recognize lack of data from repeated biopsies of multiple skin lesions as a limitation of this study.
Another limitation of our study is the lack of longitudinal follow-up on ITH. We noted that some phylogenetic trees did not have an identifiable common clone. It is likely that such ancestor clones may become extinct during the progression of the tumor and are no longer detectable, a phenomenon which was described during the evolution of another highly heterogeneous tumor, glioblastoma.43
Finally, we propose a model for the pathogenesis of MF that accounts for the previously found clonotypic heterogeneity7,29,50 and the ITH described here (Figure 7). ITH is readily detectable in ESPs, which reflects the history of mutational tumor evolution before seeding of neoplastic cells in the skin. As the disease progresses, the seeded T-cell clones undergo additional mutations and branch into subsequent generations of subclones. Analysis of the branching structure could also confirm our hypothesis that malignant clones from 1 lesion can reenter the circulation and seed another lesion. Exchange of malignant T-cell clones among lesions could explain why there is more resemblance between LSPs and tumors than between LSPs and ESPs. More direct evidence of cancer self-seeding was found in patient MF19 (Figure 6), where a subclone shared between the plaque and tumor was interjected among the branches of the phylogenetic tree.

Proposed model of the evolution of MF. Skin lesions of MF are formed by seeding with the circulating malignant T-cell clones, which undergo further mutational evolution. (A) It is likely malignant clones originate from an immature T cell transformed before TCRB rearrangement and therefore show clonotypic heterogeneity (highlighted by different colors of the cytoplasm). (B) These circulating neoplastic T cells undergo expansion and accumulate mutations, leading to emergence of genetically different malignant subclones (different colors of the nucleus). Some of the circulating malignant cells seed into the skin (stippled gray arrows) (C), where they proliferate, accumulate additional mutations, and develop additional subclones as the disease progresses (D). (E) Some subclones may reenter the circulation and seed other skin lesions (red stippled arrow), further increasing the heterogeneity of the lesions and causing disease progression. Solid lines symbolize the phylogenetic relationship between generations of malignant cells that follow the pattern of divergent, neutral evolution. Data from this study and our previous work.7,29,50,51
Proposed model of the evolution of MF. Skin lesions of MF are formed by seeding with the circulating malignant T-cell clones, which undergo further mutational evolution. (A) It is likely malignant clones originate from an immature T cell transformed before TCRB rearrangement and therefore show clonotypic heterogeneity (highlighted by different colors of the cytoplasm). (B) These circulating neoplastic T cells undergo expansion and accumulate mutations, leading to emergence of genetically different malignant subclones (different colors of the nucleus). Some of the circulating malignant cells seed into the skin (stippled gray arrows) (C), where they proliferate, accumulate additional mutations, and develop additional subclones as the disease progresses (D). (E) Some subclones may reenter the circulation and seed other skin lesions (red stippled arrow), further increasing the heterogeneity of the lesions and causing disease progression. Solid lines symbolize the phylogenetic relationship between generations of malignant cells that follow the pattern of divergent, neutral evolution. Data from this study and our previous work.7,29,50,51
The raw sequencing fastq files have been submitted to dbGAP with accession number phs001877.v1.p1.
Acknowledgments
The authors thank Thomas Salopek, Rachel Doucet, and the nursing staff of Edmonton Kaye Clinic for their help in sample collection. Hanne Fogh provided excellent care to the patients from the Copenhagen center and helped to collect clinical data. Vibeke Pless and Pia Eriksen helped with the collection and shipment of samples.
This study was supported by grants from the Canadian Dermatology Foundation (RES0035718), University Hospital Foundation (University of Alberta), Bispebjerg Hospital (Copenhagen, Denmark), and Danish Cancer Society (Kræftens Bekæmpelse; R124-A7592 Rp12350) and an unrestricted research grant from the Department of Medicine, University of Alberta (R.G.).
Authorship
Contribution: A.I. designed the experiments, analyzed the data, wrote the manuscript, and submitted the data to the Database of Genotypes and Phenotypes; A.I. and S.O. performed the experiments; D.H. and J.P. performed the bioinformatic analysis; W.W. and G.K.-S.W. provided input on the technical aspects of the experiments and bioinformatic pipelines and edited the manuscript; R.G. designed and supervised the experiments, performed data analysis, and edited the manuscript; and all authors approved the final version of this paper.
Conflict-of-interest disclosure: The authors declare no competing financial interests.
Correspondence: Robert Gniadecki, University of Alberta, 8-112 Clinical Science Building, 11350-83 Ave, Edmonton, AB T6G 2G3, Canada; e-mail: r.gniadecki@ualberta.ca; and Aishwarya Iyer, University of Alberta, 8-112T Clinical Science Building, 11350-83 Ave, Edmonton, AB T6G 2G3, Canada; e-mail: aiyer2@ualberta.ca.

