Abstract
The impact of tumor necrosis factor (TNF)-related apoptosis-inducing ligand (TRAIL) on normal hematopoietic development was investigated using adult peripheral blood CD34+ hematopoietic progenitor cells, induced to differentiate along the erythroid, megakaryocytic, granulocytic, and monocytic lineages by the addition of specific cytokine cocktails. TRAIL selectively reduced the number of erythroblasts, showing intermediate levels of glycophorin A (glycophorin Ainterm) surface expression, which appeared in liquid cultures supplemented with stem cell factor + interleukin 3 + erythropoietin at days 7-10. However, neither immature (day 4) glycophorin Adim erythroid cells nor mature (day 14) glycophorin Abright erythroblasts were sensitive to TRAIL-mediated apoptosis. Moreover, pre-exposure to TRAIL significantly decreased the number and size of erythroid colonies in semisolid assays. These adverse effects of TRAIL were selective for erythropoiesis, as TRAIL did not significantly influence the survival of cells differentiating along the megakaryocytic, granulocytic, or monocytic lineages. Furthermore, TRAIL was detected by Western blot analysis in lysates obtained from normal bone marrow mononuclear cells. These findings indicate that TRAIL acts in a lineage- and stage of differentiation-specific manner, as a negative regulator of normal erythropoiesis.
The maintenance of organ and tissue homeostasis and regulation of their size are controlled by finely tuned signals of proliferation and programmed cell death, an active form of death also known as apoptosis.1 In particular, adult hematopoiesis is maintained by a balanced production of cytokines, which mainly act to stimulate or to prevent survival and proliferation of hematopoietic progenitor and precursor cells.2
Several hematopoietic growth factors, such as interleukin (IL)-3, have been shown to deliver survival/proliferation signals to hematopoietic cells. However, it is becoming increasingly clear that hematopoietic progenitor cells die not only as a consequence of growth factor withdrawal but also in response to apoptosis inducers, such as transforming growth factor β1, tumor necrosis factor (TNF)-α, interferon (IFN)-γ, and Fas (CD95) ligand (FasL/CD95L) (reviewed in Park2). These negative regulators of hematopoiesis are likely involved in both the physiological control of hematopoiesis as well as the induction of pathological conditions. In this respect, it has been shown that TNF-α- and IFN-γ-treated hematopoietic progenitors, when exposed to an agonist CD95 monoclonal antibody (mAb), display a poor colony formation in semisolid cultures and undergo apoptosis.3,4 Moreover, mouse embryos, bearing a defective expression of FADD, a death adaptor molecule downstream to various death receptors, including CD95 and TNF-R1, die within 12 days of gestation because of erythroid accumulation and impaired heart muscle development (reviewed in Ashkenazi and Dixit5). Altogether, these findings suggest that the CD95/CD95L system is involved in the negative regulation of hematopoiesis and, in particular, of normal erythroid development (reviewed in Niho and Asano6). Moreover, an up-regulation of the CD95/CD95L system has been proposed to play a prominent role also in the pathogenesis of aplastic anemia.7-10
TNF-related apoptosis-inducing ligand (TRAIL) is a recently described member of the TNF-related proteins, which shows structural and functional similarities with CD95L,11-18 including the use of FADD as adaptor molecule.19 The unique feature of TRAIL with respect to CD95L and TNF-α is considered its ability to induce apoptosis of various cell lines and of primary tumor cells, including several of hematopoietic origin12 without displaying toxic effects on normal cells and tissues. So far, the only primary cells susceptible to TRAIL cytotoxic activity are cultured astrocytes.20 Thus, a role for this cytokine in physiological conditions has not been envisioned yet.
The aim of this study was to investigate whether TRAIL might play a role in the homeostatic control of hematopoiesis. For this purpose, TRAIL was tested on freshly isolated adult peripheral blood (PB) CD34+ hematopoietic progenitors, as well as on erythroid (glycophorin A+), megakaryocytic (CD61+), granulocytic (CD15+), and monocytic (CD14+) precursor cells generated in vitro in liquid suspension and semisolid cultures. Moreover, the expression of TRAIL was investigated on lysates obtained from human bone marrow (BM) mononuclear cells.
Materials and methods
Reagents
Both rHis6-tagged TRAIL and rHis6-tag control peptides were produced in bacteria and purified by affinity chromatography on Ni2+ affinity resin, as previously described.21 The functional activity of each TRAIL preparation used in this study was tested on the TRAIL-sensitive Jurkat cell line (J32 clone), as previously described.22 In preliminary dose- and time-course experiments performed in Jurkat cells, increasing apoptosis was evident by about 4-6 hours, it was complete by 20 hours, and reached a plateau at the concentrations of 0.1-1 μg/mL. In contrast, equimolar concentrations of rHis6-tag alone did not show any significant toxicity on Jurkat cells. Therefore, a 20-hour incubation time and the concentration of 1 μg/mL of TRAIL were chosen to perform the experiments in primary hematopoietic cells.
Agonist anti-CD95 immunoglobulin (Ig)M mAb (CH11, UBI, Lake Placid, NY) or isotype-matched control IgM was used at the concentration of 0.2 μg/mL.
Purification of the cells
Bone marrow aspirates were taken from the posterior iliac crest of 3 normal donors, whereas leukapheresis units were obtained from PB of 21 normal donors. All individuals gave their informed consent to the study according to the Helsinki declaration of 1975. Mononuclear cells from either BM or PB samples were isolated by density gradient (Ficoll/Histopaque-1077, Sigma Chemical Co, St Louis, MO). Whereas BM mononuclear cells were immediately lysed for Western blot analysis, PB mononuclear cells were let to adhere to plastic for 1 hour at 37°C. After removal of adherent cells, PB CD34+ cells were isolated with the use of a magnetic cell sorting program Mini-MACS and the CD34 isolation kit (Miltenyi Biotech, Auburn, CA) in accordance with the manufacturer's instructions and as previously described.23 The purity of CD34-selected cells was determined for each isolation by FACStar Plus (Lysis II program, Becton Dickinson, San Jose, CA), using a mAb that recognizes a separate epitope of the CD34 molecule (HPCA-2, Becton Dickinson) directly conjugated to fluorescein isothiocyanate (FITC). CD34+cells ranged about 85%-98%.
Unilineage liquid cultures of hematopoietic progenitor cells and phenotypic evaluation
In most experiments, purified CD34+ cells were cultured in Ex-vivo (Biowittaker, Walkersville, MA) serum-free medium, supplemented with nucleosides (10 μg/mL each), 0.5% bovine serum albumin (BSA, Chon fraction V), 10-4 mol/L BSA-adsorbed cholesterol, 10 μg/mL insulin, 200 μg/mL iron-saturated transferrin, 5 × 10⁻⁵mol/L 2-β-mercaptoethanol (all purchased from Sigma). Cells were adjusted to an optimal cell density of 5 × 10⁴/mL and seeded in culture in the presence of stem cell factor (SCF; 50 ng/mL) + IL-3 (10 ng/mL) + erythropoietin (EPO; 4 U/mL) to induce erythroid differentiation; IL-3 (10 ng/mL) + thrombopoietin (TPO; 100 ng/mL) to induce megakaryocytic differentiation; SCF (50 ng/mL) + IL-3 (10 ng/mL) + granulocyte-colony stimulating factor (G-CSF; 10 ng/mL) to induce granulocytic differentiation; SCF (50 ng/mL) + IL-3 (10 ng/mL) + macrophage-CSF (M-CSF; 10 ng/mL) + 10% fetal calf serum (Gibco, Grand Island, NY) to induce monocytic differentiation. All cytokines were purchased from Genzyme (Cambridge, MA). Every 3-4 days, cultures were demi-populated by removing half volume of the medium, which was substituted with fresh medium supplemented or not with lineage-specific cytokines (EPO, TPO, G-CSF, or M-CSF). At these time points, the cells removed were counted, stained, and analyzed by flow cytometry, whereas the cell density was readjusted to 1 × 10⁵/mL. TRAIL (1 μg/mL), anti-CD95 CH11 mAb (0.2 μg/mL), or isotype-matched mAb (0.2 μg/mL) + rHis6-tag (0.15 μg/mL) were added either immediately after purification of CD34+ cells (day 0) or at various culture times as specified in the text.
The surface phenotype of CD34-derived cells was analyzed by FACStar Plus. Staining was performed at 4°C for 30 minutes on 2 × 10⁵ cells in 200 μL of phosphate-buffered saline (PBS) containing 1% BSA, 5% human plasma, 0.1% sodium azide, and the following mAbs: FITC- or phycoerythrin (PE)-conjugated anti-CD34, PE-anti-CD71, PE-anti-CD33 (Becton Dickinson); FITC- or PE-anti-CD14, FITC-anti-CD15, FITC- or PE-anti-CD61 (Cymbus, LTD, Tema ricerca srl, Bologna, Italy); PE-anti-glycophorin A and PE-anti-Fas (CD95) mAb (Pharmingen, San Diego, CA); FITC-anti-CD42b (Southern Biotechnology Associates Inc, Birmingham, AL); FITC-anti-glycophorin A (DAKO, Copenhagen, Denmark); PE-anti-CD41 (Coulter-Immunotech, Marseille Cedex, France); PE-anti-CD11b (BIO-RAD SPD, Segrate, Italy); and FITC-anti-CD16 (Caltag, San Francisco, CA).
In some experiments, erythroid cells obtained in liquid culture were spun on coverslips, fixed in 4% paraformaldehyde in PBS for 10 minutes at room temperature, washed twice with PBS, stained with May-Grunwald-Giemsa, and observed at light microscopy with an Axyophot Zeiss microscope.
Measurement of apoptosis
Cell death was evaluated by FACStar Plus, using 3 distinct procedures: (1) FITC-conjugated annexin V staining (Bender, Wien, Austria) that detects phosphatidyl-serine exposed on the outer cell membrane following caspase activation, (2) propidium iodide (PI; Calbiochem, CA) that goes into membrane-damaged dead cells, (3) forward-side-scatter analysis that detects a strong decrease of the forward scatter signal (FSC) in the presence of a still stable side scatter signal (SSC) due to profound morphological changes (shrinkage) of apoptotic cells.24 The staining methods were chosen in each experiment depending on the fluorochrome conjugated to the mAb used for the surface antigen detection. When performed in parallel experiments, all 3 methods gave basically overlapping results.
In vitro colony forming assays
Erythroid (BFU-E), megakaryocytic (CFU-meg), and granulocytic/macrophagic (CFU-GM) colonies were assayed in plasmaclot cultures, as previously described.25 Briefly, 5 × 10³ CD34+ cells were cultured in 1 mL of IMDM (Gibco), containing 10% detoxified BSA, 10% heat-inactivated pooled human AB sera, 10% citrated bovine plasma (Gibco), 20 mg of l-asparagine (Sigma), 3.4 mg/mL CaCl2. The standard sources of growth factors were the same as used in liquid cultures: SCF (50 ng/mL) + IL-3 (10 ng/mL) + EPO (4 U/mL) for the growth of BFU-E; IL-3 (10 ng/mL) + TPO (100 ng/mL) for the growth of CFU-meg; SCF (50 ng/mL) + IL-3 (10 ng/mL) + G-CSF (10 ng/mL) for the growth of CFU-GM. All semisolid cultures were supplemented with TRAIL (1 μg/mL), CH11 anti-CD95 mAb (0.2 μg/mL), or isotype-matched mAb (0.2 μg/mL) + rHis6-tag (0.15 μg/mL). In selected experiments, CD34+ cells were pre-incubated for 2 days with the cytokine combinations illustrated above in liquid cultures and then treated for an additional 20 hours with TRAIL, CH11 anti-CD95 mAb, or IgM irrelevant mAb + rHis6-tag irrelevant peptide before being seeded in semisolid assays. At day 14, for BFU-E and CFU-GM identification, the clots were fixed in situ with methanol-acetone 1:3 for 20 minutes and stained with 3,3′ dimethoxybenzidine and hematoxylin. Colonies of > 50 red hemoglobin-containing cells were scored as BFU-E, whereas colonies of > 50 nonhemoglobinized cells were scored as CFU-GM. CFU-meg was identified after immunofluorescence staining with anti-CD41 mAb directly conjugated to FITC (Pharmingen), as aggregates of 3 or more fluorescent cells.
Western blotting
For the analysis of TRAIL protein expression, Western blot was performed on approximately 4 × 10⁶ BM mononuclear cells. Cells were harvested in lysis buffer containing 1% Triton X-100, sonicated, and processed by Western blot. Protein determination was performed by Bradford assay (Bio-Rad, Richmond, CA). Human Jurkat cell line and murine Friend cell line were used as positive and negative controls of TRAIL expression, respectively (not shown). For each sample, 100 μg of proteins was migrated in 12% acrylamide gels and blotted onto nitrocellulose filters. Blotted filters were blocked for 30 minutes in a 3% suspension of dried skimmed milk in PBS and incubated overnight at 4°C with 1:100 dilution of anti-TRAIL mAb (clone B35-1 from Pharmingen). Filters were washed and further incubated for 1 hour at room temperature with 1:1000 dilution of peroxidase-conjugated anti-mouse IgG (Sigma Chemicals) in 0.1% BSA. Specific reactions were revealed with the ECL Western blotting detection reagent (Amersham Corp, Arlington Heights, IL).
Statistical analysis
Data were analyzed with the use of the 2-tailed, 2-sample ttest (Minitab statistical analysis software, State College, PA). Values of P < .05 were considered significant.
Results
Lack of TRAIL toxicity on freshly isolated CD34+ cells
In the first set of experiments, we have investigated the sensitivity of PB CD34+ hematopoietic progenitor cells to TRAIL and anti-CD95-triggering (CH11) mAb by both FSC/SSC and PI staining analyses, which gave similar results in terms of percentage of dead cells (Figure 1). Although the addition of hematopoietic growth factors (SCF + IL-3) significantly (P < .05) reduced the percentage of freshly isolated CD34+ cells undergoing apoptosis after 20 hours of culture, TRAIL was unable to significantly modify the degree of CD34+ cell death either in the absence or in the presence of SCF + IL-3 (Figure 1 and Table 1). As expected, because of the absence of surface CD95-antigen expression in CD34+ cells (not shown),3,4,7 10 anti-CD95 agonist mAb was unable to significantly alter the percentage of CD34+ cell death, irrespective of the presence of cytokines (Figure 1 and Table 1).
Evaluation of TRAIL activity on freshly isolated PB CD34+ cells.
The percentage of cell death was evaluated in CD34+ cells treated with irrelevant IgM mAb and rHis6-tag peptide (CONT), TRAIL, or anti-CD95 (CH 11) IgM mAb for 20 hours in medium supplemented with (CYTOK, right panels) or without SCF + IL-3 (left panels). CD34+ cell death was detected by either FSC/SSC (upper 2 panels) or PI staining (lower 6 panels) analyses. Percentages of dead cells are indicated in each panel. Representative FSC/SSC analyses are shown only for control (CONT) cultures, since similar profiles were observed in TRAIL- and anti-CD95-treated cells (not shown). In the lower 6 panels, quadrants were set based on negative controls stained with isotype-matched irrelevant mAb (not shown). X-axis: relative CD34 expression; Y-axis: propidium iodide staining.
Percentages of dead CD34+ cells incubated soon after purification (CD34+ cells >90%) for 20 hours with the indicated treatments
| . | Cytokines . | |
|---|---|---|
| None . | SCF + IL-3 . | |
| Control* | 28.7 ± 7.2 | 15.5 ± 4.4 |
| TRAIL† | 29.7 ± 9.3 | 16.2 ± 4.6 |
| CH11‡ | 26.7 ± 7.5 | 16.3 ± 4.5 |
| . | Cytokines . | |
|---|---|---|
| None . | SCF + IL-3 . | |
| Control* | 28.7 ± 7.2 | 15.5 ± 4.4 |
| TRAIL† | 29.7 ± 9.3 | 16.2 ± 4.6 |
| CH11‡ | 26.7 ± 7.5 | 16.3 ± 4.5 |
Data are reported as mean ± SD of 3 separate experiments.
His-tag + irrelevant IgM.
TRAIL 1 μg/mL. TRAIL indicates tumor necrosis factor (TNF)-related apoptosis-inducing ligand.
200 ng/mL of anti-CD95 triggering monoclonal antibody (CH11).
Because CD34+ cells represent an heterogeneous population of hematopoietic stem and progenitor cells,26 we next sought to test TRAIL and anti-CD95 CH11 mAb on hematopoietic progenitors committed toward the erythroid, megakaryocytic, granulocytic and monocytic lineages. For this purpose, unilineage serum-free liquid cultures were set by the addition of pluripotent hematopoietic growth factors (SCF + IL-3) plus lineage-specific cytokines (EPO, TPO, G-CSF, or M-CSF).
Selective TRAIL-mediated induction of apoptosis in erythroid cells at intermediate stages of differentiation in unilineage liquid culture
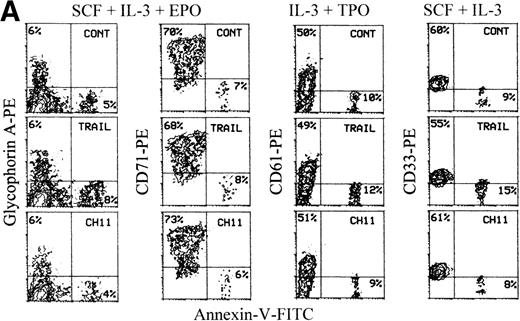
Erythroid differentiation, which strictly requires the presence of EPO, is characterized by initial expression of CD71, followed by the appearance of glycophorin A antigen.27 At day 4 of culture, most of the CD34+-derived cells cultured with SCF + IL-3 + EPO expressed CD71, whereas approximately 10% of cells showed a low expression of glycophorin A (glycophorin Adim) (Figure 2A). About half of the CD34+-derived hematopoietic progenitor cells cultured for 4 days with IL-3 + TPO expressed CD61 (gpIIIa) (Figure2A), which represents an early marker expressed during human megakaryocytic development.28 When CD34+hematopoietic progenitor cells were cultured for 4 days with SCF + IL-3, regardless of the presence of G-CSF or M-CSF, most of the cells expressed CD33 at low density (Figure 2A).
Evaluation of TRAIL effects on unilineage committed hematopoietic progenitors at early stages of differentiation (day 4 of culture).
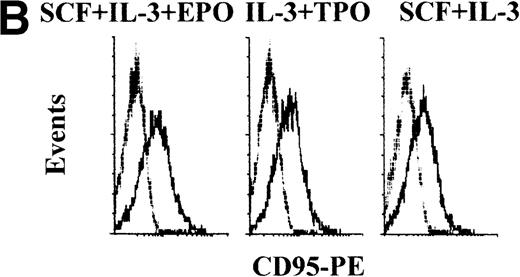
(A) The percentage of cell death was evaluated by annexin V staining in unilineage erythroid (SCF + IL-3 + EPO), megakaryocytic (IL-3 + TPO), and myeloid (SCF + IL-3) cells at day 4. Cultures were supplemented with irrelevant IgM mAb and rHis6-tag peptide (CONT), TRAIL, or anti-CD95 (CH 11) IgM mAb for 20 hours before annexin V staining. Quadrants were set based on negative controls stained with isotype-matched irrelevant mAbs. X-axis: annexin V relative expression. Y-axis: glycophorin A, CD71, CD61, CD33 relative expression. (B) shows CD95 surface expression (thick lane histograms) evaluated at day 4 of unilineage cultures. Isotype-matched negative controls are represented by the thin lane histograms. X-axis: CD95 relative expression. Y-axis: relative cell number.
In all unilineage cultures, the percentage of dead cells was somewhat higher in 20-hour TRAIL-treated samples than in control samples, but these differences were small (Figure 2A) and did not result in a significant reduction of viable cells committed toward the different lineages (Table 2). Similarly, 20-hour incubation with anti-CD95 CH11 mAb did not result in a significant increase of cell death (Figure 2A and Table 2), despite that, at this time point, most of the cells expressed detectable levels of surface CD95 molecule (Figure 2B).
Percentages of viable cells expressing lineage specific markers and dead cells (reported only for the erythroid lineage at days 7-10) on unilineage cultures at different time points after 20 hours of incubation with the indicated treatments
| Days 3-5 . | CD33+ Myeloid . | CD61+Megakaryocytic . | Glycophorin+ Erythroid Cultures . |
|---|---|---|---|
| Control* | 62 ± 12 (3)† | 38 ± 10.5 (3)† | 8.3 ± 3 (5)† |
| TRAIL‡ | 58 ± 14 | 36 ± 11 | 6.6 ± 3.6 |
| CH112-153 | 62 ± 14 | 43 ± 7.3 | 7.4 ± 2.5 |
| Days 3-5 . | CD33+ Myeloid . | CD61+Megakaryocytic . | Glycophorin+ Erythroid Cultures . |
|---|---|---|---|
| Control* | 62 ± 12 (3)† | 38 ± 10.5 (3)† | 8.3 ± 3 (5)† |
| TRAIL‡ | 58 ± 14 | 36 ± 11 | 6.6 ± 3.6 |
| CH112-153 | 62 ± 14 | 43 ± 7.3 | 7.4 ± 2.5 |
| Days 7-10 . | CD15+ Granulocytic . | CD14+ Monocytic . | CD61+Megakaryocytic . | Glycophorin+ Erythroid Cultures . | |
|---|---|---|---|---|---|
| Viable . | Dead Cells . | ||||
| Control* | 35 ± 16 (7)† | 33 ± 15 (4)† | 49 ± 18 (6)† | 42 ± 12 (13)† | 14 ± 6 |
| TRAIL‡ | 32 ± 12 | 35 ± 13 | 52 ± 16 | 21 ± 102-155 | 29 ± 4.5 |
| CH112-153 | 35 ± 9 | 32 ± 18 | 47 ± 20 | 22 ± 132-155 | 30 ± 11 |
| Days 12-14 . | CD15+ Granulocytic . | CD14+Monocytic . | CD61+ Megakaryocytic . | Glycophorin+ Erythroid Cultures . |
|---|---|---|---|---|
| Control* | 67 ± 14 (8)† | 52 ± 12 (3)† | 89 ± 5 (3)† | 70 ± 14 (6)† |
| TRAIL‡ | 70 ± 13 | 55 ± 8 | 87 ± 7 | 68 ± 13 |
| CH112-153 | 65 ± 16 | 52 ± 9 | 86 ± 8 | 61.5 ± 12 |
Data are reported as mean ± SD of 3-13 separate experiments.
His-tag + irrelevant IgM.
Number of experiments performed in parenthesis.
TRAIL 1 g/mL. TRAIL indicates tumor necrosis factor (TNF)-related apoptosis-inducing ligand.
200 ng/mL of anti-CD95 triggering monoclonal antibody (CH11).
Statistically significant difference (P < .05) between control, TRAIL-, and CH11-treated cells.
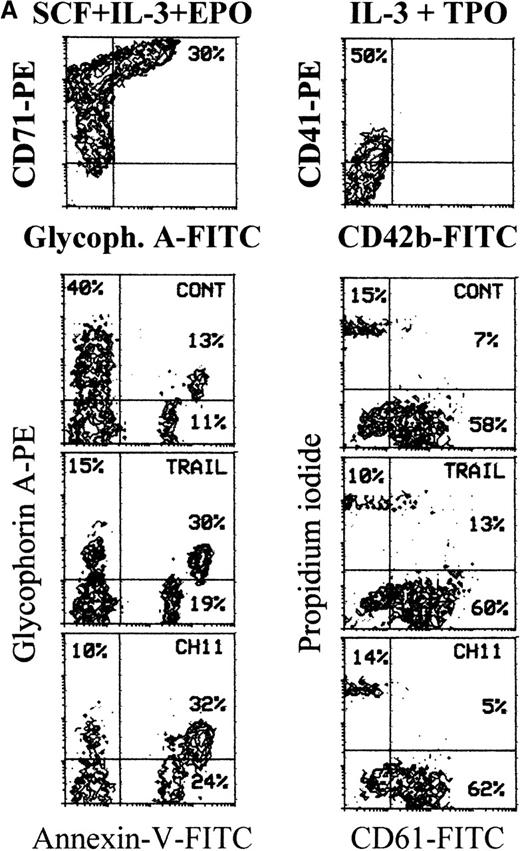
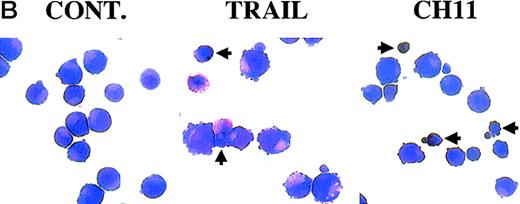
We next analyzed TRAIL- and CD95-mediated sensitivity of hematopoietic precursors at intermediate stages of development. At day 7, most of the cells generated in cultures supplemented with EPO expressed CD71 and about 30%-40% of these were CD71bright/glycophorin A+ (Figure3A). Most CD34+-derived hematopoietic cells cultured for 7 days with TPO expressed CD61 (and CD41 at low density) early markers, whereas CD42b antigen, which appears later during megakaryocyte development,28 was virtually undetectable (Figure 3A). Of note, a 20-hour incubation with TRAIL induced a statistically significant (P < .05) decrease of viable glycophorin A+ cells concomitant with a parallel increase (P < .05) of cell death at day 7 of culture (Table 2), as shown by both annexin V staining followed by flow cytometry (Figure 3A) and by morphological analysis of cultured erythroblasts (Figure 3B). In agreement with a previous report,9 we found that erythroblasts obtained at day 7 of liquid culture could be induced to die by apoptosis also by anti-CD95 CH11 mAb (Figure 3A-B, Table 2). At light microscopy examination, many cells treated with either TRAIL or anti-CD95 CH11 mAb showed several features characteristic of apoptosis, such as membrane blabbing and chromatin condensation (Figure 3B). These effects were specific for the erythroid lineage, as demonstrated by the absence at the same time point of significant reduction of the percentages of cells belonging to the megakaryocytic (CD61+) lineage (Figure 3A), which is closely related to the erythroid lineage.28
TRAIL-mediated induction of apoptosis in erythroid precursors at intermediate stages of differentiation.
Seven-day unilineage erythroid (SCF + IL-3 + EPO) (A and B) and megakaryocytic (IL-3 + TPO) (A) cultures were incubated with irrelevant IgM mAb and rHis6-tag peptide (CONT), TRAIL, or anti-CD95 (CH 11) IgM mAb for 20 hours. (A) Erythroid and megakaryocytic cells were phenotypically characterized by double staining with anti-CD71 + anti-glycophorin A or anti-CD41 + anti-CD42b, respectively (upper 2 panels). Percentages of glycophorin A+ and CD41+ cells are indicated in each panel. Apoptotic erythroid cells were detected by staining with annexin V combined to glycophorin A, whereas apoptotic megakaryocytes were detected by propidium iodide staining combined to CD61 (lower 6 panels). Percentages of cells in the respective quadrants are indicated. Quadrants were set based on negative controls stained with isotype-matched irrelevant mAbs (not shown). Panel (B) shows the morphological analysis of erythroblasts stained with May-Grunwald-Giemsa. Apoptotic cells are indicated by arrowheads. Original magnification 600×.
In the next experiments, we have investigated whether the known anti-apoptotic activity of EPO29 was able to interfere with TRAIL ability to kill erythroid cells. In this respect, it should be noticed that, in the experiments illustrated above, TRAIL was typically added in culture 3-4 days after the last addition of EPO, which occurred at the time of the first demi-population (day 4 of culture). Although EPO is consumed by cultured erythroid cells,30 we have not assayed the EPO concentrations at various culture times. Thus, to precisely characterize whether EPO showed any protective effect, erythroid cells were washed at day 8 to eliminate residual EPO and then seeded in culture in the absence or presence of fresh EPO (4 U/mL) for 12 hours before TRAIL treatment. Within the heterogeneous erythroid cell population, TRAIL specifically inhibited erythroblasts showing an intermediate glycophorin A expression (glycophorin Ainterm), appearing in culture between days 7 and 10 (Figure 4). Fresh EPO counteracted the ability of 20-hour TRAIL treatment to deplete the glycophorin Ainterm cells (Figure 4). This effect was accompanied by a significant (P < .05) reduction in the number of dead cells in TRAIL-treated samples from 33% ± 5% in the absence of EPO to 15% ± 7% in the presence of EPO (means ± SD of 3 separate experiments). The addition of fresh EPO showed a similar protective effect also against CD95-mediated cell death (data not shown).
EPO prevention of the TRAIL-mediated depletion of glycophorin Ainterm erythroblasts.
The expression of glycophorin A was evaluated on viable cells electronically gated on the basis of FSC/SSC pattern (see caption of Figure 1) at day 10 of culture with the indicated cytokines. Cultures were supplemented (bottom 2 panels) or not with fresh EPO for 12 hours and then with TRAIL or rHis6-tag peptide (CONT) for the last 20 hours of culture before glycophorin A staining. X-axis: glycophorin A relative expression. Y-axis: relative cell number. Percentages of glycophorin A+ cells are indicated.
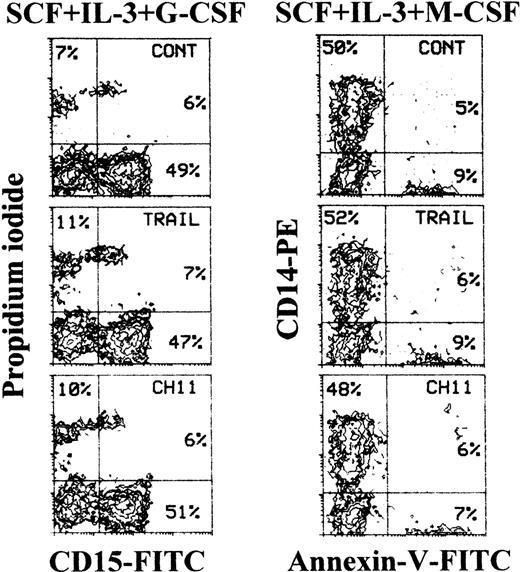
In parallel experiments, we found that 7- to 10-day granulocytic and monocytic unilineage cultures were minimally affected by both TRAIL and anti-CD95 CH11 mAb (Figure 5 and Table 2).
Lack of toxicity of TRAIL on unilineage committed myelomonocytic precursors at intermediate stages of differentiation.
Ten-day unilineage granulocytic (SCF + IL-3 + G-CSF) and monocytic (SCF + IL-3 + M-CSF) cultures were incubated with irrelevant IgM mAb and rHis6-tag peptide (CONT), TRAIL, or anti-CD95 (CH 11) IgM mAb for 20 hours. Apoptotic granulocytic cells were detected by staining with propidium iodide combined to CD15, whereas apoptotic monocytic cells were detected by annexin V staining combined to CD14. Percentages of cells in the respective quadrants are indicated. Quadrants were set based on negative controls treated with isotype-matched irrelevant mAbs (not shown).
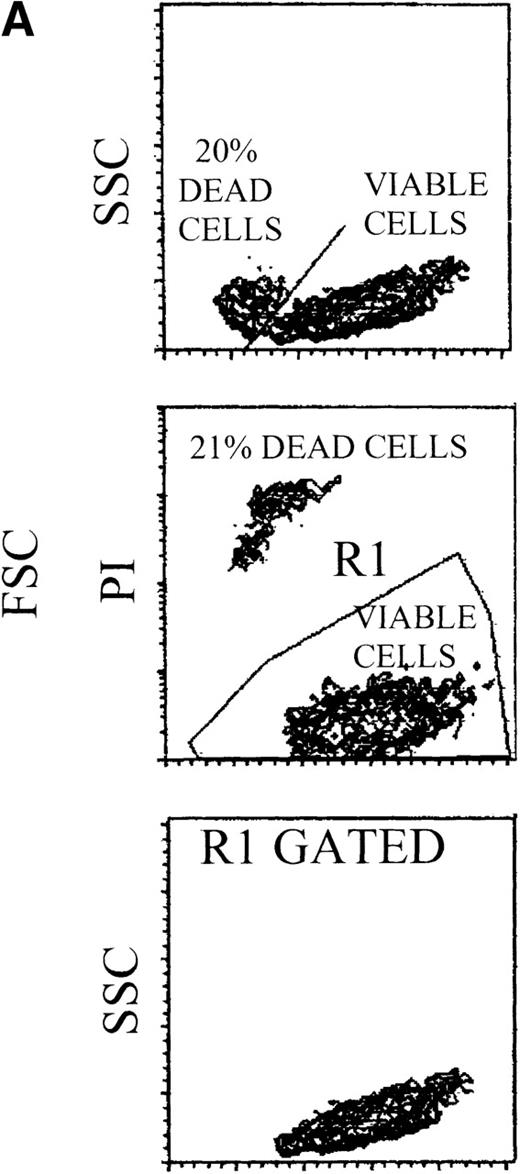
At later culture times (days 14-15), maturation along the different lineages reached the maximal levels before senescence of the culture (Figure 6). In fact, most cells differentiating along the erythroid lineage were CD71bright/glycophorin Abright, whereas cells differentiating toward the megakaryocytic lineage were characterized by an up-regulation of both early CD61 and late CD42b megakaryocytic surface antigens (Figure 6). Full maturation along the granulocytic lineage was accompanied by the up-regulation of CD15, followed by appearance of CD11b,31 whereas cells induced to differentiate along the monocytic lineage were characterized by the up-regulation of CD14, concomitant with the appearance of CD16 antigen (Figure 6). At this time point, although mature erythroid cells have a decreased size with respect to immature erythroblasts, they were still clearly distinguishable from apoptotic cells by either scatter characteristics or PI staining (Figure 7A). At variance with glycophorin Ainterm cells, mature glycophorin Abright erythroid cells were not significantly affected by 20-hour treatment with TRAIL (Figure 7B and Table 2). Similarly, anti-CD95 CH11 mAb failed to induce apoptosis in mature glycophorin Abright erythroid cells, in spite of a clearly detectable expression of surface CD95 antigen, which reached levels comparable to that previously observed in immature glycophorin Adim erythroid cells (Figure 2A).
Surface phenotype of unilineage hematopoietic cells at day 14 of culture.
At day 14, cells obtained in unilineage cultures with the indicated cytokines were phenotypically characterized by double staining with anti-CD71 + anti-glycophorin A (erythroid antigens), anti-CD61 + anti-CD42b (megakaryocytic antigens), anti-CD15 + anti-CD11b (granulocytic antigens), or anti-CD16 + anti-CD14 (monocytic antigens). Percentages of cells in the respective quadrants are indicated. CD14+ cells were 65%. Quadrants were set based on negative controls treated with isotype-matched irrelevant mAbs (not shown).
Loss of sensitivity to TRAIL of erythroid cells at late stages of differentiation.
(A) 14-day viable erythroid cells were detected by either FSC/SSC or PI staining analyses. Representative FSC/SSC (left and right panels) and PI (central panel) staining analyses are shown only for control cultures, since similar profiles were obtained in TRAIL- and anti-CD95-treated cells. The same cluster of dead cells was clearly detectable by both FSC/SSC and PI staining analyses. Viable cells, gated in R1 (region 1), were examined for glycophorin A expression, as shown in (B). (B) Cultures were supplemented with irrelevant IgM mAb and rHis6-tag peptide (CONT), TRAIL, or anti-CD95 (CH 11) IgM mAb for the last 20 hours before glycophorin A staining. X-axis: glycophorin A relative expression. Y-axis: relative cell number. Percentages of glycophorin A+ cells are indicated.
At these late culture times (days 14-15), megakaryocytic, granulocytic, and monocytic unilineage cultures were still virtually unaffected by both apoptosis-inducing stimuli (Table 2).
TRAIL-induced inhibition of pre-stimulated BFU-E in semisolid cultures
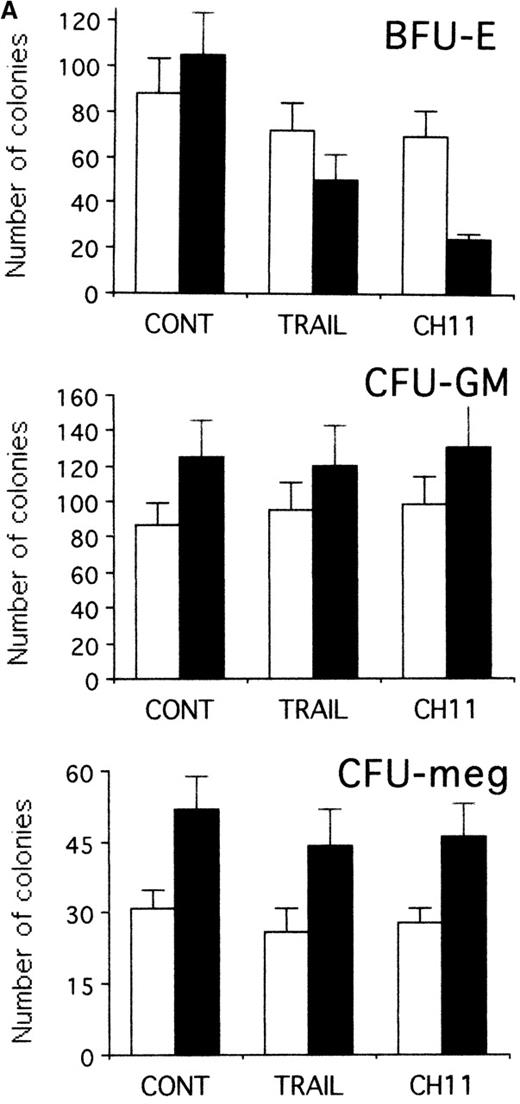
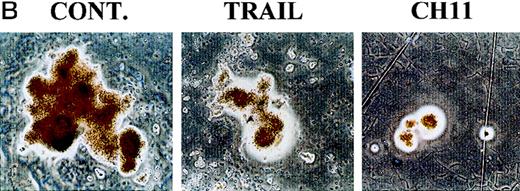
To establish whether TRAIL- and anti-CD95 CH11 mAb-treated hematopoietic progenitors maintained the ability to form colonies, CD34+ cells were seeded in semisolid cultures either immediately after purification or when they were first induced to proliferate for 2 days with hematopoietic growth factors in liquid culture and then treated for an additional 20 hours with TRAIL or anti-CD95 CH11 mAb before performing semisolid cultures. As shown in Figure 8A, the plating efficiency of freshly isolated CD34+ cells was modestly affected by either TRAIL or anti-CD95 mAb. Both TRAIL and anti-CD95 CH11 significantly (P < .05) decreased the number (Figure 8A) and the size (Figure 8B) of BFU-E in pre-stimulated cultures. Moreover, CFU-meg and CFU-GM were minimally affected by either TRAIL or anti-CD95 CH11 mAb in both experimental conditions (Figure 8A). These results obtained in semisolid cultures show an apparent discrepancy with the data illustrated in Figure 2A, in which we have found a lack of cytotoxic effect of TRAIL on early erythroid progenitors in liquid cultures. These differences can be explained by the fact that the clonogenic assay, which occurs over 12-14 days of culture, is a more sensitive indicator of early TRAIL-mediated cytotoxic effects than the annexin assay. An alternative, not mutually exclusive, explanation is that TRAIL, which is administered in semisolid cultures for 14 days instead of 20 hours, shows a combination of apoptotic and anti-differentiative effects, as previously shown for anti-CD95,32 which are preferentially reveled by the semisolid assay.
TRAIL-induced inhibition on pre-stimulated clonogenic erythroid progenitors (BFU-E) in semisolid cultures.
(A) Erythroid (BFU-E), megakaryocytic (CFU-meg), and granulocytic-macrophagic (CFU-GM) colonies were scored after 14 days of semisolid cultures. CD34+ cells were either seeded in semisolid cultures immediately after purification (white columns) or pre-stimulated in liquid cultures with specific cytokine cocktails for 2 days (black columns). Before seeding, cells were treated for 20 hours with irrelevant IgM mAb and rHis6-tag peptide (CONT), TRAIL, or anti-CD95 (CH 11) IgM mAb. Data are expressed as means ± SD of 4 separate experiments performed in duplicate. (B) Representative BFU-E are shown to document the difference in terms of colony size between TRAIL, CH11, and control cultures. Original magnification (400×).
Expression of TRAIL in human BM
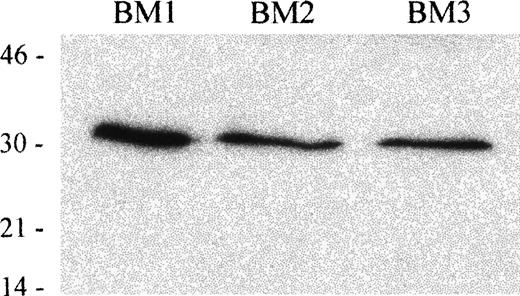
To investigate the expression of TRAIL in hematopoietic tissues, we next performed an immunoblot analysis on BM mononuclear cells, obtained from 3 different donors, using an anti-TRAIL mAb. In whole cell lysates obtained from 3 human BM cells, the anti-TRAIL mAb recognized a protein with an apparent molecular mass of 32-33 kDa, which corresponds to the membrane-bound form of TRAIL protein.13 14 Results are shown in Figure 9.
Immunoblot analysis of TRAIL protein expression in human BM mononuclear cells.
Whole cell lysates of human BM mononuclear cells from 3 different donors were tested with anti-TRAIL antibody (clone B35-1). Molecular mass markers are indicated (kDa).
Immunoblot analysis of TRAIL protein expression in human BM mononuclear cells.
Whole cell lysates of human BM mononuclear cells from 3 different donors were tested with anti-TRAIL antibody (clone B35-1). Molecular mass markers are indicated (kDa).
Discussion
The most important cytokine controlling erythrocyte production in vivo is EPO that functions mainly to increase the survival of erythroid progenitor cells.29 Previous studies,3,6-10,32 however, have implicated the CD95/CD95L system in the negative regulation of erythroid differentiation in both normal and pathophysiological conditions. In particular, the presence of relatively immature apoptotic erythroblasts, surrounded by macrophages phagocytosing apoptotic cells, has been described in vivo under physiological conditions in erythroblastic islands of the BM.9 It has been proposed that mature CD95L+erythroblasts kill, through a negative feedback regulatory mechanism, immature CD95+ erythroblasts and that macrophages are responsible for clearance of dead erythroid cells.9However, lpr-mutant mice bearing a defective Fas (CD95) gene do not show gross abnormalities in erythroid development.33 Moreover, inhibition of IFN-γ-induced erythroid apoptosis was only partially restored (notably large colonies have never been rescued) after blockage of the CD95 pathway.8 Taken together, these findings suggest that apoptotic pathways, other than the CD95/CD95L, are involved in the control of erythropoiesis.
In the present report, we have demonstrated that TRAIL can act, alternatively to CD95L, as a negative regulator of erythropoiesis. An interesting similarity between anti-CD95 mAb and TRAIL is that both specifically affect glycophorin Ainterm but neither immature glycophorindim nor mature glycophorin Abright erythroblasts. Furthermore, neither CD95 agonists nor TRAIL significantly affected cells differentiating along the megakaryocytic, granulocytic, or monocytic pathways. Finally, the addition of fresh EPO efficiently counteracted both the TRAIL- and anti-CD95-mediated apoptosis of erythroid cells.
The importance of TRAIL as a physiological inhibitor of erythropoiesis is underlined by the demonstration that TRAIL protein is expressed in normal human BM. Both CD95L and TRAIL exist as full-length membrane-bound molecules and as a shorter soluble form.13At variance with CD95L that contains a long intracellular region of 81 amino acids, TRAIL has a very short intracellular tail of 17 amino acids and appears regulated at the cell surface of different cell types by a proteolytic event sensitive to cysteine protease inhibitors.13 14
Although the source of TRAIL in the BM microenvironment remains to be investigated, it has been previously shown that PB monocytes/macrophages express and deploy CD95L34 and produce TRAIL in response to IFN-γ or IFN-α.35 Thus, resident monocytes/macrophages are likely candidates for the production of TRAIL at the BM levels, and it is conceivable that they play a central role in erythroid differentiation, altering the balance between survival factors (EPO) and apoptotic inducers (TRAIL and CD95L). Moreover, because mature erythroid cells obtained in EPO-containing liquid cultures after 10-14 days express TRAIL protein (data not shown), it is possible that new BM erythroblasts also contribute to the regulation of erythropoiesis through a negative feedback loop.
TRAIL has been involved in a variety of pathological conditions, mainly as a mediator of inflammatory cytokines or chemotherapy.18,35-45 In particular, much attention has been focused on the ability of TRAIL to selectively kill cancer cells.12,13,16,39-45 In this respect, the ability of TRAIL to adversely affect normal erythropoiesis should be taken in consideration in the prospective to employ TRAIL for anticancer treatments in vivo,44,45 as proposed on the basis of the supposed preferential sensitivity of cancer cells with respect to normal cells to TRAIL-induced apoptosis. In this respect, in agreement with our present data, Ashkenazi et al44 reported the presence of mild anemia after in vivo TRAIL administration to nonhuman primates. However, Walczak et al45 did not observe any significant alteration in red and white blood cells in mice treated for 14 days with human TRAIL. This finding may be due to the short-term observation time (14 days) that did not allow time to detect a TRAIL-induced anemia, which, if inducible in vivo, should take at least 1 month (life span of mouse erythrocytes). It is also possible that mouse erythroblasts are more resistant than those of nonhuman primates to human TRAIL.
Although we have not addressed the molecular mechanisms underlining the sensitivity of glycophorin Ainterm erythroblasts to TRAIL, previous studies (reviewed in Ashkenazi and Dixit5) have demonstrated an extreme complexity of the expression and function of TRAIL receptors in various cell types. In fact, at least 5 TRAIL receptors belonging to the apoptosis-inducing TNF-receptor (R) family have been described so far. TRAIL-R1 (DR4) and TRAIL-R2 (DR5)21,46 transduce apoptotic signals on binding of TRAIL,11 whereas TRAIL-R3 (DcR1) and TRAIL-R4 (DcR2) as well as osteoprotegerin (reviewed in Ashkenazi and Dixit5) are homologous to DR4 and DR5 in their cysteine-rich extracellular domain but lack intracellular death domain and apoptosis-inducing capability. At first, TRAIL-R3 and TRAIL-R4 have been proposed to function as decoy receptors, protecting normal cells from apoptosis.40,41 More recently, it has been shown that expression of TRAIL-R1 and/or TRAIL-R2 is necessary but not always sufficient to mediate TRAIL-induced apoptosis, whereas expression of TRAIL-R3 and/or TRAIL-R4 does not appear to be a significant factor in determining the resistance or sensitivity of tumor target cells to the effects of TRAIL.47,48 Similarly, the expression of CD95, which contains a conserved intracytoplasmic “death domain”49 indirectly responsible for activating the caspases enzymatic cascade,50 does not always correlate with its ability to transduce an apoptotic signal (this study).9,10 The inability of both TRAIL and CD95L to kill cells expressing TRAIL-R1 and/or TRAIL-R2 and CD95, respectively, may be due to a high level of expression of Bcl-2 protein,51 or other anti-apoptotic pathways, which are known to modulate the sensitivity to apoptotic agonists.
In conclusion, our study provides new insights into the mechanisms involved in the control of erythroid development, showing the presence of redundancy in the TNF super-family of proteins in the negative regulation of erythropoiesis. Like CD95L, TRAIL acts in a stage of development-specific manner. Moreover, our findings predict that the administration of erythroid protective cytokines, such as EPO, would be beneficial as a strategy for long-term anticancer therapy, based on the in vivo administration of TRAIL.
Acknowledgment
We are grateful to Kristi Bemis for excellent technical assistance.
Supported by Telethon funds (P.S.), by CNR grant 96.03134. CT04 (S.P.), by NIH grant CA78890 (E.S.A.), and by local funds and MURST cofin of the Universities of Urbino, Ferrara, Chieti, Bologna, and Brescia.
Reprints:Loris Zamai, Institute of Morphological Sciences, University of Urbino, Campus Scientifico Località Crocicchia, 61029 Urbino, Italy; e-mail: zamai1@biocfarm.unibo.it.
The publication costs of this article were defrayed in part by page charge payment. Therefore, and solely to indicate this fact, this article is hereby marked “advertisement” in accordance with 18 U.S.C. section 1734.





This feature is available to Subscribers Only
Sign In or Create an Account Close Modal