Key Points
Forimtamig exhibits superior potency compared with other GPRC5D- and BCMA-targeting TCBs.
Forimtamig combination with TCBs and CELMoDs prevents tumor relapse.
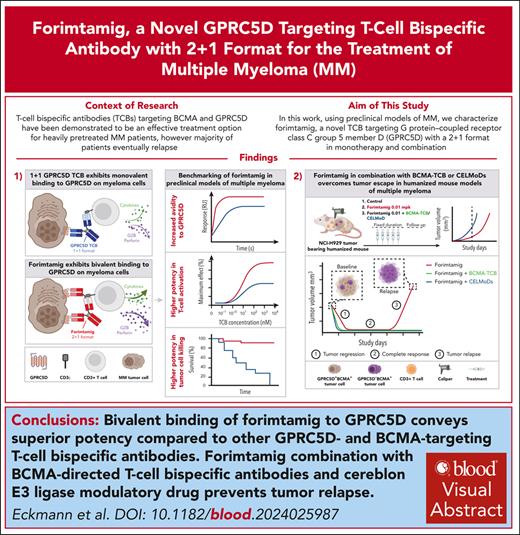
Visual Abstract
Despite several approved therapies, multiple myeloma (MM) remains an incurable disease with high unmet medical need. “Off-the-shelf” T-cell bispecific antibodies (TCBs) targeting B-cell maturation antigen (BCMA) and G protein–coupled receptor class C group 5 member D (GPRC5D) have demonstrated high objective response rates in heavily pretreated patients with MM; however, primary resistance, short duration of response, and relapse driven by antigen shift frequently occur. Although GPRC5D represents the most selective target in MM, recent findings indicate antigen loss occurs more frequently than with BCMA. Thus, anti-GPRC5D immunotherapies must hit hard during a short period of time. Here, we characterize forimtamig, a novel GPRC5D-targeting TCB with 2+1 format. Bivalent binding of forimtamig to GPRC5D confers higher affinity than classical 1+1 TCB formats correlating with formation of more stable immunological synapses and higher potency in tumor cell killing and T-cell activation. Using an orthotopic mouse model of MM, forimtamig recruited T effector cells to the bone marrow and induced rapid tumor killing even after the introduction of step-up dosing to mitigate cytokine release. Combination of forimtamig with standard-of-care agents including anti-CD38 antibodies, immunomodulatory drugs, and proteasome inhibitors improved depth and duration of response. The combination of forimtamig with novel therapeutic agents including BCMA TCB and cereblon E3 ligase modulatory drugs was potent and prevented occurrence of GPRC5D -negative tumor relapse. Forimtamig is currently being evaluated in phase 1 clinical trials in patients with relapsed and refractory MM for monotherapy and in combination treatments. This trial was registered at www.ClinicalTrials.gov as #NCT04557150.
Introduction
Multiple myeloma (MM) is the second most prevalent form of blood cancer in adults, accounting for 10% of all hematologic diseases, and the incidence is expected to increase in an aging population.1
The approval of 2 B-cell maturation antigen (BCMA)–targeting chimeric antigen receptor (CAR) therapies in patients with relapsed and refractory MM (RRMM) is considered to be a paradigm shift in the therapeutic approach for MM.2,3 Furthermore, recent data supporting the use of CAR T cells in earlier lines of therapy underline the transformative potential of T-cell-engaging therapies.4 T-cell bispecific antibodies (TCBs) have demonstrated significant potential in patients with MM, based on high objective response rate (ORR), deep and long-lasting responses, favorable safety profiles, and off-the-shelf availability.5,6 Three TCBs have recently been approved for RRMM.7-11 Teclistamab, elranatamab, and talquetamab exhibit a 1+1 immunoglobulin G configuration with monovalent binding to the tumor target, BCMA or G protein–coupled receptor class C group 5 member D (GPRC5D), and to CD3e on human T cells.12-14 We hypothesized that bivalent targeting of a myeloma cell target would translate into an avidity-based gain in tumor cell lysis, as observed with glofitamab and alnuctamab.15,16
GPRC5D represents the most differentiated target in MM with minimal normal tissue expression in the skin and little to no expression on healthy B and plasma cells.17-20 Emerging RNA data sets confirm GPRC5D to be highly expressed across different stages of MM and to be elevated even further in patients with t(4;14) translocations and 1q amplifications.18,21-23 The therapeutic potential of targeting GPRC5D was illustrated by strong clinical responses observed for talquetamab and GPRC5D CAR T cells, suggesting that TCB molecules with higher potency could achieve even deeper and more durable responses.24,25
In the current study, we introduce forimtamig, a novel and more potent GPRC5D-TCB with 2+1 format. We delineated the mode of action of forimtamig in an orthotopic humanized mouse model and provided evidence for improved response in combination with standard-of-care (SoC) agents. Furthermore, we identified novel combination partners in BCMA TCB and cereblon E3 ligase modulatory drugs (CELMoDs) that allow to further increase progression-free survival (PFS) rates by preventing occurrence of tumor relapse.
Materials and methods
Protein target prevalence was assessed in baseline bone marrow (BM) aspirate samples from 64 evaluable patients with RRMM enrolled in phase 1 study NCT04557150. GPRC5D and BCMA expressions were measured by flow cytometry and are shown as frequency of positive MM plasma cells (MMPCs) or molecules of equivalent soluble fluorophore. Chromosomal aberrations for determination of cytogenetic risk were detected by fluorescence in situ hybridization on immunomagnetically sorted plasma cells before patients entered the study. All patients provided a written informed consent.
All animal studies reported have been reviewed and approved by the local government under the animal licenses ROB-55.2-2532.Vet_03-16-10 or ROB-55.2-2532.Vet_03-20-170. Patients with cancer from Institut Universitaire du Cancer de Toulouse-Oncopole (Toulouse) gave a written informed consent, and collection was approved by the French Committee for the Protection of Persons (DC-2012-1654) and by local Institut Universitaire du Cancer de Toulouse-Oncopole review boards. Patients with cancer from Clínica Universidad de Navarra were collected according to the local ethics committee and the Declaration of Helsinki. All BM samples were collected after an informed consent was given by each patient, according to the local ethics committee and the Declaration of Helsinki.
A complete description of methods is presented in the supplemental Data, available on the Blood website.
Results
Forimtamig binds with high avidity to the N terminus of human GPRC5D inducing formation of stable synapses
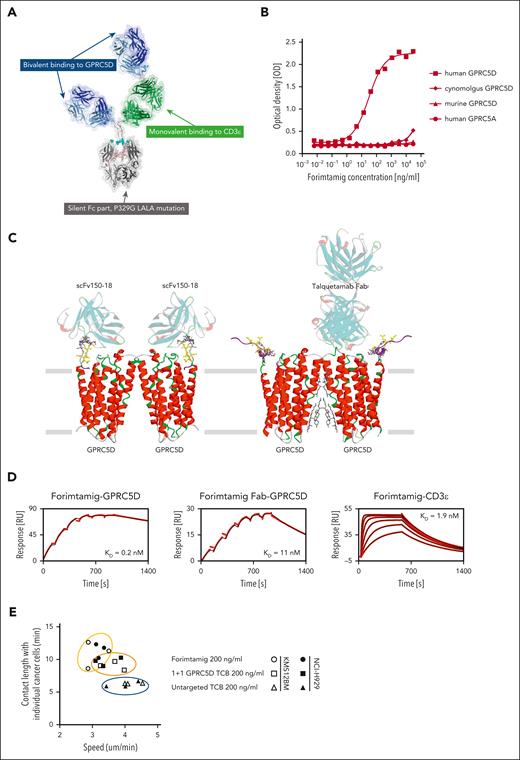
Forimtamig has a 2+1 head-to-tail configuration designed to exhibit bivalent binding to GPRC5D on myeloma cells and monovalent binding to CD3ε on human T cells bearing a silent Fc with P329G LALA mutations to extend half-life and prevent Fc gamma receptor (FcγR) engagement (Figure 1A).26 Forimtamig was confirmed to selectively bind to human GPRC5D but not GPRC5A, the closest homologue,27 and exhibited no significant binding to murine GPRC5D nor cynomolgus monkey GPRC5D (Figure 1B). Forimtamig was found to bind to the unstructured N-terminal part of GPRC5D, furthest away from the GPRC5D dimerization interface. It is likely that a single GPRC5D homodimer can accept 2 forimtamig anti-GPRC5D Fabs, leading to a 2:2 complex such as scFv150-18, whereas binding of talquetamab anti-GPRC5D near the dimerization interface results in a 2:1 GPRC5D-Fab complex (Figure 1C). This is consistent with the observation that, although monovalent affinities of forimtamig to GPRC5D (11 nM) and to CD3ε (1.9 nM) were in the same range as talquetamab,28 bivalent binding of forimtamig resulted in a more than 50-fold higher avidity of 0.2 nM (Figure 1D; supplemental Figure 1A). We next compared the stability of synapses induced by forimtamig and 1+1 GPRC5D-TCB in vitro using live confocal imaging of labeled CD8 T cells and NCI-H929 or KMS-12BM tumor cells with high and low GPRC5D expression levels, respectively (supplemental Figure 1B). Immunological synapses formed by forimtamig were more stable, as indicated by stronger reduction in T-cell motility, combined with an increase in contact duration between T and tumor cells irrespective of target expression level (Figure 1E; supplemental Figure 1C-D). We next used fluorescently labeled forimtamig to confirm its localization at the tumor cell–T-cell interface and observed synapse formation to correlate with increased caspase 3/7 expression in cancer cells (supplemental Figure 1E).
Biochemical characterization of forimtamig and synapse formation. (A) The molecular model of forimtamig was generated and visualized with discovery studio 2021; residues involved in the P329G LALA silent Fc mutations are shown as spheres colored in cyan. (B) Binding kinetics was measured using horseradish peroxidase (HRP)-based colorimetric analysis in Chinese hamster ovary (CHO) cells transfected with mouse, cynomolgus, or human GPRC5D or human GPRC5A and incubated with increasing concentrations of forimtamig. (C) The likely epitope of forimtamig could be mapped to the unstructured N terminus of GPRC5D and is shown in the context of 2 recently published cryo-electro magnetic (EM) structures of GPRC5D homodimer, in complex with 2 scFvs (protein data bank (PDB) ID 8yzk) and in complex with a single talquetamab Fab anti-GPRC5D (PDB ID 9ima); the core epitope (yellow ball and stick representation) consists of GPRC5D residues 5 to 10, but an additional involvement of residues 11 to 16 (gray stick representation) cannot be ruled out; as the unstructured N terminus is not or only partially resolved in the published structures, the missing N-terminal segments (purple ribbon representation) were remodeled from the AlphaFold model and the shown conformations represent only a placeholder for a whole ensemble of possible conformations; the actual conformation of GPRC5D’s N-terminal segment in complex with forimtamig anti-GPRC5D has yet to be determined. (D) Grating-coupled interferometry (GCI) was used to determine affinities (equilibrium dissociation constant, KD) of forimtamig and forimtamig monovalent Fab to human GPRC5D and of forimtamig to human CD3ε; black lines indicate fit according to a 1:1 Langmuir model. (E) Correlation of contact duration and speed of fluorescently labeled T cells as measured by confocal live cell imaging to determine the stability of immunological synapses; all treatments are at 200 ng/mL. scFv, single-chain variable fragment.
Biochemical characterization of forimtamig and synapse formation. (A) The molecular model of forimtamig was generated and visualized with discovery studio 2021; residues involved in the P329G LALA silent Fc mutations are shown as spheres colored in cyan. (B) Binding kinetics was measured using horseradish peroxidase (HRP)-based colorimetric analysis in Chinese hamster ovary (CHO) cells transfected with mouse, cynomolgus, or human GPRC5D or human GPRC5A and incubated with increasing concentrations of forimtamig. (C) The likely epitope of forimtamig could be mapped to the unstructured N terminus of GPRC5D and is shown in the context of 2 recently published cryo-electro magnetic (EM) structures of GPRC5D homodimer, in complex with 2 scFvs (protein data bank (PDB) ID 8yzk) and in complex with a single talquetamab Fab anti-GPRC5D (PDB ID 9ima); the core epitope (yellow ball and stick representation) consists of GPRC5D residues 5 to 10, but an additional involvement of residues 11 to 16 (gray stick representation) cannot be ruled out; as the unstructured N terminus is not or only partially resolved in the published structures, the missing N-terminal segments (purple ribbon representation) were remodeled from the AlphaFold model and the shown conformations represent only a placeholder for a whole ensemble of possible conformations; the actual conformation of GPRC5D’s N-terminal segment in complex with forimtamig anti-GPRC5D has yet to be determined. (D) Grating-coupled interferometry (GCI) was used to determine affinities (equilibrium dissociation constant, KD) of forimtamig and forimtamig monovalent Fab to human GPRC5D and of forimtamig to human CD3ε; black lines indicate fit according to a 1:1 Langmuir model. (E) Correlation of contact duration and speed of fluorescently labeled T cells as measured by confocal live cell imaging to determine the stability of immunological synapses; all treatments are at 200 ng/mL. scFv, single-chain variable fragment.
Forimtamig exhibits high potency against tumor cells with clinically relevant target expression level
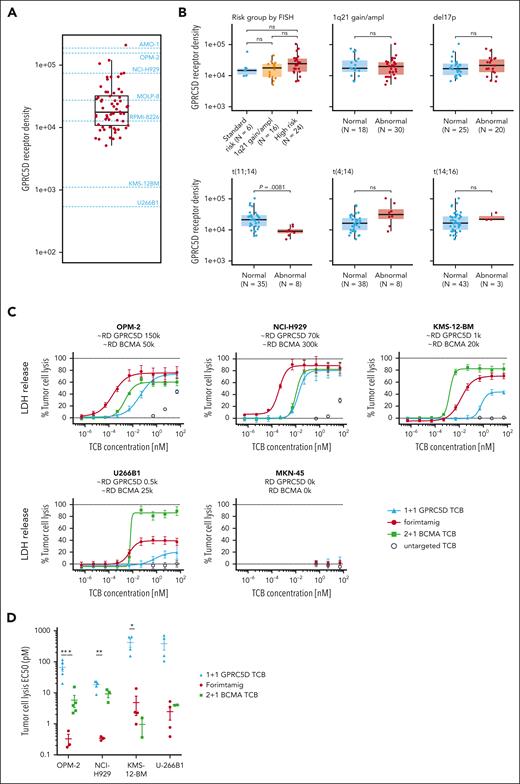
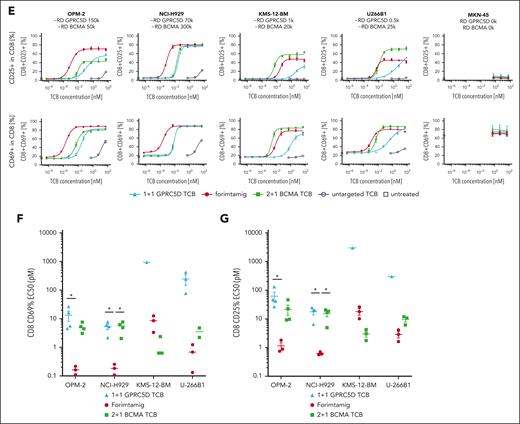
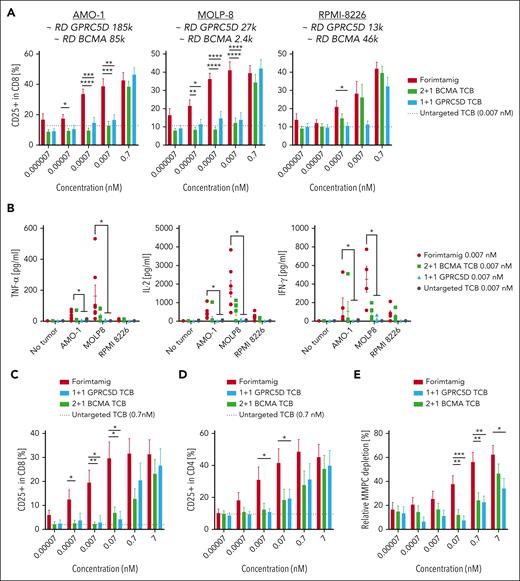
To identify preclinical models with patient relevant target expression, we compared GPRC5D protein level in BM aspirates of 64 patients with RRMM enrolled in phase 1 study NCT04557150 with a set of MM cell lines using flow cytometry (Figure 2A; supplemental Figure 2B). GPRC5D protein expression was detected in 97% of patients and MMPCs from target positive patients expressed on average 29 600 GPRC5D molecules (Figure 2A; supplemental Figure 2A). GPRC5D level did not significantly differ between patient groups defined by cytogenetic risk factors, except for patients with t(11;14) translocation that exhibits less than 10 000 GPRC5D copy numbers (Figure 2B). Furthermore, GPRC5D protein level was not affected by the Internal Staging System score, number of previous lines of therapy, previous exposure to BCMA- or CD38-targeted therapies, or extramedullary disease (EMD) status (supplemental Figure 2C-D). Of note, most MMPCs expressed GPRC5D or BCMA or both markers, whereas double-negative cells were rare (supplemental Figure 2A). We next tested the in vitro activity of different TCBs against 4 MM cell lines covering a wide range of target expression as observed in patients with MM, using peripheral blood mononuclear cells (PBMCs) as effector cells. Compared with a 1+1 GPRC5D-TCB, forimtamig was 202-, 54-, 87-, or 156-fold more potent in killing of MMPCs with high (OPM-2), intermediate (NCI-H929), low (KMS-12BM), or ultra-low (U266B1) GPRC5D expression. Forimtamig exhibited higher killing potency than a 2+1 BCMA TCB against NCI-H929 and achieved comparable EC50 with KMS-12BM and U266B1, despite more than 4-, 20-, or even 50-fold higher BCMA than GPRC5D expression, respectively (Figure 2C-D; supplemental Figure 2B). As with tumor cell killing, forimtamig was highly potent in activating CD8+ and CD4+ T cells, demonstrated by upregulation of CD69 and CD25 and enhanced secretion of granzyme-B (GZB), interleukin-2 (IL-2), and interferon gamma (IFN-γ) (Figure 2E-G; supplemental Figure 2E-H).
GPRC5D protein expression in patients with RRMM and evaluation of TCB potency in vitro. (A) GPRC5D receptor density on MMPCs in bone marrow aspirates from 61 patients with RRMM enrolled in study NCT04557150 (3 samples from 64 could not be reported due to technical issues); these values are depicted on the y-axis of the plot and each dot represents 1 sample; dashed lines on the graph represent mean values for GPRC5D receptor density for 7 cell lines with names of the cell lines specified respectively; GPRC5D receptor density was determined by bead quantification using MESF beads for patient samples and Quantum Simply Cellular kit for cell lines (technical details are described in supplemental Materials and methods). (B) Association between overall cytogenetic risk or individual chromosomal aberrations and GPRC5D binding sites on MM cells in BM; high risk was defined as having ≥1 of the following chromosomal aberrations (regardless of 1q21gain/ampl): del(17p), t(4;14), t(14;16); the 1q21gain/ampl group was defined as having only 1q21gain/ampl reported; N indicates the number of samples that could be evaluated for the target expression. (C-G) MM cell lines with different GPRC5D and BCMA receptor densities (RDs) were cocultured with human peripheral blood mononuclear cells (PBMCs) from 4 to 5 individual healthy donors at an effector-to-target (E:T) ratio of 5:1 and treated with increasing concentrations of forimtamig, 2+1 BCMA TCB, 1+1 GPRC5D TCB, or a untargeted TCB control; LDH release was measured as a surrogate for tumor cell lysis after 40 hours; Triton X-100–treated samples were used to determined maximum tumor lysis and untreated samples to determine spontaneous tumor lysis; expression levels of CD69 and CD25 were measured by flow cytometry as a surrogate for CD8 T-cell activation after 40 hours; EC50 values were calculated from dose-response curves from individual donors; in case curve fits did not allow valid EC50 calculations (if curves either did not reach the top or bottom plateau or had a very wide confidence interval), data were not plotted; and statistical differences between treatment groups were determined per cell line using 1-way analysis of variance (ANOVA) with Tukey posttest analysis. ∗P < .05; ∗∗P < .005. EC50, median effective concentration; LDH, lactate dehydrogenase; MESF, molecules of equivalent soluble fluorophore; ns, not significant.
GPRC5D protein expression in patients with RRMM and evaluation of TCB potency in vitro. (A) GPRC5D receptor density on MMPCs in bone marrow aspirates from 61 patients with RRMM enrolled in study NCT04557150 (3 samples from 64 could not be reported due to technical issues); these values are depicted on the y-axis of the plot and each dot represents 1 sample; dashed lines on the graph represent mean values for GPRC5D receptor density for 7 cell lines with names of the cell lines specified respectively; GPRC5D receptor density was determined by bead quantification using MESF beads for patient samples and Quantum Simply Cellular kit for cell lines (technical details are described in supplemental Materials and methods). (B) Association between overall cytogenetic risk or individual chromosomal aberrations and GPRC5D binding sites on MM cells in BM; high risk was defined as having ≥1 of the following chromosomal aberrations (regardless of 1q21gain/ampl): del(17p), t(4;14), t(14;16); the 1q21gain/ampl group was defined as having only 1q21gain/ampl reported; N indicates the number of samples that could be evaluated for the target expression. (C-G) MM cell lines with different GPRC5D and BCMA receptor densities (RDs) were cocultured with human peripheral blood mononuclear cells (PBMCs) from 4 to 5 individual healthy donors at an effector-to-target (E:T) ratio of 5:1 and treated with increasing concentrations of forimtamig, 2+1 BCMA TCB, 1+1 GPRC5D TCB, or a untargeted TCB control; LDH release was measured as a surrogate for tumor cell lysis after 40 hours; Triton X-100–treated samples were used to determined maximum tumor lysis and untreated samples to determine spontaneous tumor lysis; expression levels of CD69 and CD25 were measured by flow cytometry as a surrogate for CD8 T-cell activation after 40 hours; EC50 values were calculated from dose-response curves from individual donors; in case curve fits did not allow valid EC50 calculations (if curves either did not reach the top or bottom plateau or had a very wide confidence interval), data were not plotted; and statistical differences between treatment groups were determined per cell line using 1-way analysis of variance (ANOVA) with Tukey posttest analysis. ∗P < .05; ∗∗P < .005. EC50, median effective concentration; LDH, lactate dehydrogenase; MESF, molecules of equivalent soluble fluorophore; ns, not significant.
Forimtamig exhibits superior activity in BM aspirates and in vivo models of MM compared with 1+1 GPRC5D TCB
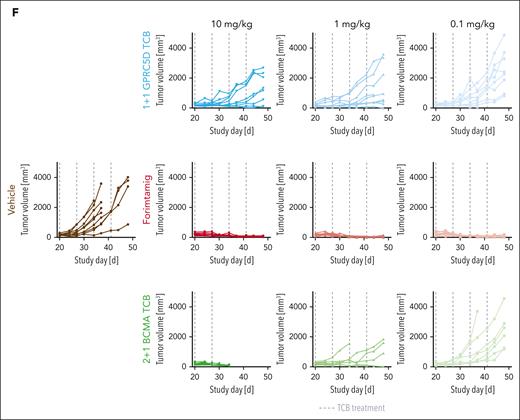
We next validated our results in fresh tumor material from patients with newly diagnosed MM (NDMM). We first exposed CD138− BM mononuclear cells from at least 6 patients with NDMM to a different set of myeloma cell lines with a wide range of GPRC5D expression. Compared with other TCBs, forimtamig exhibited superior potency in activating tumor-infiltrating lymphocytes (TILs) as indicated by increased CD25 expression. Activation of TILs was independent of GPRC5D expression level and was associated with enhanced secretion of cytokines (Figure 3A-B). We then treated total BM aspirates from at least 6 patients with NDMM per cell line accordingly. Forimtamig was most potent in MMPC killing and TIL activation as confirmed by depletion of up to 60% MMPCs and increased expression of CD69 and CD25 (Figure 3C-E; supplemental Figure 3A-C). To validate our findings in vivo, we treated NCI-H929 engrafted humanized mice with 4 weekly TCB doses at 0.1, 1, and 10 mg/kg (supplemental Figure 3D). In contrast to what we observed in vitro, NCI-H929 tumor exhibited patchy and low GPRC5D expression in mice (supplemental Figure 3F-G). Forimtamig induced tumor regression in all animals and at all doses tested whereas the maximum response observed for 1+1 GPRC5D TCB was tumor growth delay (Figure 3F; supplemental Figure 3E). The 2+1 BCMA TCB was less efficacious especially at lower doses of 1 mg/kg and 0.1 mg/kg although tumors expressed a higher level of BCMA treatment start (Figure 3F; supplemental Figure 3F-G).
Benchmarking of forimtamig against other TCBs in preclinical models of MM. (A-B) Fresh bone marrow aspirates from patients with NDMM were depleted of CD138+ plasma cells and cocultured with RPMI-8226 (6 samples enrolled), MOLP-8 (9 samples enrolled), or AMO-1 (12 samples enrolled) tumor cells with a wide range of GPRC5D and BCMA RDs at a final E:T ratio of 5:1 in the presence of increasing concentrations of forimtamig, 1+1 GPRC5D TCB, 2+1 BCMA TCB, or an untargeted TCB control antibody at 0.007 nM; expression of CD25 on CD8 TILs was measured by flow cytometry after 48 hours; baseline CD25 expression, as detected by an untargeted TCB control, is represented by the horizontal black dotted line; cytokine secretion was analyzed in the supernatant of T-cell–myeloma cell line cocultures after 36 hours; graphs summarizing the mean + standard error of the mean (SEM) expression and statistics between groups were determined by 1-way ANOVA with Tukey posttest analysis. ∗P < .05; ∗∗P < .005; ∗∗∗P < .0005; ∗∗∗∗P < .0001. (C-D) Total BM cells from 9 patients with NDMM were cultured in the presence of increasing concentrations of forimtamig, 1+1 GPRC5D TCB, 2+1 BCMA TCB, or an untargeted TCB control at 0.007 nM; expression of CD25 on CD4 and CD8 TILs was measured by flow cytometry after 36 hours; baseline CD25 expression, as detected by an untargeted TCB control, is represented by the horizontal black dotted line; and graphs summarizing the mean + SEM expression and statistics between groups were determined by 1-way ANOVA with Tukey posttest analysis. ∗P < .05; ∗∗P < .005; ∗∗∗P < .0005. (E) Total BM cells from 13 patients with NDMM were cultured in the presence of the indicated concentration of TCBs for 36 hours; graphs summarizing the mean + SEM depletion of MMPCs as calculated by the frequency of CD38+CD138+ double-positive cells in relation to untreated TCB control; graphs summarizing the mean + SEM expression and statistics between groups were determined by 1-way ANOVA with Tukey posttest analysis. ∗P < .05; ∗∗P < .005; ∗∗∗P < .0005. (F) Humanized NSG mice (huNSG) were subcutaneously implanted with 2.5 × 10⁶ NCI-H929 tumor cells and when tumors reached 200 to 250 mm3 injected once a week IV with indicated TCB doses; tumor growth was measured over time using caliper and was plotted as individual spider plots for each of the 9 animals per group; animals treated with 2+1 BCMA TCB at 10 mg/kg were taken down after 2 cycles as they reached predefined termination criteria (see “Materials and methods”). TNFα, tumor necrosis factor α.
Benchmarking of forimtamig against other TCBs in preclinical models of MM. (A-B) Fresh bone marrow aspirates from patients with NDMM were depleted of CD138+ plasma cells and cocultured with RPMI-8226 (6 samples enrolled), MOLP-8 (9 samples enrolled), or AMO-1 (12 samples enrolled) tumor cells with a wide range of GPRC5D and BCMA RDs at a final E:T ratio of 5:1 in the presence of increasing concentrations of forimtamig, 1+1 GPRC5D TCB, 2+1 BCMA TCB, or an untargeted TCB control antibody at 0.007 nM; expression of CD25 on CD8 TILs was measured by flow cytometry after 48 hours; baseline CD25 expression, as detected by an untargeted TCB control, is represented by the horizontal black dotted line; cytokine secretion was analyzed in the supernatant of T-cell–myeloma cell line cocultures after 36 hours; graphs summarizing the mean + standard error of the mean (SEM) expression and statistics between groups were determined by 1-way ANOVA with Tukey posttest analysis. ∗P < .05; ∗∗P < .005; ∗∗∗P < .0005; ∗∗∗∗P < .0001. (C-D) Total BM cells from 9 patients with NDMM were cultured in the presence of increasing concentrations of forimtamig, 1+1 GPRC5D TCB, 2+1 BCMA TCB, or an untargeted TCB control at 0.007 nM; expression of CD25 on CD4 and CD8 TILs was measured by flow cytometry after 36 hours; baseline CD25 expression, as detected by an untargeted TCB control, is represented by the horizontal black dotted line; and graphs summarizing the mean + SEM expression and statistics between groups were determined by 1-way ANOVA with Tukey posttest analysis. ∗P < .05; ∗∗P < .005; ∗∗∗P < .0005. (E) Total BM cells from 13 patients with NDMM were cultured in the presence of the indicated concentration of TCBs for 36 hours; graphs summarizing the mean + SEM depletion of MMPCs as calculated by the frequency of CD38+CD138+ double-positive cells in relation to untreated TCB control; graphs summarizing the mean + SEM expression and statistics between groups were determined by 1-way ANOVA with Tukey posttest analysis. ∗P < .05; ∗∗P < .005; ∗∗∗P < .0005. (F) Humanized NSG mice (huNSG) were subcutaneously implanted with 2.5 × 10⁶ NCI-H929 tumor cells and when tumors reached 200 to 250 mm3 injected once a week IV with indicated TCB doses; tumor growth was measured over time using caliper and was plotted as individual spider plots for each of the 9 animals per group; animals treated with 2+1 BCMA TCB at 10 mg/kg were taken down after 2 cycles as they reached predefined termination criteria (see “Materials and methods”). TNFα, tumor necrosis factor α.
Forimtamig induces killing of MM cells in the BM microenvironment
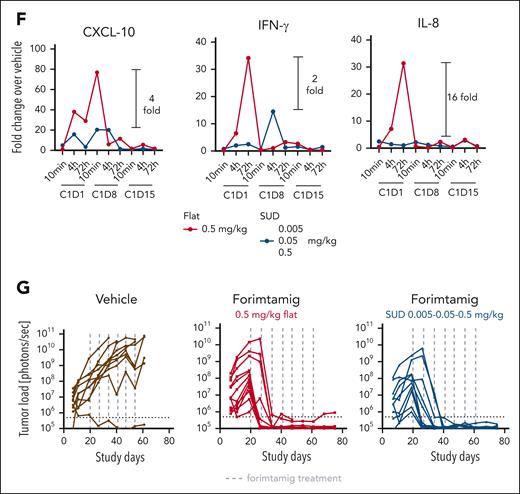
We next generated an orthotopic MM model and tracked growth of luciferase-labeled NCI-H929 cells in the femur using bioluminescence imaging or soluble BCMA (sBCMA), a correlative biomarker for tumor load in mice (supplemental Figure 4A). Tumor load in BM was reduced at all forimtamig doses tested, with most animals being tumor-free before the third administration (Figure 4A; supplemental Figure 4C). A longitudinal biomarker analysis (supplemental Figure 4B) confirmed rapid killing of MMPCs in the BM as early as 72 hours after cycle 1 (C1) dosing as indicated by a drop in sBCMA levels by almost 100% (Figure 4B). Forimtamig induced a 10-fold reduction of circulating CD8 T cells 48 hours after C1 injection and an almost fivefold CD8 T-cell expansion 24 hours after C2 dosing (Figure 4C). A transient decline of CD8 T cells observed in the tumor tissue at C1 was followed by an up to fivefold expansion of intratumoral T cells 72 hours after C1 and C2 dosing (Figure 4C). Timing of T-cell expansion in tumors and drop of sBCMA correlated with a shift of T-cell phenotype from naïve CD62L+CD45RA+ toward CD4RA−CD62L− effector memory CD8+ T cells in the blood and in the tumor (Figure 4D). Forimtamig induced systemic cytokine release at C1 with peak concentrations at 4 hours (IL-2, macrophage inflammatory protein-1 alpha, and granulocyte-macrophage colony-stimulating factor), 24 hours (tumor necrosis factor α [TNFα], CXCL-10, granulocyte colony-stimulating factor, and IL-10), and 48 to 72 hours (IFN-γ, IL-6, IL-8, or sCD25). In the absence of detectable tumor mass, no cytokine release was observed when forimtamig was dosed at C2 (Figure 4E). We next split dosing in C1 and explored the impact of step-up dosing (SUD) on cytokine release. We treated mice with a SUD regimen of 0.005, 0.05, and 0.5 mg/kg at C1 day 1 (C1D1), day 8 (C1D8), and day 15 (C1D15) and compared cytokines 10 minutes, 4 hours, and 72 hours after each administration to flat dosing at 0.5 mg/kg (Figure 4F). SUD decreased the peak serum level of CXCL-10, IL-8, and IFN-γ by 2- up to 16-fold and delayed the cytokine peak from C1D1 to C1D8 (Figure 4F). To evaluate the impact of SUD on efficacy, we compared the SUD and flat dosing regimen for a fixed duration in vivo. The use of SUD induced a comparable efficacy compared with flat dosing (Figure 4G; supplemental Figure 4C).
Evaluation of forimtamig’s mode of action in an orthotopic mouse model of MM. (A) Luciferase-labeled NCI-H929 cells were injected into the femur of humanized NSG (huNSG) mice and randomized into 4 different treatment arms based on bioluminescent signals measured as photons per second (p/s); animals were treated once weekly with indicated doses of forimtamig and tumor growth was monitored over time; background signals were determined in nontumor-bearing mice; each group included 10 animals and is presented as mean + SEM. (B) Orthotopically engrafted huNSG mice (n = 5) were treated once weekly with 0.1 mg/kg forimtamig and sBCMA levels were detected in serum of animals before, 4, 24, 48, 72, and 168 hours after dosing using enzyme-linked immunosorbent assay (ELISA). (C-E) Orthotopically engrafted humanized mice (n = 40) were treated once weekly with 0.1 mg/kg forimtamig; BM, blood and serum were harvested from n = 5 animals at 4, 24, 48, 72, and 168 hours, after C1 and C2 dosing, and subjected to fluorescence-activated cell sorting (FACS) or cytokine analysis; CD8 T-cell counts in the tumor tissue (right femur) were normalized against CD8 counts from healthy BM from the same animal (left femur); naïve CD8 T cells were defined as CD62L+CD45RA+ and effector memory T cells as CD4RA−CD62L−. (F) Orthotopically engrafted huNSG mice (n = 15 animals per group) were treated once weekly with 0.5 mg/kg forimtamig flat or 0.005, 0.05, and 0.5 mg/kg SUD at C1D1, C1D8, and C1D15; serum was harvested from n = 5 animals at 10 minutes, 4 hours, and 72 hours after dosing and cytokine levels were measured by bioplex; and fold change in cytokine release was calculated by normalization to vehicle animals at the same time points. (G) Orthotopically engrafted huNSG mice (n = 15 animals per group) were treated once weekly with 0.5 mg/kg forimtamig flat or 0.005, 0.05, and 0.5 mg/kg SUD at C1D1, C1D8, and C1D15, and tumor monitored over time by bioluminescence imaging; and background signals were determined in nontumor-bearing mice. TNF-α, tumor necrosis factor α.
Evaluation of forimtamig’s mode of action in an orthotopic mouse model of MM. (A) Luciferase-labeled NCI-H929 cells were injected into the femur of humanized NSG (huNSG) mice and randomized into 4 different treatment arms based on bioluminescent signals measured as photons per second (p/s); animals were treated once weekly with indicated doses of forimtamig and tumor growth was monitored over time; background signals were determined in nontumor-bearing mice; each group included 10 animals and is presented as mean + SEM. (B) Orthotopically engrafted huNSG mice (n = 5) were treated once weekly with 0.1 mg/kg forimtamig and sBCMA levels were detected in serum of animals before, 4, 24, 48, 72, and 168 hours after dosing using enzyme-linked immunosorbent assay (ELISA). (C-E) Orthotopically engrafted humanized mice (n = 40) were treated once weekly with 0.1 mg/kg forimtamig; BM, blood and serum were harvested from n = 5 animals at 4, 24, 48, 72, and 168 hours, after C1 and C2 dosing, and subjected to fluorescence-activated cell sorting (FACS) or cytokine analysis; CD8 T-cell counts in the tumor tissue (right femur) were normalized against CD8 counts from healthy BM from the same animal (left femur); naïve CD8 T cells were defined as CD62L+CD45RA+ and effector memory T cells as CD4RA−CD62L−. (F) Orthotopically engrafted huNSG mice (n = 15 animals per group) were treated once weekly with 0.5 mg/kg forimtamig flat or 0.005, 0.05, and 0.5 mg/kg SUD at C1D1, C1D8, and C1D15; serum was harvested from n = 5 animals at 10 minutes, 4 hours, and 72 hours after dosing and cytokine levels were measured by bioplex; and fold change in cytokine release was calculated by normalization to vehicle animals at the same time points. (G) Orthotopically engrafted huNSG mice (n = 15 animals per group) were treated once weekly with 0.5 mg/kg forimtamig flat or 0.005, 0.05, and 0.5 mg/kg SUD at C1D1, C1D8, and C1D15, and tumor monitored over time by bioluminescence imaging; and background signals were determined in nontumor-bearing mice. TNF-α, tumor necrosis factor α.
Combination of forimtamig with SoC agents improves antimyeloma responses
We next evaluated the combination of forimtamig with SoC agents using autologous BM aspirate samples from treatment-naïve patients with NDMM. Forimtamig induced lysis of 34% MMPCs, which was significantly increased in combination with daratumumab (dara) or with dara plus pomalidomide (pom) but not pom alone (Figure 5A). Forimtamig induced upregulation of activation markers on CD8 and CD4 TILs that was not significantly changed in combinations (Figure 5B; supplemental Figure 5A). Forimtamig enhanced activation of NK cells as measured by CD25 and CD107a expression, which was increased in triple combination with dara and pom (supplemental Figure 5C). We next combined forimtamig with high-dose carfilzomib (carfi) and observed comparable tumor cell killing or T-cell activation (Figure 5C-D; supplemental Figure 5B). To explore depth and durability of response of SoC combinations in vivo, we increased the number of treatment cycles from 4 to 6 followed by a treatment-free interval of 2 weeks (supplemental Figure 5D). Although forimtamig induced regressions at C3, tumor relapse occurred in 50% to 70% of mice (Figure 5E-G; supplemental Figure 5G-I). Although SoC monotherapies did not achieve significant tumor growth inhibition (supplemental Figure 5E), we next tested their potential to improve response to forimtamig. Combination with pom resulted in a 20% enhanced response at C1D4, an increased median PFS (mPFS) and 20% higher probability of PFS at termination (Figure 5E; supplemental Figure 5F-G). Although dara did not improve early response to forimtamig or mPFS, first relapse occurred only 10 days after therapy was stopped (Figure 5F; supplemental Figure 5F,H). In combination with carfi we observed 30% enhanced efficacy at C1D4, an increased mPFS and a 30% high PFS rate at termination (Figure 5G; supplemental Figure 5F,I). We next measured cytokines in serum of mice 48 hours after treatment initiation. Although pom combination increased serum levels of IFN-γ, IL-2, and TNF-α compared with forimtamig alone, dara induced only a moderate increase of TNF-α and there was a slight decrease in systemic cytokine release for the carfi combination (Figure 5H-J).
Combination of forimtamig with SoC agents. (A-D) Total BM cells from 4 (carfi) or 11 (dara and pom) patients with NDMM were cultured in the presence of 1 nM forimtamig, 10 nM daratumumab, 1 μM pomalidomide (48 hours before incubation), 3 nM carfilzomib, or combination of forimtamig with either of the SoC agents for 48 hours, and tumor cell lysis as well as expression of CD69, CD25, CD137, and PD-1 by CD8+ lymphocytes was measured by flow cytometry; tumor cell lysis was calculated by the percentage reduction of CD38+CD138+ double-positive cells in relation to untreated TCB control; and graphs summarizing the mean ± SEM expression and statistical differences against forimtamig monotherapy were determined by 1-way ANOVA with Tukey posttest analysis. ∗P < .05; ∗∗P < .005; ∗∗∗P < .0005; ∗∗∗∗P < .0001. (E-G)Humanized NSG (huNSG) mice were subcutaneously implanted with NCI-H929 tumor cells and when tumors reached 200 mm3 injected once weekly with 0.1 mg/kg forimtamig or combination of forimtamig with 8 mg/kg dara (once weekly, IV), 10 mg/kg pomalidomide (every day, by mouth [po]), or 3 mg/kg carfi (twice weekly, IV). Tumor volume was measured over time using a caliper; treatment was stopped after 6 cycles and mice were monitored for at least 2 additional weeks to check for tumor relapse; each group includes 10 animals and is presented as mean + SEM. (H-J) Serum was harvested from n = 5 animals 48 hours after first forimtamig and 24 hours after first SoC dosing and cytokine levels were measured by bioplex analysis; graphs summarizing the mean ± SEM expression and statistical differences between multiple groups were determined by1e-way ANOVA with Tukey posttest analysis. ∗P < .05; ∗∗P < .005; ∗∗∗P < .0005; ∗∗∗∗P < .0001. hu, human; TNF-α, tumor necrosis factor α.
Combination of forimtamig with SoC agents. (A-D) Total BM cells from 4 (carfi) or 11 (dara and pom) patients with NDMM were cultured in the presence of 1 nM forimtamig, 10 nM daratumumab, 1 μM pomalidomide (48 hours before incubation), 3 nM carfilzomib, or combination of forimtamig with either of the SoC agents for 48 hours, and tumor cell lysis as well as expression of CD69, CD25, CD137, and PD-1 by CD8+ lymphocytes was measured by flow cytometry; tumor cell lysis was calculated by the percentage reduction of CD38+CD138+ double-positive cells in relation to untreated TCB control; and graphs summarizing the mean ± SEM expression and statistical differences against forimtamig monotherapy were determined by 1-way ANOVA with Tukey posttest analysis. ∗P < .05; ∗∗P < .005; ∗∗∗P < .0005; ∗∗∗∗P < .0001. (E-G)Humanized NSG (huNSG) mice were subcutaneously implanted with NCI-H929 tumor cells and when tumors reached 200 mm3 injected once weekly with 0.1 mg/kg forimtamig or combination of forimtamig with 8 mg/kg dara (once weekly, IV), 10 mg/kg pomalidomide (every day, by mouth [po]), or 3 mg/kg carfi (twice weekly, IV). Tumor volume was measured over time using a caliper; treatment was stopped after 6 cycles and mice were monitored for at least 2 additional weeks to check for tumor relapse; each group includes 10 animals and is presented as mean + SEM. (H-J) Serum was harvested from n = 5 animals 48 hours after first forimtamig and 24 hours after first SoC dosing and cytokine levels were measured by bioplex analysis; graphs summarizing the mean ± SEM expression and statistical differences between multiple groups were determined by1e-way ANOVA with Tukey posttest analysis. ∗P < .05; ∗∗P < .005; ∗∗∗P < .0005; ∗∗∗∗P < .0001. hu, human; TNF-α, tumor necrosis factor α.
Forimtamig in combination with a BCMA-directed TCB overcomes tumor escape
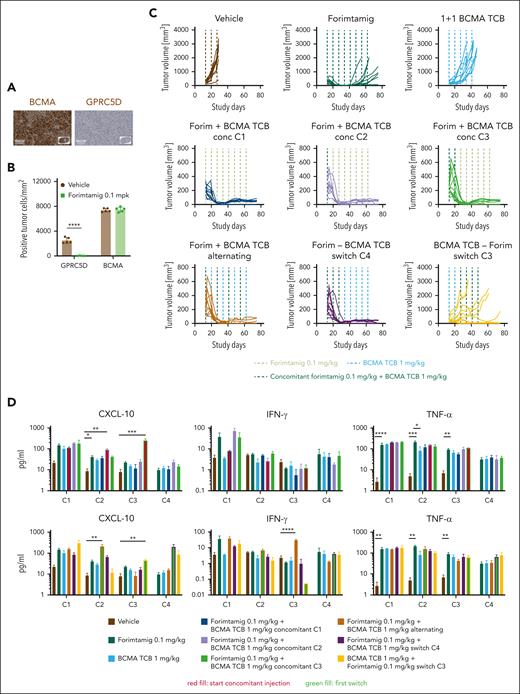
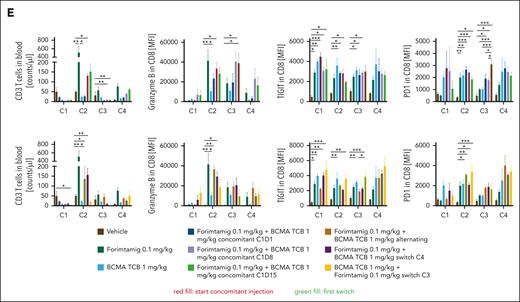
To identify more efficient strategies for relapse prevention, a better understanding of underlying mechanisms is essential. Given that target expression is a determinant of TCB response,16 we quantified GPRC5D in NCI-H929 tumors at baseline and after relapse to forimtamig by immunohistochemistry. All relapsed tumors stained negative for GPRC5D whereas expression of BCMA was not affected (Figure 6A-B). To explore whether simultaneous targeting of BCMA and GPRC5D could improve duration of response, we combined forimtamig with a 1+1 BCMA TCB using concomitant, alternating, or consecutive treatment schedules (supplemental Figure 6A). Forimtamig induced deep responses in all mice at C4 and tumor escape observed in 47% of animals (Figure 6C; supplemental Figure 6B). Notably, 1+1 BCMA TCB treatment induced tumor growth delay during C1-2 but tumors rapidly progressed and mPFS was only slightly increased compared with the control arm. Concomitant injection of forimtamig and 1+1 BCMA TCB at C1, C2, or C3 induced strong and sustained tumor regression resulting with all animals being progression free at study termination. Similar results were obtained when both TCBs were administered in an alternating schedule or when therapy was switched from forimtamig to 1+1 BCMA TCB at C4. Switching from 1+1 BCMA TCB to forimtamig at C3 did not significantly increase mPFS but enhanced PFS rate by 40% (Figure 6C; supplemental Figure 6C). Interestingly, tumor load of BCMA TCB-exposed animals at C3 correlated with durability of response to forimtamig (supplemental Figure 6D). Combination of forimtamig and 1+1 BCMA TCB did not significantly exacerbate cytokine release compared with respective monotherapies (Figure 6D). We observed increased levels of CXCL-10 when 1+1 BCMA TCB was added to forimtamig at C2 and C3 or when the treatment was switched at C2 or C4 (Figure 6D). Concomitant injection at C1 resulted in IFN-γ levels equivalent to 1+1 BCMA TCB but much lower than forimtamig (Figure 6D). We observed signs of tolerance as indicated by reduced cytokine release upon first dosing in TCB pre-exposed animals (Figure 6D). We observed clear trends toward increased GZB expression by CD8 T cells when combination was started at C2 and C3 and higher levels of TIGIT and PD-1 across different time points when a second TCB was added (Figure 6E). Forimtamig induced a shift from naïve to effector memory T cells in the blood and we observed the same kinetics in combination with BCMA TCB (supplemental Figure 6E). The expansion of circulating T cells induced by forimtamig at C2, C3 and C4 was hampered by addition of 1+1 BCMA TCB especially at C1 but less pronounced when TCBs were alternated. There was a persistence of GZB-positive circulating CD8 T cells during C1 to C2 upon concomitant injection at C2 and C3 (Figure 6E).
Combination of forimtamig with BCMA TCB. (A-B) BCMA and GPRC5D expression was analyzed in ∼1000 mm3 NCI-H929 tumors that relapsed upon forimtamig treatment at 0.1 mg/kg in experiment 5F by immunohistochemistry and quantified using visiopharm (n = 5 animals per group); control tumors were matched in tumor size but were removed from the study at earlier time points; data are shown as mean ± SEM expression and statistical differences between multiple groups were determined using Student t tests. ∗P < .05; ∗∗P < .005; ∗∗∗P < .0005. (C) huNSG mice were subcutaneously implanted with NCI-H929 tumor cells and when tumors reached 200 to 250 mm3 injected once weekly with forimtamig at 0.1 mg/kg or 1+1 BCMA TCB at 1 mg/kg or the combination of both TCBs using a concomitant schedule starting at C1, C2, or C3; an alternating schedule; or different switch schedules in which 1 TCB was dosed after stopping the second TCB; treatment was stopped after 8 injections and tumor escape was monitored for 10 additional days; tumors growth was monitored twice weekly using caliper measurements. (D) Serum was harvested from n = 5 animals 48 hours after C1, C2, C3, and C4 dosing and cytokine levels were measured by bioplex analysis; and graphs summarizing the mean ± SEM expression and statistical differences between multiple groups were determined by 1-way ANOVA with Tukey posttest analysis. ∗P < .05; ∗∗P < .005; ∗∗∗P < .0005. (E) Blood was collected 48 hours after C1, C2, C3, and C4 TCB dosing and human CD3+ T cells were quantified and characterized using spectral flow cytometry; and graphs summarizing the mean ± SEM expression and statistical differences between multiple groups were determined by 1-way ANOVA with Tukey posttest analysis. ∗P < .05; ∗∗P < .005; ∗∗∗P < .0005; ∗∗∗∗P < .0001. TNF-α, tumor necrosis factor α.
Combination of forimtamig with BCMA TCB. (A-B) BCMA and GPRC5D expression was analyzed in ∼1000 mm3 NCI-H929 tumors that relapsed upon forimtamig treatment at 0.1 mg/kg in experiment 5F by immunohistochemistry and quantified using visiopharm (n = 5 animals per group); control tumors were matched in tumor size but were removed from the study at earlier time points; data are shown as mean ± SEM expression and statistical differences between multiple groups were determined using Student t tests. ∗P < .05; ∗∗P < .005; ∗∗∗P < .0005. (C) huNSG mice were subcutaneously implanted with NCI-H929 tumor cells and when tumors reached 200 to 250 mm3 injected once weekly with forimtamig at 0.1 mg/kg or 1+1 BCMA TCB at 1 mg/kg or the combination of both TCBs using a concomitant schedule starting at C1, C2, or C3; an alternating schedule; or different switch schedules in which 1 TCB was dosed after stopping the second TCB; treatment was stopped after 8 injections and tumor escape was monitored for 10 additional days; tumors growth was monitored twice weekly using caliper measurements. (D) Serum was harvested from n = 5 animals 48 hours after C1, C2, C3, and C4 dosing and cytokine levels were measured by bioplex analysis; and graphs summarizing the mean ± SEM expression and statistical differences between multiple groups were determined by 1-way ANOVA with Tukey posttest analysis. ∗P < .05; ∗∗P < .005; ∗∗∗P < .0005. (E) Blood was collected 48 hours after C1, C2, C3, and C4 TCB dosing and human CD3+ T cells were quantified and characterized using spectral flow cytometry; and graphs summarizing the mean ± SEM expression and statistical differences between multiple groups were determined by 1-way ANOVA with Tukey posttest analysis. ∗P < .05; ∗∗P < .005; ∗∗∗P < .0005; ∗∗∗∗P < .0001. TNF-α, tumor necrosis factor α.
Novel combinations maximize efficacy and allow lowering forimtamig target dose
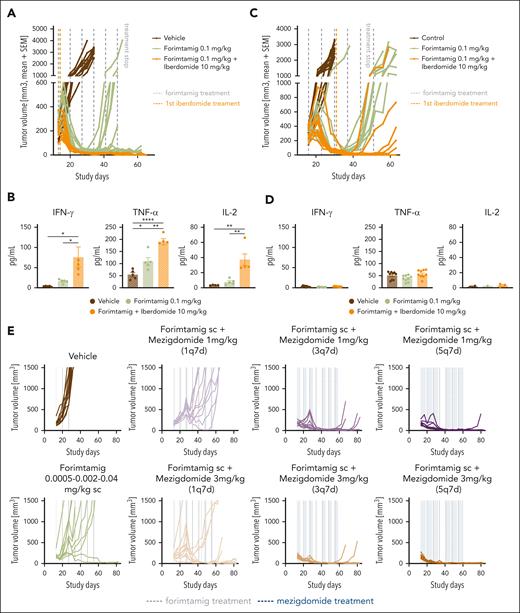
Antigen escape reported in TCB-exposed patients with MM potentially limits the durability of TCB-TCB combinations.7,16,29 We next tested whether enhanced antitumor and immunostimulatory activity of CELMoDs could represent an antigen-independent and novel combination strategy.30,31 We first tested forimtamig in combination with iberdomide in a fixed duration in vivo experiment starting to combine at C1. All mice treated with the combination of forimtamig and iberdomide were considered progression free at the end of the observation period whereas monotherapies failed to control tumor growth over time (Figure 7A; supplemental Figure 7B-D). Increased efficacy was correlated with a significant increase in cytokine production 48 hours after forimtamig dosing (Figure 7B). Later administration of iberdomide (C3) resulted in shorter mPFS and 40% lower PFS at termination but was associated with decreased levels of cytokines in response to combination (Figure 7C-D; supplemental Figure 7C-D).
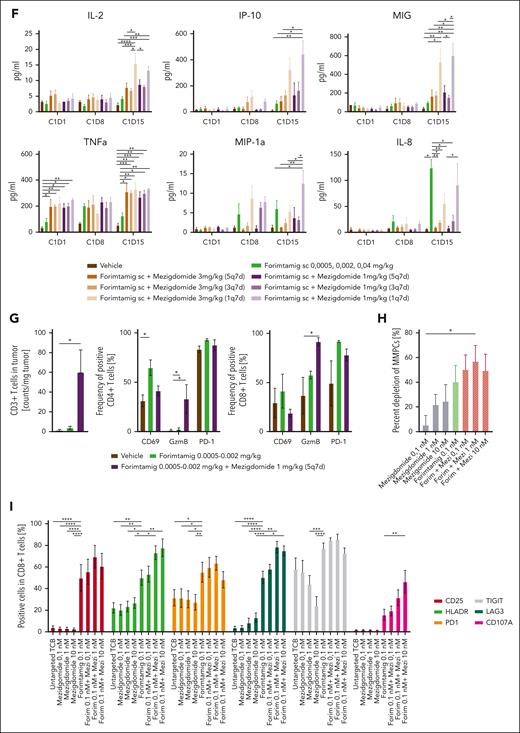
Combination of forimtamig with CELMoDs. (A,C) Humanized NSG (huNSG) mice were subcutaneously implanted with NCI-H929 tumor cells and when tumors reached 200 mm3 injected once weekly IV with forimtamig at 0.1 mg/kg or combination with oral dosing of iberdomide at 10 mg/kg 5 times weekly (5q7d) starting at C1D2 or C3D2; tumor volume of individual mice was measured over time using a caliper; treatment was stopped after 7 forimtamig injections and mice were monitored for at least 2 additional weeks to check for tumor relapse; each group included 10 animals. (B,D) Serum was harvested from n = 5 animals 48 hours after C1 and C3 forimtamig dosing and 24 hours after iberdomide dosing and cytokine levels were measured by bioplex analysis; and graphs summarizing the mean ± SEM expression and statistical differences between multiple groups were determined by 1-way ANOVA with Tukey posttest analysis. ∗P < .05; ∗∗P < .005; ∗∗∗P < .0005. (E) huNSG mice were subcutaneously implanted with NCI-H929 tumor cells and, when tumors reached 200 mm3, injected once weekly with step-up doses of forimtamig at 0.0005, 0.002, and 0.04 mg/kg or combination with oral administration of 1 mg/kg or 3 mg/kg mezigdomide once weekly (1q7d), thrice weekly (3q7d), or 5 times weekly (5q7d). Tumor volume was measured over time using a caliper; treatment was stopped after 7 forimtamig injections and mice were monitored for at least 2 additional weeks to check for tumor relapse; each group included 10 animals. (F) Serum was harvested from n = 5 animals 48 hours after C1D1, C1D8, and C1D15 forimtamig dosing and 24 hours after mezigdomide dosing and cytokine levels were measured by bioplex analysis; graphs summarizing the mean ± SEM expression and statistical differences between multiple groups were determined by 1-way ANOVA with Tukey posttest analysis. ∗P < .05; ∗∗P < .005; ∗∗∗P < .0005. (G) NCI-H929 tumors were isolated from 3 animals of groups A, B, and F (supplemental Figure 7A) 48 hours after 0.002 mg/kg SUD and intratumoral T-cell number and phenotype was analyzed by flow cytometry; graphs summarizing the mean ± SEM expression and statistical differences between multiple groups were determined by 1-way ANOVA with Tukey posttest analysis. ∗P < .05; ∗∗P < .005; ∗∗∗P < .0005. (H-I) Total BM cells from 6 patients with NDMM were cultured in the presence of 0.1 nM forimtamig, 0.1 to 10 nM mezigdomide, or the combination for 96 hours and tumor cell lysis and expression of CD69, CD25, HLADR, CD107a, LAG-3, and PD-1 by CD8 lymphocytes was measured by flow cytometry; untreated and untargeted-TCB treated samples served as reference controls; graphs summarizing the mean ± SEM expression and statistical differences between multiple groups were determined by 2-way ANOVA with Tukey posttest analysis; and statistical analysis for activation markers was referenced against forimtamig monotherapy. ∗P < .05; ∗∗P < .005; ∗∗∗P < .0005; ∗∗∗∗P < .0001. MIG, monokine induced by gamma-interferon; MIP-1a, macrophage inflammatory protein-1 alpha; TNF-α, tumor necrosis factor α.
Combination of forimtamig with CELMoDs. (A,C) Humanized NSG (huNSG) mice were subcutaneously implanted with NCI-H929 tumor cells and when tumors reached 200 mm3 injected once weekly IV with forimtamig at 0.1 mg/kg or combination with oral dosing of iberdomide at 10 mg/kg 5 times weekly (5q7d) starting at C1D2 or C3D2; tumor volume of individual mice was measured over time using a caliper; treatment was stopped after 7 forimtamig injections and mice were monitored for at least 2 additional weeks to check for tumor relapse; each group included 10 animals. (B,D) Serum was harvested from n = 5 animals 48 hours after C1 and C3 forimtamig dosing and 24 hours after iberdomide dosing and cytokine levels were measured by bioplex analysis; and graphs summarizing the mean ± SEM expression and statistical differences between multiple groups were determined by 1-way ANOVA with Tukey posttest analysis. ∗P < .05; ∗∗P < .005; ∗∗∗P < .0005. (E) huNSG mice were subcutaneously implanted with NCI-H929 tumor cells and, when tumors reached 200 mm3, injected once weekly with step-up doses of forimtamig at 0.0005, 0.002, and 0.04 mg/kg or combination with oral administration of 1 mg/kg or 3 mg/kg mezigdomide once weekly (1q7d), thrice weekly (3q7d), or 5 times weekly (5q7d). Tumor volume was measured over time using a caliper; treatment was stopped after 7 forimtamig injections and mice were monitored for at least 2 additional weeks to check for tumor relapse; each group included 10 animals. (F) Serum was harvested from n = 5 animals 48 hours after C1D1, C1D8, and C1D15 forimtamig dosing and 24 hours after mezigdomide dosing and cytokine levels were measured by bioplex analysis; graphs summarizing the mean ± SEM expression and statistical differences between multiple groups were determined by 1-way ANOVA with Tukey posttest analysis. ∗P < .05; ∗∗P < .005; ∗∗∗P < .0005. (G) NCI-H929 tumors were isolated from 3 animals of groups A, B, and F (supplemental Figure 7A) 48 hours after 0.002 mg/kg SUD and intratumoral T-cell number and phenotype was analyzed by flow cytometry; graphs summarizing the mean ± SEM expression and statistical differences between multiple groups were determined by 1-way ANOVA with Tukey posttest analysis. ∗P < .05; ∗∗P < .005; ∗∗∗P < .0005. (H-I) Total BM cells from 6 patients with NDMM were cultured in the presence of 0.1 nM forimtamig, 0.1 to 10 nM mezigdomide, or the combination for 96 hours and tumor cell lysis and expression of CD69, CD25, HLADR, CD107a, LAG-3, and PD-1 by CD8 lymphocytes was measured by flow cytometry; untreated and untargeted-TCB treated samples served as reference controls; graphs summarizing the mean ± SEM expression and statistical differences between multiple groups were determined by 2-way ANOVA with Tukey posttest analysis; and statistical analysis for activation markers was referenced against forimtamig monotherapy. ∗P < .05; ∗∗P < .005; ∗∗∗P < .0005; ∗∗∗∗P < .0001. MIG, monokine induced by gamma-interferon; MIP-1a, macrophage inflammatory protein-1 alpha; TNF-α, tumor necrosis factor α.
To maximize efficacy while limiting cytokine release, we introduced subcutaneous SUD at 0.0005, 0.002, and 0.04 mg/kg for forimtamig and combined with mezigdomide. Dose levels were calculated to match the clinically achieved relevant exposure of forimtamig in phase 1 (average plasma concentration (Cavg), data not shown). Mezigdomide dosing was started at C1D2 at 1 or 3 mg/kg using a once weekly, thrice weekly, or 5 times weekly schedule and a treatment-free interval after C2 (supplemental Figure 7A). Tumor growth delay was the best overall response observed for mezigdomide (3 mg/kg, 5 times weekly) (supplemental Figure 7B). Forimtamig induced transient tumor regressions after C1D1 and C1D15 with 80% of mice showed progressive disease at the end of C1. In contrast, potent tumor growth inhibition with increased mPFS and 90% (5 times weekly) and 60% (thrice weekly) progression-free animals at termination were observed when forimtamig was combined with 1 mg/kg mezigdomide. A single administration of mezigdomide at 1 mg/kg increased mPFS by only 9 days and failed to significantly improve response (Figure 7E; supplemental Figure 7F-G). Combination with high-dose mezigdomide led to rapid onset of tumor regression during C1 correlating with 80% or even 100% PFS rate when mezigdomide was administered thrice weekly or 5 times weekly, respectively. Even when mezigdomide was administered once per week, mPFS was increased by 37 days and terminal PFS by 20% (Figure 7E; supplemental Figure 7E,G).
We next measured systemic cytokine release 48 hours after each forimtamig SUD and detected a maximal 2.5-fold increase in combination with 1 and 3 mg/kg mezigdomide compared with forimtamig. Release of IL-2, CXCL-10, and monokine induced by gamma-interferon (MIG) induced by target dose administration of forimtamig was boosted most significantly by once weekly dosing of mezigdomide. Mezigdomide combination induced significantly increased levels of TNF-α at C1D1 and C1D15 irrespective of the dose and schedule. Serum levels of monocyte-associated cytokines macrophage inflammatory protein-1 alpha and IL-8 tend to decrease with higher and more frequent dosing of mezigdomide (Figure 7F). In a next step, we analyzed circulating immune cells in the blood of mice before C4 administration of forimtamig (48-120 hours after last mezigdomide dosing). We observed correlations of more frequent dosing of mezigdomide with reduced number of circulating B cells and increased frequency of PD-1, LAG-3, and TIGIT-positive CD4 and CD8 T cells (supplemental Figure 7H). To improve mechanistic understanding of synergistic antitumor effects, we analyzed the number and phenotype of human T cells in the tumor tissue of 3 mice treated with forimtamig or the combination with 1 mg/kg mezigdomide (5 times weekly schedule) at C1D10. We detected a significantly higher number of human T cells and a higher proportion of GZB-positive CD8 and CD4 T cells in tumors of mice treated with the combination of both drugs (Figure 7G).
We validated our findings in fresh BM aspirates from patients with NDMM using a fixed dose of forimtamig and a dose range of mezigdomide. Despite using 10-fold lower concentration than SoC combinations, forimtamig as a single agent induced lysis of 40% tumor cells after 96 hours. We also observed dose-dependent efficacy of mezigdomide achieving maximum tumor cell lysis of ∼25% at 10 nM. Efficacy was further increased for the combination with mezigdomide at all dose levels tested, achieving maximum tumor lysis of ∼60% at 1 nM (Figure 7H). T-cell activation induced by forimtamig was further increased by the combination with mezigdomide as indicated by an increase of HLA-DR-, CD25-, and CD107a-positive cells and an increase of PD-1-, TIGIT-, and LAG-3-positive TILs. Although there was no significant impact of mezigdomide monotherapy on TIL activation, we observed a dose-dependent decrease of TIGIT on both CD4 and CD8 T-cell subsets and an increase of LAG-3 on both T-cell subsets (Figure 7I; supplemental Figure 7I).
Discussion
Although recent advances have been made in the treatment of MM with the introduction of proteasome inhibitors (PIs), immunomodulatory drugs, and CD38-targeting compounds, prognosis for patients with extensive treatment history, high-risk cytogenetics, and EMD is poor, and therapies benefiting a broader patient population are urgently needed.32-35
Forimtamig exhibits higher potency against MMPCs even in the presence of low GPRC5D expression and clears MM cells in the BM after a single injection suggesting the potential to achieve deeper responses than approved TCBs early at treatment and at lower target doses.36-41 In an ongoing phase 1 trial, forimtamig achieves ORR and complete response rates similar to talquetamab but at threefold to 180-fold lower target dose with 30% of patients achieving early minimal residual disease (MRD) negativity of 10−5 at C2D1 and independent of target expression level.13,42 Further dose optimization will potentially allow to maintain efficacy while reducing the risk of skin and mucosal toxicities associated with GPRC5D targeted TCBs in MM. Our data support targeting GPRC5D in MM given that protein expression was high across patient subsets with high medical need and that we observed superior killing when targeting GPRC5D compared with BCMA using the same 2+1 antibody format.
We observed a clear correlation between tumor load and pharmacodynamic effects induced by forimtamig supporting extended treatment intervals and suggesting 72 hours to represent an ideal time point for biomarker assessment in the blood and the tumor tissue. Almost 60% of patients with MM treated with TCBs experience cytokine release syndrome (CRS) especially during early treatment cycles.6 We provide important evidence that introduction of SUD provides an efficient CRS mitigation strategy even for a highly potent molecule such as forimtamig.6,43 Our data underline the potential of forimtamig to provide benefit to patients with MM as a monotherapy and underpin the value of using stem cell engrafted humanized NSG (huNSG) mouse models to test clinical lead molecules for safety and efficacy assessment.15,44
Moreover, forimtamig was shown to represent a high-potential combination partner for SoC agents in MM. Synergistic antitumoral and natural killer stimulatory effects suggest a benefit of dara combinations in patients with high tumor burden and a high risk of developing CRS. Initial results from phase 1/2 TRIMM-2 and MajesTEC-2 trials confirm a favorable safety and efficacy profile of dara in combination with talquetamab or teclistamab.45,46 The broad immunomodulatory effects of pom could help sustain T-cell responses in patients that passed the critical CRS window. In this context, promising efficacy and manageable safety have been reported from the MonumenTAL-2 trial combining talquetamab with pom.47 PIs have been considered suboptimal combination partners for T-cell therapies given that detrimental effects on T-cell responses have been reported for 1+1 GPRC5D-TCBs exhibiting lower potency.21 Interestingly, carfi achieved a favorable efficacy and safety profile compared with anti-CD38 and immunomodulatory drugs. Considering the potential of PIs to induce immunogenic cells enhancing major histocompatibility complex class I–dependent T-cell responses, we identified PIs as promising combination partners for highly potent TCBs such as forimtamig.48,49 Although our results provide only limited mechanistic insights, we provide preclinical evidence that combining with SoC agents will potentially allow forimtamig to move to earlier lines of therapy to induce deeper responses early on and increase the time in remission.
Target modulation promotes relapse to CAR T-cell and TCB monotherapies underscoring the importance of optimized combination strategies.10,11,25 Biomarker data from phase 1 study NCT04557150 support targeting more than 1 MM surface marker to promote rapid and deeper tumor clearance.50 Here we provide preclinical evidence that a combination of forimtamig with a 1+1 BCMA TCB can prevent tumor relapse and induce long-lasting responses although we acknowledge the need for even longer follow-ups. Additional experiments with a longer follow-up are needed. Lower ORR rates have been reported in patient subsets exposed to TCBs,51 and strong antitumoral responses we observed upon consecutive dosing of TCBs support the findings of T-cell fitness correlating with response to TCBs in MM.49 Our TCB combination data collectively suggest that coadministration of 2 TCBs provides no benefit over alternating or consecutive dosing as long as the higher potent molecule is used at early cycles. Cytokine release data suggest that combination of 2 TCBs does not induce a higher risk of CRS, which potentially allows combining 2 potent TCB molecules in consecutive order. These preclinical findings are supported by initial results from BCMA TCB and GPRC5D-TCB combination trials reporting high ORR rates even in patients with EMD but also highlight the need for optimal balance between efficacy and safety.34 Although BCMA TCB combination data look encouraging, the observation of tumor relapse driven by BCMA target modulation and increased risk of high-grade infections highlight the need for identifying target independent combination partners.52
Our results highlight that combination of forimtamig with CELMoDs during early treatment cycles can prevent tumor escape and substantiate recent preclinical data reporting enhanced efficacy in combination with alnuctamab.31,53,54 Our data confirm a dual mode of action of mezigdomide as we observed tumor cell killing of autologous MMPCs in the absence of TIL activation and boosted T-cell response in combination with forimtamig. Mezigdomide, when dosed at least 3 times a week, was identified as an alternative combination partner for prevention of relapse to forimtamig. Considering the reported on-target off-tumor toxicities related to GPRC5D-TCB treatment, the significant increase in PFS observed for low-dose forimtamig and intermittent dosing of mezigdomide could enable a broad therapeutic window for this novel combination although mechanistic understanding of tumor escape will be critical. This assumption is underlined by only moderate increase in T-cell cytokines and a decrease of monocyte-derived cytokines observed for the most efficacious regimens.30,54 The observed trend toward higher expression of exhaustion markers such as PD-1 and LAG-3 suggests a potential benefit of testing triple combinations of forimtamig, CELMoDs, and checkpoint inhibitors.55 Although more frequent dosing of mezigdomide was correlated with better PFS, bystander effects such as reduced B-cell numbers are to be monitored. Although our data confirm forimtamig to represent an attractive combination partner to boost efficacy against MMPCs, more advanced preclinical models will be required explore impact of combinations on on-target off-tumor toxicities as well as infections.
In summary, we provide evidence for the best-in-class potential of the 2+1 TCB forimtamig for the treatment of MM, both as a monotherapy and in combination with other agents supporting the currently undergoing phase 1 clinical testing in patients with RRMM.
Acknowledgments
The authors thank Martin Weisser, Wolfgang Jacob, Natalie Dimier, Shannon Moore, Cedric Dos-Santos, and Vallari Shah for fruitful discussions and valuable advice; Petra Ulrich, Daniela Geiss, Jennifer Stechele, Petra Falkner, Naailah Roheemun, and Monika Friedrich for technical assistance; Sophie Huber from leadXproAG for the GPRC5D purification; and Yunje Cho for sharing the GPRC5D coordinates with us.
Authorship
Contribution: J.E. designed experiments, analyzed, and interpreted data and wrote the manuscript; A.Z., T.F., R.R., C.H., T.P., G.H., L.K., S. Lechner, A.C., A.-M.B., C. Kirstenpfad, I.D., T.K., I.L., F.C., M.M., T.C., G.F., C.D., S.D., R.F., R.A., L.M., C.G., S. Leclair, W.X., and M.B. designed experiments and analyzed and interpreted data; L. Blanco, S. Lorenz, C.B., Q.D., F.O., F.B., C.G., S.D., M.K., L. Bernasconi, N.C., S.K., S.G., and R.R. performed experiments and collected data; J.A. and C.B. collected and interpreted data; and F.P., B.P., C. Klein, and P.U. interpreted data and supervised the study.
Conflict-of-interest disclosure: J.E., T.F., R.R., C.H., T.P., G.H., R.F., S.G., R.A., C. Kirstenpfad, L.K., S. Lechner, A.B., I.D., A.-M.B., J.A., I.L., F.C., S. Leclair, T.C., G.F., C.D., L.M., C.B., Q.D., F.O., F.B., C.G., S.D., T.K., M.K., M.B., S. Lechner, and P.U. are employees of Roche. C.K., A.C., M.M., L. Bernasconi, and W.X. are former employees of Roche. S.D., F.B., C. Klein, I.D., T.F., J.A., L.K., C.H., F.C., M.B., and M.M. hold stock options of F. Hoffmann-La Roche. J.E., T.F., M.B., S.L., T.C., A.C., A.B., A.-M.B., I.D., F.B., L.K., F.C., G.F., C.G., S.D., C. Kirstenpfad, T.K., C.H., M.M., L.B., S. Leclair, W.X., C. Klein, and P.U. declare patents with Roche. The remaining authors declare no competing financial interests.
Correspondence: Jan Eckmann, Roche, Nonnenwald 2 Penzberg, Germany 82377; email: jan.eckmann@roche.com; and Pablo Umaña, Roche Innovation Center Zurich, Roche Glycart AG, Wagistrasse 10, 8952 Schlieren, Switzerland; email: pablo.umana@roche.com.
References
Author notes
C. Klein and P.U. are joint last authors.
Data are available on request from the corresponding authors, Jan Eckmann (jan.eckmann@roche.com) and Pablo Umaña (pablo.umana@roche.com).
The online version of this article contains a data supplement.
There is a Blood Commentary on this article in this issue.
The publication costs of this article were defrayed in part by page charge payment. Therefore, and solely to indicate this fact, this article is hereby marked “advertisement” in accordance with 18 USC section 1734.


![Combination of forimtamig with SoC agents. (A-D) Total BM cells from 4 (carfi) or 11 (dara and pom) patients with NDMM were cultured in the presence of 1 nM forimtamig, 10 nM daratumumab, 1 μM pomalidomide (48 hours before incubation), 3 nM carfilzomib, or combination of forimtamig with either of the SoC agents for 48 hours, and tumor cell lysis as well as expression of CD69, CD25, CD137, and PD-1 by CD8+ lymphocytes was measured by flow cytometry; tumor cell lysis was calculated by the percentage reduction of CD38+CD138+ double-positive cells in relation to untreated TCB control; and graphs summarizing the mean ± SEM expression and statistical differences against forimtamig monotherapy were determined by 1-way ANOVA with Tukey posttest analysis. ∗P < .05; ∗∗P < .005; ∗∗∗P < .0005; ∗∗∗∗P < .0001. (E-G)Humanized NSG (huNSG) mice were subcutaneously implanted with NCI-H929 tumor cells and when tumors reached 200 mm3 injected once weekly with 0.1 mg/kg forimtamig or combination of forimtamig with 8 mg/kg dara (once weekly, IV), 10 mg/kg pomalidomide (every day, by mouth [po]), or 3 mg/kg carfi (twice weekly, IV). Tumor volume was measured over time using a caliper; treatment was stopped after 6 cycles and mice were monitored for at least 2 additional weeks to check for tumor relapse; each group includes 10 animals and is presented as mean + SEM. (H-J) Serum was harvested from n = 5 animals 48 hours after first forimtamig and 24 hours after first SoC dosing and cytokine levels were measured by bioplex analysis; graphs summarizing the mean ± SEM expression and statistical differences between multiple groups were determined by1e-way ANOVA with Tukey posttest analysis. ∗P < .05; ∗∗P < .005; ∗∗∗P < .0005; ∗∗∗∗P < .0001. hu, human; TNF-α, tumor necrosis factor α.](https://ash.silverchair-cdn.com/ash/content_public/journal/blood/145/2/10.1182_blood.2024025987/2/m_blood_bld-2024-025987-gr5.jpeg?Expires=1768779522&Signature=QrcY3H27jq8bNy~I0PniWs3LnnYTHdMM8DydRO4K6VBvgJRSor-KKOD~MWYaaRba9VUTPJCTaWt~pU-A2ISRQutNxwqkv4M6cLT3mNT91sQlhEpI1t0dtn84aaUuyovSRkRUKgWE-KZZf33K23-KZEfQ4Ia5LWjWvB1dlik7COPqom8aKZToKOAuDIZ96ZmOCuZFiAHAlWD8K4LUtmUcRVp7-EjFC~pbkTjHSXtQe~KUHOmnqBiH7VHzPIHoNG48ODo7ZQP3ex7RnREQTSpFk82EAK2VtGM4X9bH3W8ShBaq47nx-T1JITsOLup-u4x2~L03d6ItMH7YoZOYFkU0sA__&Key-Pair-Id=APKAIE5G5CRDK6RD3PGA)
This feature is available to Subscribers Only
Sign In or Create an Account Close Modal