Key Points
Inhibition of γ-secretase–mediated shedding of BCMA from the surface of myeloma tumor cells may improve BCMA-targeted therapies.
Single-cell analysis reveals transcriptional and epigenetic changes in the immune microenvironment after γ-secretase inhibition.
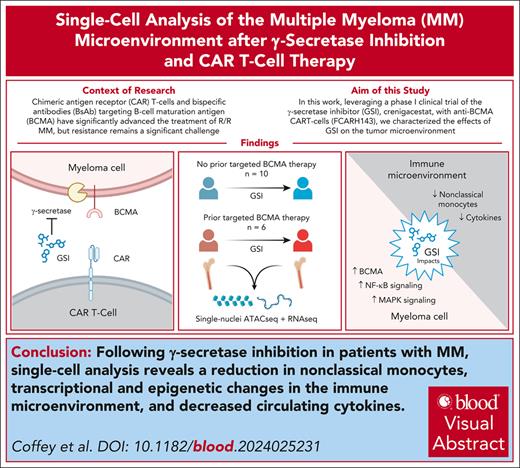
Visual Abstract
Chimeric antigen receptor (CAR) T cells and bispecific antibodies targeting B-cell maturation antigen (BCMA) have significantly advanced the treatment of relapsed and refractory multiple myeloma. Resistance to BCMA-targeting therapies, nonetheless, remains a significant challenge. BCMA shedding by γ-secretase is a known resistance mechanism, and preclinical studies suggest that inhibition may improve anti-BCMA therapy. Leveraging a phase 1 clinical trial of the γ-secretase inhibitor (GSI), crenigacestat, with anti-BCMA CAR T cells (FCARH143), we used single-nuclei RNA sequencing and assay for transposase-accessible chromatin sequencing to characterize the effects of GSI on the tumor microenvironment. The most significant impacts of GSI involved effects on monocytes, which are known to promote tumor growth. In addition to observing a reduction in the frequency of nonclassical monocytes, we also detected significant changes in gene expression, chromatin accessibility, and inferred cell-cell interactions after exposure to GSI. Although many genes with altered expression are associated with γ-secretase–dependent signaling, such as Notch, other pathways were affected, indicating GSI has far-reaching effects. Finally, we detected monoallelic deletion of the BCMA locus in some patients with prior exposure to anti-BCMA therapy, which significantly correlated with reduced progression-free survival (PFS; median PFS, 57 vs 861 days). GSIs are being explored in combination with the full spectrum of BCMA-targeting agents, and our results reveal widespread effects of GSI on both tumor and immune cell populations, providing insight into mechanisms for enhancing BCMA-directed therapies.
Introduction
Chimeric antigen receptor (CAR) T cells and bispecific antibodies targeting B-cell maturation antigen (BCMA) have significantly improved progression-free survival (PFS) in patients with relapsed or refractory multiple myeloma (MM). Since 2020, four therapeutics targeting BCMA have been approved by the US Food and Drug Administration, including idecabtagene vicleucel, ciltacabtagene autoleucel, teclistamab, and elranatamab.1-4 Recently, BCMA-targeting therapeutics have also been approved for use after 1 or 2 prior lines of therapy. Despite these advances, treatment resistance and disease progression remain a substantial challenge.
BCMA is a member of the tumor necrosis factor receptor (TNFR) superfamily encoded by the gene TNFR superfamily member 17 (TNFRSF17) on chromosome 16p13.13. As a transmembrane-bound protein, BCMA expression is primarily restricted to normal and malignant plasma cells, making it an ideal target for the treatment of MM.5 BCMA is essential for the long-term survival of normal plasma cells and is activated by its ligands BAFF (B-cell activating factor) and APRIL (a proliferation-inducing ligand).6,7 Activation of BCMA leads to the induction of protein kinase B (AKT), MAPK, and nuclear factor κB (NF-κB) signaling cascades as well as the enhanced expression of genes critical for survival, growth, adhesion, osteoclast activation, angiogenesis, metastasis, and immunosuppression.8
The activity of BCMA is regulated by the enzymatic cleavage of its extracellular domain by γ-secretase, a large heterotetrameric transmembrane protein best characterized in the processing of amyloid precursor protein in Alzheimer disease and Notch signaling.9 Shedding of BCMA from the surface of plasma cells results in a soluble form that is readily detectable in the blood, with increased levels in patients with MM.10 Soluble BCMA (sBCMA) is capable of binding to its ligand APRIL but not BAFF, thereby preventing receptor activation and reducing downstream NF-κB activation in plasma cells.9
γ-Secretase activity may reduce the effectiveness of BCMA-directed therapy in MM. In vitro studies revealed increased cytokine release from anti-BCMA CAR T cells when exposed to MM tumor cells with higher levels of BCMA expression.11 Additionally, sBCMA has been shown to bind CAR T cells and reduce their lytic activity to MM cell lines. These effects appear to be abolished by inhibiting γ-secretase activity, improving anti-BCMA CAR T cells’ effectiveness in murine models.11
Based on these findings, a first-in-human phase 1 clinical trial was conducted to investigate the oral γ-secretase inhibitor (GSI), crenigacestat, combined with fully humanized anti-BCMA CAR T-cell therapy (FCARH143) in 18 patients with relapsed or refractory MM, including 7 with prior exposure to BCMA-targeted treatment (NCT03502577). In this study, crenigacestat increased plasma cell BCMA surface density, reduced sBCMA levels, and was associated with excellent patient outcomes when combined with CAR T-cell therapy, with median PFS and overall survival of 11 and 42 months for all patients, respectively, and 29 and 42 months for patients naïve to prior BCMA-targeting agents.12
Leveraging multimodal single-cell analysis, this study aimed to investigate the specific effects of GSI on the bone marrow microenvironment, including the tumor and immune cell populations, in patients enrolled in the prior phase 1 clinical trial. Because γ-secretase regulates a wide range of cellular events and has >90 substrates, including half of the human receptor tyrosine kinases, we hypothesized the effects of the GSI may extend beyond those related to BCMA signaling.13-15 With 12 ongoing studies evaluating GSI in combination with other BCMA-directed therapies or as a single agent in patients with MM, the relevance of our findings extends beyond the outcomes of the clinical trial from which the samples interrogated here were obtained.
Methods
Study population and sample processing
The study was approved by the Fred Hutchinson Cancer Center Institutional Review Board. Informed consent was obtained in accordance with the Declaration of Helsinki and the International Conference on Harmonization Guidelines for Good Clinical Practice. Bone marrow aspirates were obtained from 16 participants enrolled in a phase 1 clinical trial investigating GSI (crenigacestat) in combination with anti-BCMA CAR T cells (FCARH143).12 Of these, 1 participant received only the GSI and did not receive the CAR T-cell infusion due to disease progression. Samples were collected at screening and after GSI administered orally every 48 hours for 3 doses as a monotherapy (run-in stage). Per trial design, the GSI was restarted concurrently with the FCARH143 infusion on day 1 (a median of 19 days from run-in [range, 11-29]). Bone marrow aspirates were collected in EDTA tubes, and mononuclear cells were isolated by Ficoll-Paque gradient centrifugation, suspended in 90% fetal bovine serum (FBS) and 10% dimethyl sulfoxide, and cryopreserved in liquid nitrogen until analysis. The bone marrow mononuclear cells (BMMCs) were cryopreserved at a median of 167 minutes from the time of bone marrow aspiration (range, 121-230) and stored in liquid nitrogen for a median of 43 months (range, 23-54) before analysis.
Multiome library preparation and next-generation sequencing
Samples were analyzed by single-nuclei RNA sequencing (snRNA-seq) coupled with single-nuclei assay for transposase-accessible chromatin sequencing (snATAC-seq) across 5 separate batches, with paired pretreatment and posttreatment samples from the same patient consistently included within the same batch to minimize batch effects and ensure equal technical variation. Cryopreserved BMMCs were thawed in a 37°C water bath for 2 minutes and transferred to a 15-mL tube containing 10 mL of RPMI supplemented with 10% FBS. After centrifugation at 400g for 7 minutes, the cells were resuspended in 1× phosphate-buffered saline with 0.04% bovine serum albumin and counted using a Nexcelom K2 Cellometer. Dead cells and granulocytes were removed using Miltenyi dead cell removal beads (130-090-101) and CD66abce microbeads (granulocyte depletion kit 130-092-393), respectively.
Nuclei were isolated according to the 10× Genomics protocol (CG000365 Rev C), and library preparation was performed using the Chromium Next GEM Single Cell Multiome ATAC + Gene Expression Kit, following the manufacturer’s instructions. Ribosomal, mitochondrial, and nontranscriptomic fragments were depleted using the Jumpcode Genomics CRISPRclean Single Cell RNA Boost Kit (Human-KIT1018).
Library quality was assessed with a Tapestation 4200 (Agilent Technologies) and quantified using a Qubit Flex (Invitrogen). Finally, the ATAC-seq and gene expression libraries were sequenced on a NovaSeq 6000 (Illumina), targeting 250 million paired-end reads per library. Detailed bioinformatic and statistical methods are provided in the supplemental Data, available on the Blood website. Raw sequencing files have been deposited in the Database of Genotypes and Phenotypes (phs003741.v1.p1).
Flow cytometry
BCMA mean fluorescence intensity (MFI) was measured on abnormal plasma cells (CD19– CD56+ CD38+ CD138+ CD45+) using a modified 4-laser, 11-color Becton Dickinson (BD) LSRII flow cytometer (BD Biosciences, San Jose, CA). Fluorescently labeled monoclonal antibodies were obtained from Beckman Coulter (Fullerton, CA) and BD (San Jose, CA) as follows: CD19 PE-Cy5 (Beckman Coulter), CD56 PE-Cy7 (BD), CD38 A594 (BD Custom), CD138 BV421 (BD), CD45 APC-H7 (BD), and BCMA PE (Miltenyi).
For comparison of immune cell frequency with snRNA-seq, BMMCs were labeled with CD38 BUV395 (BD), CD8 BUV805 (BD), CD3 BV510 (BD), CD20 cFluor B548 (Cytek), CD45 Spark YG 570 (BioLegend, San Diego, CA), CD16 PE (BioLegend), CD14 APC (BioLegend), CD56 cFluor R720 (Cytek, Fremont, CA), and CD4 cFluor R840 (Cytek) monoclonal antibodies and analyzed on the Aurora-Spectral Flow system (Cytek).
In vitro culture experiments and cytokine analysis
Classical (CD14+CD16–) and nonclassical monocytes (CD14+CD16+) were sorted from 3 healthy donor peripheral blood mononuclear cell samples using a BD FACSymphony S6 sorter using antibodies described above. MM cell lines (H929, U266, and MOLP8) were obtained from ATCC and cultured in RPMI 1640 supplemented with 20% FBS, 2-mM L-glutamine, and penicillin-streptomycin. MM cells were incubated with 0.1-μM GSI (LY3039478-crenigacestat) for 24 hours. Classical or nonclassical monocytes were cocultured with each tumor cell line at a 1:1 effector-to-target ratio, with or without GSI, in 96-well plates for 12 hours. Tumor cells were identified by green fluorescent protein and CD38 expression. Dead cells were stained with 7-aminoactinomycin D and counted using CountBright Beads. Flow cytometric data were acquired on a BD FACSCelesta and analyzed using FlowJo software.
Cell culture media were analyzed in triplicate using enzyme-linked immunosorbent assay for interleukin-10 (IL-10; R&D Systems) and tumor necrosis factor α (TNF-α; BioLegend), with results reported as the average concentration (pg/mL). Participant plasma samples were analyzed using Olink Target 48 Immune Response and Olink Target 48 Cytokine panels. Due to interference from high levels of monoclonal protein, only pretreatment and posttreatment samples from 10 participants were included. A total of 88 unique cytokines were analyzed after excluding thymic stromal lymphopoietin, which was unmeasurable in most samples.
Measurement of sBCMA
sBCMA was measured by Meso Scale Discovery (MSD) immunoassay. Plates were coated with monoclonal anti-BCMA antibody (J6M0-wtFc), blocked, and incubated with human BCMA extracellular domain (1-53) standards (GSK) or serum samples. Plates were washed and biotinylated polyclonal anti-BCMA antibody and sulfo-TAG streptavidin (MSD) were added. Readings were taken using an MSD Sector Imager 6000.
Results
Characteristics of the study population
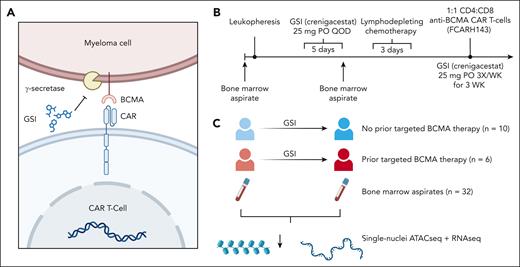
To understand the effects of GSI on the bone marrow microenvironment and tumor cells, we used snRNA-seq combined with snATAC-seq on unsorted BMMCs collected from 16 patients with relapsed or refractory MM before and after a short course of GSI administration (Figure 1). We chose to stratify the patients according to prior history of BCMA-directed therapy because the outcome of the previously reported clinical trial revealed a longer PFS after anti-BCMA CAR T cells among BCMA-naïve patients. We did not observe a significant difference in demographics, stage, high-risk cytogenetics, or prior stem cell transplant history between these 2 subgroups (Table 1; supplemental Table 1).
Overview of study design. (A) GSI increase antigen density on MM cells by inhibiting γ-secretase–mediated cleavage of BCMA, thereby improving recognition of anti-BCMA CAR T-cell therapy for MM. (B) Timeline of a prior phase 1 clinical trial that assessed the safety of GSI for patients with MM receiving anti-BCMA CAR T-cell therapy, serving as the source for our study samples. (C) The design of this study was to interrogate the bone marrow microenvironment using single-cell multiome ATAC plus gene expression of 16 clinical trial patients before and after exposure to 3 doses of oral GSI (crenigacestat). QOD, every other day.
Overview of study design. (A) GSI increase antigen density on MM cells by inhibiting γ-secretase–mediated cleavage of BCMA, thereby improving recognition of anti-BCMA CAR T-cell therapy for MM. (B) Timeline of a prior phase 1 clinical trial that assessed the safety of GSI for patients with MM receiving anti-BCMA CAR T-cell therapy, serving as the source for our study samples. (C) The design of this study was to interrogate the bone marrow microenvironment using single-cell multiome ATAC plus gene expression of 16 clinical trial patients before and after exposure to 3 doses of oral GSI (crenigacestat). QOD, every other day.
Patient characteristics after a median follow-up of 36 months
| Characteristic . | Prior anti-BCMA therapy . | P value . | |
|---|---|---|---|
| No . | Yes . | ||
| n | 10 | 6 | |
| Sex, n (%) | |||
| Female | 6 (60) | 3 (50) | 1.000 |
| Male | 4 (40) | 3 (50) | |
| Age, mean (SD), y | 65.2 (6.5) | 62.5 (97) | .498 |
| ISS stage, n (%) | |||
| Stage I | 1 (10.0) | 0 (0.0) | .504 |
| Stage II | 4 (40.0) | 1 (16.7) | |
| Stage III | 3 (30.0) | 2 (33.3) | |
| Unknown | 2 (20.0) | 3 (50.0) | |
| High-risk cytogenetics, n (%) | |||
| No | 3 (30.0) | 2 (33.3) | 1.000 |
| Yes | 7 (70.0) | 4 (66.7) | |
| Prior anti-BCMA therapy, n (%) | |||
| ADC | 0 (0) | 2 (33.3) | .001 |
| CAR T cell | 0 (0) | 3 (50) | |
| BsAb | 0 (0) | 1 (16.7) | |
| Prior auto transplant, n (%) | |||
| No | 1 (10) | 0 (0) | 1.000 |
| Yes | 9 (90) | 6 (100) | |
| Prior allo transplant, n (%) | |||
| No | 10 (100) | 5 (83.3) | .790 |
| Yes | 0 (0) | 1 (16.7) | |
| Received FCARH143, n (%) | |||
| No | 2 (20) | 0 (0) | .696 |
| Yes | 8 (80) | 6 (100) | |
| PFS, mean (SD), d | 674 (275) | 117 (116) | <.001 |
| OS, mean (SD), d | 883 (327) | 302 (417) | .010 |
P values are shown for Wilcoxon rank-sum test for nominal variables and Fisher exact test for categorical variables. PFS and OS are not available for 1 patient who did not receive CAR T-cell therapy due to disease progression. High-risk cytogenetics included 1q+, del(17p), t(4;14), and t(14;16).
ADC, antibody-drug conjugate; allo, allogeneic; auto, autologous; BsAb, bispecific antibody; ISS, International Staging System; OS, overall survival; SD, standard deviation.
Nonclassical monocytes are significantly reduced after GSI exposure
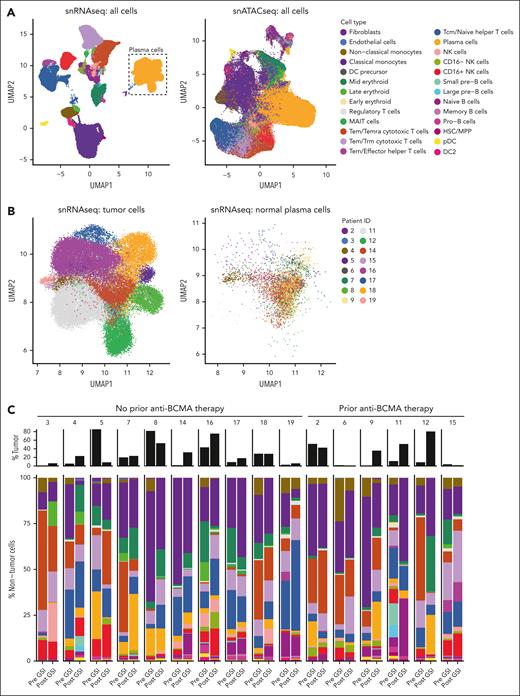
After quality filtering, including removal of ambient RNA using CellBender,16 a total of 220 271 nuclei from BMMCs were analyzed by snRNA-seq + snATAC-seq (median, 6947 cells per sample [range, 247-17 464]; supplemental Table 2). Cells were automatically classified from snRNA-seq using Celltypist17 into 26 immune cell types (Figure 2A; supplemental Table 3). Tumor cells were defined as plasma cells with evidence of aneuploidy predicted by Numbat (Figure 2B). Dimensionality reduction of snRNA-seq using uniform manifold approximation and projection revealed tumor cells, but not normal plasma cells, clustered into distinct subpopulations specific to each patient sample. Flow cytometric enumeration of BMMC was similar to snRNA-seq quantification (Pearson correlation = 0.71; supplemental Figure 1). The expression of canonical genes was highly specific to each cell type (supplemental Figure 2).
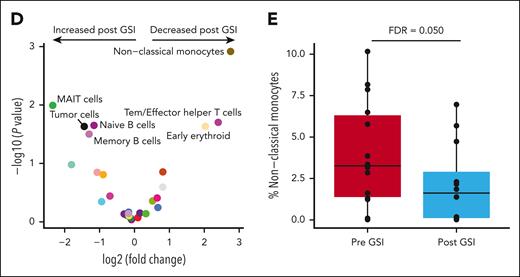
Bone marrow nonclassical monocytes are significantly reduced after GSI exposure. (A) Comparison of snRNA-Seq and snATAC-seq data using uniform manifold approximation and projection (UMAP) illustrating the automated classification of 26 distinct cell types. (B) Plasma cells were defined by their gene expression profile and the presence of aneuploidy distinguished tumor cells from normal cells. (C) Stacked bar plot comparing the cell type frequency for all samples. The percentage of nontumor cells is shown in color bars, whereas the tumor cell fraction is represented by black bars. (D) Volcano plot illustrating the results of a differential abundance analysis comparing the frequency of cell types before and after exposure to GSI. Labeled points are cell types with a P value < .05. (E) After adjustment for multiple comparisons, only nonclassical monocytes remained statistically significant, with an FDR of 0.05. DC, dendritic cell; HSC/MPP, hematopoietic stem cells/multipotent progenitor cells; pDC, plasmacytoid dendritic cell; NK, natural killer; Tcm, central memory T cell; Temra, terminally differentiated effector memory T cell; Trm, tissue-resident memory T cell.
Bone marrow nonclassical monocytes are significantly reduced after GSI exposure. (A) Comparison of snRNA-Seq and snATAC-seq data using uniform manifold approximation and projection (UMAP) illustrating the automated classification of 26 distinct cell types. (B) Plasma cells were defined by their gene expression profile and the presence of aneuploidy distinguished tumor cells from normal cells. (C) Stacked bar plot comparing the cell type frequency for all samples. The percentage of nontumor cells is shown in color bars, whereas the tumor cell fraction is represented by black bars. (D) Volcano plot illustrating the results of a differential abundance analysis comparing the frequency of cell types before and after exposure to GSI. Labeled points are cell types with a P value < .05. (E) After adjustment for multiple comparisons, only nonclassical monocytes remained statistically significant, with an FDR of 0.05. DC, dendritic cell; HSC/MPP, hematopoietic stem cells/multipotent progenitor cells; pDC, plasmacytoid dendritic cell; NK, natural killer; Tcm, central memory T cell; Temra, terminally differentiated effector memory T cell; Trm, tissue-resident memory T cell.
The percentage of immune cells was calculated within the nontumor cell population to avoid bias from varying tumor cell frequencies (range, 0.11%-85% tumor cells per sample). The most frequent immune cell types were classical monocytes, cytotoxic T cells, and helper T cells, representing 68% of the nontumor cell population (Figure 2C). Cells that increased in frequency after GSI exposure included mucosal-associated invariant T cell (MAIT) cells, tumor cells, naïve B cells, and memory B cells (edgeR P < .05; Figure 2D; supplemental Figure 3; supplemental Table 4). In contrast, cells that decreased after GSI were nonclassical monocytes, effector memory T cell (Tem)/effector helper T cells, and early erythroid cells (edgeR P < .05; Figure 2D). However, only nonclassical monocytes reached statistical significance after correcting for multiple comparisons (false discovery rate [FDR] = 0.050; Figure 2E). The frequency of nonclassical monocytes before or after GSI exposure was not associated with PFS. No significant differences in cell type abundance were observed at baseline between patients with and without prior BCMA-directed therapy.
The effect of GSI on gene expression is cell-type dependent
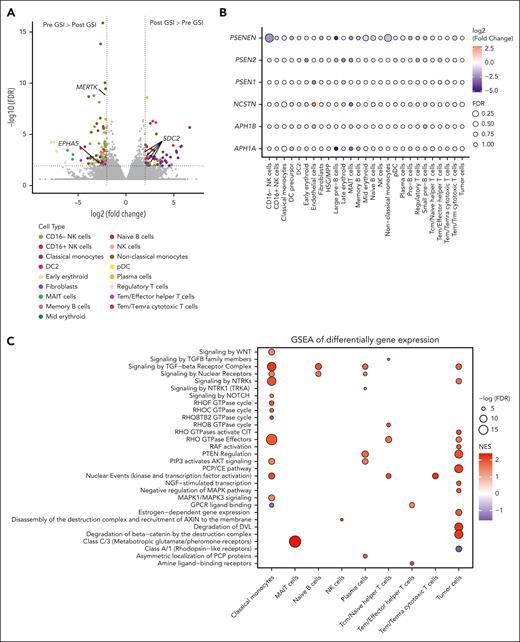
Differential gene expression analysis between pre- and post-GSI treatment samples identified 567 genes with significantly altered expression across 20 cell types (FDR < 0.05; supplemental Table 5). Classical and nonclassical monocytes were the most affected, with 164 genes upregulated and 200 downregulated after GSI treatment (Figure 3A). Notably, several known γ-secretase substrates were among the differentially expressed genes, including EPHA5 (EPH Receptor A5), MERTK (MER Proto-Oncogene, Tyrosine Kinase), and SDC2 (syndecan 2).18,19EPHA5 was significantly downregulated in classical monocytes, whereas MERTK was downregulated in nonclassical monocytes. Conversely, SDC2 expression increased in plasma cells, nonclassical monocytes, classical monocytes, and type 2 dendritic cells. Although GSI treatment did not significantly alter the expression of γ-secretase subunit genes, most cell types exhibited a trend toward reduced expression (Figure 3B).
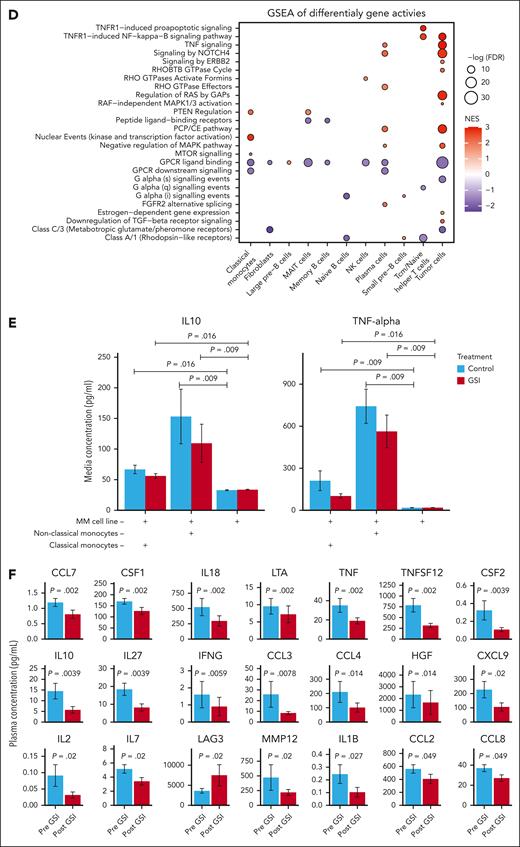
Cell-type–specific effects of GSI on gene expression and chromatin accessibility. (A) Volcano plot depicting differentially expressed genes from bone marrow samples of patients before and after GSI treatment. Genes encoding proteins that are known substrates of γ-secretase are highlighted. (B) Dot plot of the log-fold change and FDR of genes encoding γ-secretase subunits after GSI exposure in each cell type. (C-D) Gene set enrichment analysis (GSEA) of Reactome pathways using log2 fold change of differentially expressed genes (C) and gene activity scores between pre- and post-GSI exposure samples (D). (E) IL-10 and TNF-α levels in MM cell lines (H292, U266, and MOLP8) cocultured with or without allogeneic classical or nonclassical monocytes isolated from healthy donor peripheral blood mononuclear cells (PBMCs). Error bars represent standard error from 3 independent experiments using 3 MM cell lines and 3 donor PBMCs. P values from Wilcoxon rank-sum tests indicate significant differences. (F) Significantly differentially detected circulating cytokines in clinical trial participants before and after GSI exposure (n = 10). P values from Wilcoxon signed-rank tests are shown. CCL, chemokine (C-C motif) ligand; CSF, colony stimulating factor; DC2, dendritic cell type 2; DVL, disheveled; GPCR, G protein-coupled receptor; GTPase, guanosine triphosphatase; LTA, lymphotoxin-α; NES, normalized enrichment score; NGF, nerve growth factor; NCSTN, nicastrin; PCP, planar cell polarity; PTEN, phosphatase and tensin homolog; PSEN, presenilin; RAF, rapidly accelerated fibrosarcoma; RHOF, Ras homolog family member F; TGF, transforming growth factor; WNT, wingless-INT.
Cell-type–specific effects of GSI on gene expression and chromatin accessibility. (A) Volcano plot depicting differentially expressed genes from bone marrow samples of patients before and after GSI treatment. Genes encoding proteins that are known substrates of γ-secretase are highlighted. (B) Dot plot of the log-fold change and FDR of genes encoding γ-secretase subunits after GSI exposure in each cell type. (C-D) Gene set enrichment analysis (GSEA) of Reactome pathways using log2 fold change of differentially expressed genes (C) and gene activity scores between pre- and post-GSI exposure samples (D). (E) IL-10 and TNF-α levels in MM cell lines (H292, U266, and MOLP8) cocultured with or without allogeneic classical or nonclassical monocytes isolated from healthy donor peripheral blood mononuclear cells (PBMCs). Error bars represent standard error from 3 independent experiments using 3 MM cell lines and 3 donor PBMCs. P values from Wilcoxon rank-sum tests indicate significant differences. (F) Significantly differentially detected circulating cytokines in clinical trial participants before and after GSI exposure (n = 10). P values from Wilcoxon signed-rank tests are shown. CCL, chemokine (C-C motif) ligand; CSF, colony stimulating factor; DC2, dendritic cell type 2; DVL, disheveled; GPCR, G protein-coupled receptor; GTPase, guanosine triphosphatase; LTA, lymphotoxin-α; NES, normalized enrichment score; NGF, nerve growth factor; NCSTN, nicastrin; PCP, planar cell polarity; PTEN, phosphatase and tensin homolog; PSEN, presenilin; RAF, rapidly accelerated fibrosarcoma; RHOF, Ras homolog family member F; TGF, transforming growth factor; WNT, wingless-INT.
Gene set enrichment analysis of differentially expressed genes (Figure 3C) and chromatin accessibility regions (Figure 3D) revealed significant enrichment in various signal transduction pathways, including the γ-secretase–dependent Notch signaling pathway in classical monocytes. Chromatin accessibility analysis further revealed enrichment in the TNFR1-induced NF-κB signaling pathway within tumor cells. Additionally, both gene expression and chromatin accessibility analyses highlighted enrichment in the negative regulation of the MAPK pathway in tumor cells. Importantly, BCMA, similar to TNFR1, belongs to the TNFR superfamily and can activate both NF-κB and MAPK signaling. These pathways are frequently activated in MM, highlighting a potential role for GSI in modulating these critical signaling cascades.20
GSI and monocytes have synergistic effects on tumor cell proliferation
Observing a significant decrease in nonclassical monocytes after GSI exposure, we hypothesized that GSI might alter monocyte cytokine production and subsequently affect tumor proliferation. To test this, we cocultured MM cell lines with and without allogeneic classical or nonclassical monocytes isolated from healthy donor peripheral blood mononuclear cells. After treatment with GSI or vehicle control, we observed an increase in the growth of 3 MM cell lines cultured without monocytes (supplemental Figure 4A). However, the opposite effect was observed when we cocultured tumor cells with classical or nonclassical monocytes, in which we saw a significant decrease in tumor cell count compared with the monoculture (Wilcoxon rank-sum test, P = .009). Notably, the combination of GSI and monocytes exerted a synergistic inhibitory effect on the proliferation of H929 cells, which express the highest levels of BCMA among the tested cell lines (supplemental Figure 4B). This suggests that GSI may indirectly suppress tumor growth by modulating monocyte function.
To further explore the impact of GSI on monocyte function, we examined cytokine levels in the coculture media. Enzyme-linked immunosorbent assay analysis revealed a significant reduction in both proinflammatory TNF-α and immunosuppressive IL-10 levels in the coculture media after GSI exposure (Figure 3E; supplemental Figure 5), suggesting GSI may affect monocyte cytokine secretion. To investigate systemic effects, we performed Olink proteomic analysis on 88 cytokines and immune-related proteins in peripheral blood plasma from 10 study participants before and after GSI treatment. This analysis identified a significant decrease in 20 proteins after GSI exposure, including both TNF-α and IL-10 (Figure 3F; supplemental Table 6). The only circulating protein to significantly increase after GSI treatment was LAG3.
GSI perturbs the transcriptional regulatory network in tumor cells
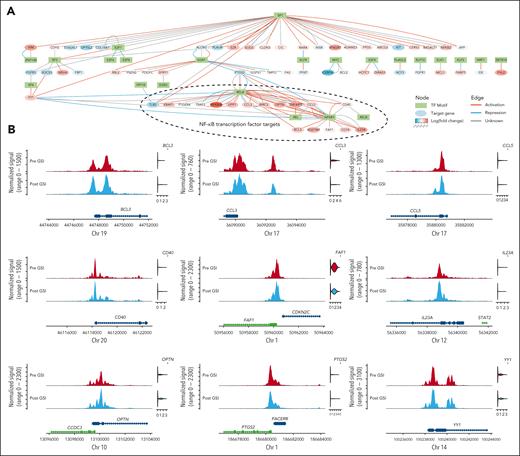
Analysis comparing chromatin accessibility before and after GSI treatment identified 1861 genes with altered promoter or gene accessibility that correlated with messenger RNA (mRNA) expression in 13 cell types (FDR < 0.05; supplemental Table 7). Tumor cells were the most affected, with increased accessibility of 654 genes after GSI and reduced accessibility of 653 genes. Further inspection of the accessible peaks within tumor cells identified 23 transcription factor motifs overrepresented in differentially accessible promotor regions (Figure 4A; supplemental Table 8). Using a database of known transcription factor–target relationships,21 we illustrate these connections in a network diagram in Figure 4A and overlay the fold change of mRNA expression between pre- and post-GSI samples. In most cases, the observed effect of the transcription factor on its target gene aligned with expectations (eg, activation coupled with increased gene expression). Notably, we observed increased expression of genes targeted by NF-κB transcription factor family members (NFKB1, REL, RELA, and RELB), which are implicated in MM pathogenesis through activation of BCMA signaling.22Figure 4B illustrates the distribution of chromatin accessibility within linked gene promoters containing NFKB1 binding motifs in relation to the mRNA expression of linked genes.
Perturbations in tumor cell transcriptional regulatory network after the inhibition of γ-secretase. (A) Network diagram illustrating tumor cell transcription factor binding motifs (green) overrepresented in differentially accessible promotor regions after γ-secretase inhibition. Target genes are represented by ovals, in which the red fill color corresponds to increased expression after GSI and blue indicates reduced expression. Edges represent the expected transcriptional regulation curated from a database of human transcriptional regulatory networks (TRRUST v2). (B) Pseudobulk normalized frequency of Tn5 insertion events (a measure of chromatin accessibility) for ATAC-seq peaks encompassing the NFKB1 transcription factor binding motif (MA0105.4). Only peaks within 3 kilobases of a known target gene’s promoter that are statistically correlated with its expression are shown. The violin plots to the right of the tracks illustrate the normalized mRNA expression. Complete results of statistical testing are provided in supplemental Table 6. Chr, chromosome.
Perturbations in tumor cell transcriptional regulatory network after the inhibition of γ-secretase. (A) Network diagram illustrating tumor cell transcription factor binding motifs (green) overrepresented in differentially accessible promotor regions after γ-secretase inhibition. Target genes are represented by ovals, in which the red fill color corresponds to increased expression after GSI and blue indicates reduced expression. Edges represent the expected transcriptional regulation curated from a database of human transcriptional regulatory networks (TRRUST v2). (B) Pseudobulk normalized frequency of Tn5 insertion events (a measure of chromatin accessibility) for ATAC-seq peaks encompassing the NFKB1 transcription factor binding motif (MA0105.4). Only peaks within 3 kilobases of a known target gene’s promoter that are statistically correlated with its expression are shown. The violin plots to the right of the tracks illustrate the normalized mRNA expression. Complete results of statistical testing are provided in supplemental Table 6. Chr, chromosome.
GSI exposure altered inferred cell-cell interactions within the immune microenvironment
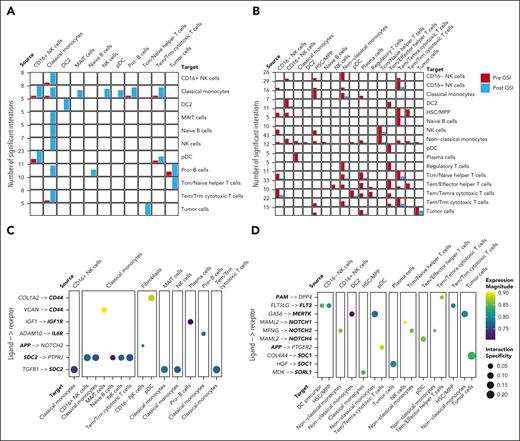
We used the LIANA package23 to integrate multiple databases of known cell-cell interactions and compared predicted ligand-receptor interactions from snRNA-seq across all cell-type pairs. Cell-cell interactions were defined by the correlated expression of secreted ligands in a source cell type and the corresponding plasma membrane receptors in a target cell type. We identified interactions that were significantly altered after GSI treatment using a Fisher exact test. We observed a significant increase in 46 and a decrease in 126 interactions between immune cell pairs after GSI (P < .05; Figures 5A-B; supplemental Table 9). Nonclassical monocytes exhibited the most dramatic change, with a decrease in all interactions after GSI. Notably, 34 ligands or receptors (20%) involved in significantly altered interactions are known γ-secretase substrates (Figures 5C-D).
GSI alters predicted cell-cell interactions within the tumor microenvironment. (A-B) Bar plots showing the total number of significant interactions between pre- and post-GSI treatment samples. Only cell-cell interactions that significantly increased (Fisher exact test P < .05) (A) or decreased (B) after GSI treatment are shown. (C-D) Dot plot illustrating the average expression and interaction specificity of ligand-receptor pairs that significantly increased (C) or decreased (D) in frequency after GSI. Only interactions in which the ligand or receptor are recognized substrates of γ-secretase are shown (bold text).
GSI alters predicted cell-cell interactions within the tumor microenvironment. (A-B) Bar plots showing the total number of significant interactions between pre- and post-GSI treatment samples. Only cell-cell interactions that significantly increased (Fisher exact test P < .05) (A) or decreased (B) after GSI treatment are shown. (C-D) Dot plot illustrating the average expression and interaction specificity of ligand-receptor pairs that significantly increased (C) or decreased (D) in frequency after GSI. Only interactions in which the ligand or receptor are recognized substrates of γ-secretase are shown (bold text).
GSI does not induce compensatory change in TNFRSF17 mRNA expression
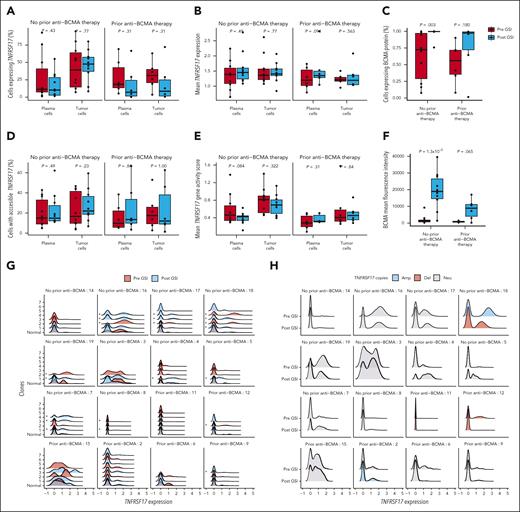
We hypothesized that the enzymatic cleavage of BCMA by γ-secretase might create a negative feedback loop, by which gene expression or chromatin accessibility would subsequently increase. Although we observed a significant correlation in TNFRSF17 gene expression and chromatin accessibility (P = 2.23 × 10⁻⁵; supplemental Figure 6), we did not detect a significant difference in the frequency of plasma cells expressing TNFRSF17 nor did we observe a substantial change in the normalized expression value of the gene after GSI exposure (Figure 6A-B). Similarly, there was no effect on chromatin accessibility of the TNFRSF17 promoter after treatment with GSI (Figure 6D-E). This was despite observing a significant increase in BCMA-expressing plasma cells and MFI among patients with no prior history of BCMA-directed therapy, measured by flow cytometry (Figure 6C and F). Finally, GSI did not appear to affect gene expression or chromatin accessibility of other known MM therapeutic targets on tumor cells (supplemental Figure 7).
GSI reduced BCMA shedding from plasma cells in patients without effect on TNFRSF17 mRNA expression. (A-B) Box plots comparing the percentage of tumor and normal plasma cells expressing TNFRSF17 (A) and the normalized TNFRSF17 expression (B). Paired Wilcoxon rank-sum P values are shown for each comparison between time points. (C) Box plots comparing the percentage of plasma cells expressing BCMA using flow cytometry. (D) Box plots comparing the percentage of tumor and normal plasma cells with accessible chromatin in the TNFRSF17 gene body or promoter regions before and after exposure to GSI. (E) Normalized TNFRSF17 gene activity (counts within gene body or promoter regions) before and after exposure to GSI. (F) Box plots comparing BCMA MFI before and after exposure to GSI. (G) Density plots of normalized TNFRSF17 expression for each tumor cell subclone inferred by clustering of copy number variants. An asterisk to the left of the density plot indicates that its TNFRSF17 expression significantly differed from normal plasma cells (eg, plasma cells without aneuploidy) using the MAST statistical framework. (H) Density plots of normalized TNFRSF17 expression according to the number of copies of TNFRSF17. Amp, amplification; Del, deletion; Neu, neutral.
GSI reduced BCMA shedding from plasma cells in patients without effect on TNFRSF17 mRNA expression. (A-B) Box plots comparing the percentage of tumor and normal plasma cells expressing TNFRSF17 (A) and the normalized TNFRSF17 expression (B). Paired Wilcoxon rank-sum P values are shown for each comparison between time points. (C) Box plots comparing the percentage of plasma cells expressing BCMA using flow cytometry. (D) Box plots comparing the percentage of tumor and normal plasma cells with accessible chromatin in the TNFRSF17 gene body or promoter regions before and after exposure to GSI. (E) Normalized TNFRSF17 gene activity (counts within gene body or promoter regions) before and after exposure to GSI. (F) Box plots comparing BCMA MFI before and after exposure to GSI. (G) Density plots of normalized TNFRSF17 expression for each tumor cell subclone inferred by clustering of copy number variants. An asterisk to the left of the density plot indicates that its TNFRSF17 expression significantly differed from normal plasma cells (eg, plasma cells without aneuploidy) using the MAST statistical framework. (H) Density plots of normalized TNFRSF17 expression according to the number of copies of TNFRSF17. Amp, amplification; Del, deletion; Neu, neutral.
TNFRSF17 expression is heterogenous within tumors and across samples
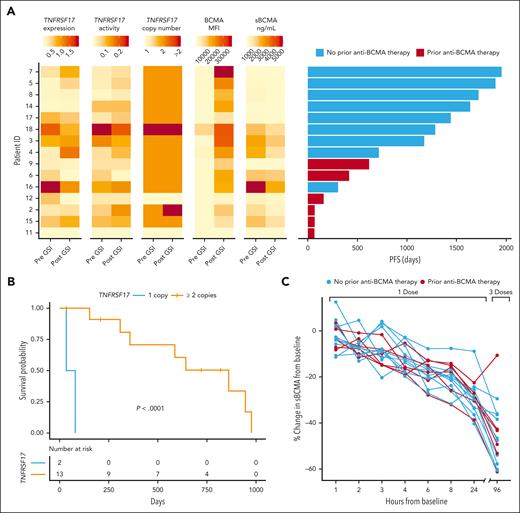
Using Numbat,24 we inferred single-cell copy number profiles and tumor clonal phylogenies to study the heterogeneity of TNFRSF17 expression across tumor subclones (supplemental Table 10). Single-cell differential gene expression analysis revealed that TNFRSF17 expression was significantly greater in 21 of 59 tumor subclones (36%) than normal plasma cells, particularly after GSI exposure (FDR < 0.05; Figure 6G). Given that prior studies have shown monoallelic and biallelic deletions of TNFRSF17 result in reduced PFS in patients receiving BCMA-targeted therapy,25-28 we investigated the effects of a deletion at 16p13.13 on TNFRSF17 expression across tumor subclones. In snRNA-seq data, we identified a preexisting deletion of the TNFRSF17 locus in 2 patients (supplemental Figure 8A). This deletion was associated with reduced TNFRSF17 expression in tumor cells at the single-cell level, although this difference was not evident when averaged across whole samples (supplemental Figure 8B-C). Additionally, we observed substantial variation in TNFRSF17 expression among tumor subclones both within and between patient samples without evidence of gene deletion (Figure 6H). We further compared PFS after CAR T-cell therapy with TNFRSF17 gene expression, promoter accessibility, BCMA MFI, deletion of TNFRSF17, and sBCMA levels (Figure 7A). We observed that TNFRSF17 expression was strongly associated with PFS (log-rank P < .0001; median PFS, 33 vs 642 days; Figure 7B). However, caution is advised when interpreting these results due to the small sample size. Finally, we measured sBCMA levels in the blood at 1, 2, 3, 4, 6, 8, and 24 hours after the first dose of GSI and again 96 hours later after the third dose. We observed a significant decrease in sBCMA levels compared with baseline starting at hour 2 and at each subsequent measurement thereafter, with the most profound decrease occurring after the third dose (Figure 7C; supplemental Figure 9).
TNFRSF17 copy number and BCMA protein expression correlate with PFS. (A) Tumor cell TNFRSF17 mRNA expression, gene activity score (normalized counts within chromatin accessible gene promoters), copy number, BCMA MFI, and sBCMA in relation to PFS in patients receiving anti-BCMA CAR T-cell therapy (n = 15). (B) Kaplan-Meier survival curve by TNFRSF17 copy number status detected in plasma cells before GSI exposure. (C) Percent change in sBMCA levels measured in the serum after GSI treatment compared with pretreatment baseline levels. All comparisons to baseline except the 1-hour measurement were statistically significant (Wilcoxon rank-sum test, P < .05).
TNFRSF17 copy number and BCMA protein expression correlate with PFS. (A) Tumor cell TNFRSF17 mRNA expression, gene activity score (normalized counts within chromatin accessible gene promoters), copy number, BCMA MFI, and sBCMA in relation to PFS in patients receiving anti-BCMA CAR T-cell therapy (n = 15). (B) Kaplan-Meier survival curve by TNFRSF17 copy number status detected in plasma cells before GSI exposure. (C) Percent change in sBMCA levels measured in the serum after GSI treatment compared with pretreatment baseline levels. All comparisons to baseline except the 1-hour measurement were statistically significant (Wilcoxon rank-sum test, P < .05).
Discussion
Mechanisms of resistance to anti-BCMA therapy include the lack of persistence of CAR T cells, antigen loss or escape, and T-cell exhaustion within the immune microenvironment.28-31 Antigen loss may be due to either γ-secretase–mediated cleavage of BCMA or biallelic deletion of TNFRSF17 or monoallelic deletion combined with missense mutations in the extracellular domain.25-28 In this study, we investigated the effect of inhibiting γ-secretase on both tumor and nontumor cells in the bone marrow microenvironment of patients with relapsed or refractory MM before receiving anti-BCMA CAR T-cell therapy. Our results demonstrate that GSI has far-reaching effects beyond the target tumor cell population.
Within the immune microenvironment, GSI significantly affected monocytes, resulting in a marked reduction in the frequency of nonclassical monocytes and substantial gene expression changes in nonclassical and classical monocytes. This led us to hypothesize that GSI might alter monocyte function, thereby influencing tumor proliferation. Previous research has shown that nonclassical monocytes promote tumor growth and survival by secreting proinflammatory cytokines and growth factors that support MM cell proliferation and resistance to apoptosis.32 By coculturing MM cell lines with nonclassical and classical monocytes, we observed a pronounced reduction in cytokine production, particularly when treated with GSI. In our study participants, GSI treatment led to a significant reduction in 20 circulating cytokines. These findings support the hypothesis that GSI may provide secondary therapeutic benefits by modulating monocyte function.
Additionally, we observed altered expression of multiple genes known to interact with a γ-secretase substrate, including those involved in Notch signaling. This finding aligns with previous reports demonstrating that crenigacestat selectively inhibits NOTCH1.33,34 Reactome pathway enrichment analysis of gene expression data showed an effect specific to classical monocytes, whereas ATAC-seq data indicated an impact on Notch signaling in tumor cells. Notch signaling pathway is a crucial regulator of cell fate decisions and is involved in the maturation, activation, and function of immune cells, including monocytes.35 Dysregulation of Notch signaling may disrupt this differentiation process and possibly explain the observed reduction in the frequency of nonclassical monocytes. Additionally, inhibiting Notch within monocytes could lead to reduced production of cytokines, which otherwise contribute to the development of a tumor-supportive microenvironment.
Although our study noted a decrease in tumor cell frequency after GSI treatment, this effect was not statistically significant after adjusting for multiple comparisons. We note that some tumor growth was expected during this period because patients were not receiving antimyeloma therapy. Despite that, we did detect increased chromatin accessibility within the promoter regions of genes targeted by NF-κB family members REL (c-REL), RELA (p65), RELB, and NFKB1 , which play a crucial role in MM survival and proliferation.36 In addition to encompassing NF-κB transcription factor binding motifs, the increased accessibility was significantly correlated with increased gene expression. Additionally, we observed greater accessibility of the transcription factor ELK1, which was associated with the upregulation of MCL1. MCL1 is abundantly expressed in MM, in which it prevents apoptosis by binding to and inactivating proapoptotic proteins from the BCL-2 family.37 This antiapoptotic function is vital for the survival and proliferation of MM cells in the bone marrow microenvironment. These results indicate that GSI treatment might augment BCMA signaling and activate pathways essential for MM cell survival, suggesting caution when considering GSI as a standalone therapy in MM treatment.
Although BCMA protein density increased after GSI treatment, the effect was not significant in patients with a prior history of exposure to BCMA-directed therapies. Of the 6 patients in our study with prior exposure to anti-BCMA treatments, 2 were found to have a deletion of the TNFRSF17 gene locus at the time of screening. The remaining 4 patients had lower BCMA MFI than patients without prior anti-BCMA exposure (mean MFI, 919 vs 1201; Wilcoxon rank-sum P = .808). Previous studies have shown that CAR T-cell cytokine production is significantly correlated with target antigen density on the surface of tumor cells.38 For lytic activity of anti-CD20 CAR T cells, the threshold antigen density was determined to be ∼200 molecules per target cell, whereas the antigen density required for cytokine production was 10-fold higher.39
Finally, we did not observe any effect of GSI on the relative abundance or gene expression of T cells. Although CD8+ T cells require Notch signaling for the expression of canonical effector molecules, including interferon γ and granzyme B, we did not detect any changes in the expression of the genes that may potentially alter CAR T-cell function.40 We note that the dose and frequency of the GSI administered in the clinical trial were based on preclinical data suggesting that the level of Notch inhibition would not be sufficient to impair CAR T-cell function.11
Overall, this study reveals the widespread impact of GSI on the bone marrow microenvironment in patients with MM to augment anti-BCMA CAR T-cell therapy. Although GSIs may have therapeutic potential by modulating the function of monocytes, they also appear to activate pathways crucial for myeloma cell survival. Ongoing studies are investigating potential resistance mechanisms after CAR T-cell therapy, which will be essential in understanding how to best use GSIs in combination with immunotherapy.
Acknowledgments
MedGenome performed single-cell library preparation and sequencing.
The authors acknowledge a generous donation from Richard Lane as well as funding from Juno Therapeutics, a Bristol Myers Squibb company, which supported the clinical trial from which patient specimens were obtained. Funding for the data used to support the conceptualization of the clinical trial and development of the B-cell maturation antigen chimeric antigen receptor T-cell products used in the study from which specimens were analyzed was provided by the National Institutes of Health, National Cancer Institute (grant P01 CA018029), the Leukemia and Lymphoma Society Specialized Center of Research program, Defeat Myeloma, the Brotherton Family, and the Quest for Truth Foundation.
Authorship
Contribution: D.J.G. and D.G.C. conceived of the project; M.J.P., M.L.C., P.A.A., and A.J.C. acquired samples and clinical data; P.A.A. and E.A. performed in vitro studies; O.L., S.S., G.R.H., and S.R.R. assisted and supported the research; D.G.C. analyzed the data; and D.G.C. wrote the manuscript with input from all authors.
Conflict-of-interest disclosure: D.J.G. has received research funding, served as an advisor for, and received royalties from Juno Therapeutics, a Bristol Myers Squibb company; has served as an advisor and received research funding from Janssen Biotech and Seattle Genetics; has served as an advisor for GlaxoSmithKline, Celgene, Ensoma, and Legend Biotech; and has received research funding from SpringWorks Therapeutics, Sanofi, and Cellectar Biosciences. A.J.C. receives research funding from Juno Therapeutics, a Bristol Myers Squibb company, Nektar, Janssen, AbbVie, Harpoon, Sanofi, Adaptive Biotechnologies, and Celgene; is a consultant for Adaptive Biotechnologies, Bristol Myers Squibb, and AbbVie; and receives payment for presentations from Curio Science, DAVA Oncology, and MJH Life Sciences. M.J.P. has served as a consultant for SpringWorks Therapeutics; owns stock or has stock options in Lyell Immunopharma; and is currently employed by Galapagos B.V. S.R.R. has received research funding from Juno Therapeutics, a Bristol Myers Squibb company, Lyell Immunopharma, and Outpace Biosciences; has rights to royalties from Juno Therapeutics, a Bristol Myers Squibb company, Lyell Immunopharma, and Deverra Therapeutics; has served as a consultant for Lyell Immunopharma and Adaptive Biotechnologies; has patents from Juno Therapeutics, a Bristol Myers Squibb company, and Lyell Immunopharma; serves on a board of directors for Ozette Technologies; and has stocks or stock options from Lyell Immunopharma, Adaptive Biotechnologies, and Outpace Biosciences. G.R.H. has consulted for Generon Corporation, NapaJen Pharma, iTeos Therapeutics, Commonwealth Serum Laboratories (CSL), Cynata Therapeutics, CSL Behring, and Neoleukin Therapeutics; and has received research funding from Compass Therapeutics, Syndax Pharmaceuticals, Applied Molecular Transport, Serplus Technology, Heat Biologics, Laevoroc Oncology, iTeos Therapeutics, CSL, Insight, and Genentech. The remaining authors declare no competing financial interests.
Correspondence: David G. Coffey, Division of Myeloma, Department of Medicine, Sylvester Myeloma Institute, Sylvester Comprehensive Cancer Center, University of Miami, Don Soffer Clinical Research Center, 1120 NW 14th St, Miami, FL 33136; email: davidcoffey@miami.edu; and Damian J. Green, Division of Transplantation and Cellular Therapy, Sylvester Comprehensive Cancer Center, University of Miami, Don Soffer Clinical Research Center, 1120 NW 14th St, Miami, FL 33136; email: damiangreen@miami.edu.
References
Author notes
Deidentified single-cell RNA and assay for transposase-accessible chromatin sequencing data are available through the Database of Genotypes and Phenotypes (phs003741.v1.p1).
The online version of this article contains a data supplement.
There is a Blood Commentary on this article in this issue.
The publication costs of this article were defrayed in part by page charge payment. Therefore, and solely to indicate this fact, this article is hereby marked “advertisement” in accordance with 18 USC section 1734.

This feature is available to Subscribers Only
Sign In or Create an Account Close Modal