Key Points
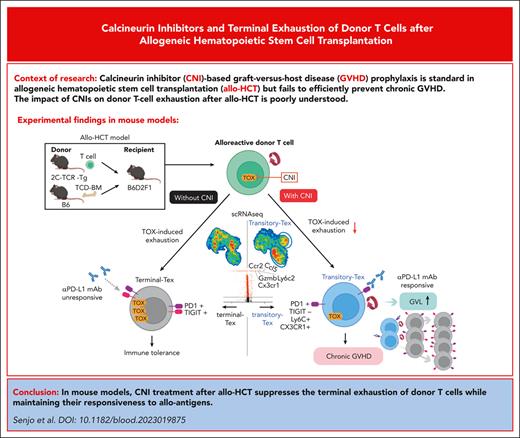
Calcineurin inhibitor treatment after allo-HCT suppresses differentiation of terminal Tex and induces transitory Tex.
Transitory Tex maintains responsiveness of donor T cells to PD-1 blockade and causes cGVHD after adoptive transfer into secondary recipients.
Abstract
Calcineurin inhibitor–based graft-versus-host disease (GVHD) prophylaxis is standard in allogeneic hematopoietic stem cell transplantation (HCT) but fails to induce long-term tolerance without chronic GVHD (cGVHD) in a considerable number of patients. In this study, we addressed this long-standing question in mouse models of HCT. After HCT, alloreactive donor T cells rapidly differentiated into PD-1+ TIGIT+ terminally exhausted T cells (terminal Tex). GVHD prophylaxis with cyclosporine (CSP) suppressed donor T-cell expression of TOX, a master regulator to promote differentiation of transitory exhausted T cells (transitory Tex), expressing both inhibitory receptors and effector molecules, into terminal Tex, and inhibited tolerance induction. Adoptive transfer of transitory Tex, but not terminal Tex, into secondary recipients developed cGVHD. Transitory Tex maintained alloreactivity and thus PD-1 blockade restored graft-versus-leukemia (GVL) activity of transitory Tex and not terminal Tex. In conclusion, CSP inhibits tolerance induction by suppressing the terminal exhaustion of donor T cells, while maintaining GVL effects to suppress leukemia relapse.
Introduction
Allogeneic hematopoietic stem cell transplantation (allo-HCT) is a curative treatment for various hematologic malignancies. Although calcineurin inhibitor (CNI)–based graft-versus-host disease (GVHD) prophylaxis improved safety of allo-HCT by reducing severe acute GVHD, incidence of chronic GVHD (cGVHD) is increasing over time,1 which significantly compromises the quality of life of transplant survivors.2-6 The biological mechanisms of cGVHD are complex, involving perturbation of central and peripheral tolerance mechanisms and activation of various immune effector cells and fibroblasts.7,8
We and others have shown that chronic exposure of donor T cells to long-lasting host allo-antigens on host nonhematopoietic cells after allo-HCT promoted the differentiation of donor T cells into exhausted T cells (Tex) with severely impaired effector functions. T-cell exhaustion is one of the chief mechanisms of tolerance induction after allo-HCT.9,10 Donor T-cell exhaustion is also associated with leukemia relapse, which is the major cause of mortality after allo-HCT.
T-cell exhaustion is a multistep process and Tex are a heterogeneous population, including precursors of exhausted T cells (Tpex) with stem cell–like properties, Tpex–derived transitory Tex with potent effector-like functions, and terminal Tex with expression of multiple inhibitory receptors and severely impaired functions.11-16 In this study, we evaluated the effects of CNIs on donor T-cell exhaustion in experimental allo-HCT using single-cell RNA sequencing (scRNA-seq) and flow cytometric (FCM) analysis. Better understandings of the cellular and molecular mechanisms leading to T-cell exhaustion after allo-HCT will help develop new strategies to improve transplant outcomes.17-19
Materials and methods
Mice
The mouse strains used are described in the supplemental Materials and Methods, available on the Blood website.
HCT
B6D2F1 recipients were lethally irradiated (11 Gy) and IV injected with 5 × 10⁶ T-cell–depleted bone marrow cells (TCD-BM) from B6 donors combined with 1 × 10⁶ 2C T-cell receptor (TCR) transgenic T cells (B6 background) and 1 × 10⁶ wild type (WT) T cells from B6-Ly5a (CD45.1+) mice on day 0. T-cell depletion and purification of donor T cells were performed using anti-CD90 Microbeads (Miltenyi Biotec, Auburn, CA, California) and mouse Pan T Cell Isolation Kit II (Miltenyi Biotec), respectively, with the AutoMACS Pro Separator (Miltenyi Biotec) following the manufacturer’s instructions. Survival of the recipient mice was monitored daily and clinical GVHD scores, incorporating 5 clinical parameters such as body weight loss, posture, activity, fur texture, and skin integrity, were evaluated 3 times per week as previously described.20 PostHCT treatment was performed as shown in supplemental Materials and Methods.
Adoptive T-cell transfer
A total of 1 × 10⁶ whole T cells were purified using AutoMACS Pro Separator from vehicle- or cyclosporine (CSP)-treated recipients 14 days after allo-HCT and combined with 5 × 10⁶ TCD-BM from naïve B6 mice and adoptively transferred into lethally irradiated secondary B6D2F1 recipients. In indicated experiments, 1 × 10⁶ Ly6C+ or Ly6C– T cells sorted from the spleen of CSP-treated recipients were combined with 5 × 10⁶ TCD-BM from naïve B6 mice and adoptively transferred into lethally irradiated secondary B6D2F1 recipients. To evaluate proliferation of transitory Tex after adoptive transfer, purified Ly6C+ donor T cells were labeled with 5 mM CellTrace Violet (CTV, Thermo Fisher Scientific) on day 14 after the first allo-HCT and adoptively transferred into the secondary recipients. Cell division was assessed by the dilution of CTV in transferred donor T cells on day 5 after the transfer.
Assessment of graft-versus-leukemia effects
Lethally irradiated B6 recipients received transplantation with 5 × 10⁶ TCD-BM and purified 1 × 10⁶ T cells from BALB/c mice. CSP or vehicle was administered daily at a dose of 25 mg/kg by oral gavage from days 0 to 14. On day +7 after HCT, CSP-treated and vehicle-treated recipient mice were IV injected with 5 × 10⁴ C1498-luc+ cells and 1 × 10⁶ C1498-luc+ cells, respectively. Number of leukemia cells injected in each group was determined so that CSP-treated and vehicle-treated mice without PD-L1 blockade died ∼5 weeks after HCT. Bioluminescence imaging was performed 2 weeks after HCT, and mice were allocated for groups with or without PD-L1 blockade based on the tumor signals detected on day 14, ensuring the tumor expansion of each group was similar. Similarly, 5 × 10⁴ P815 cells were IV injected into CSP-treated recipient mice on day 7 after HCT, in which B6D2F1 recipients underwent transplantation with B6 donor grafts. The detailed procedures of bioluminescence imaging are described in the supplemental Materials and Methods.
Flow cytometric and histological analyses
The detailed procedures are described in supplemental Materials and Methods, and the antibodies used are listed in Supplemental Table 1.
Cotton thread test
For tear-secretion analysis, exocrine function of the lacrimal glands was determined with the cotton thread test using standardized phenol red–impregnated cotton threads (Zone-Quick; Menicon, Nagoya, Japan). The cotton threads were inserted under the lower eyelids for 15 seconds, and the average of the bilateral length of tear-absorbing color-changed thread was calculated.21
ScRNA-seq
The detailed procedures of scRNA-seq analysis are described in supplemental Materials and Methods.
Preparation of luciferase-expressing leukemia cells
Cells of the B6-derived acute myeloid leukemia cell line C1498 purchased from ATCC (Rockville, MD) were infected with virus particles generated from HEK293T cells that were transfected with pMSCV-lus-IRES-YFP plasmid and pCL-Eco (#12371; Addgene, Cambridge, MA) in the RPMI 1640 medium supplemented with 1 μg/mL puromycin (Sigma-Aldrich) and 6 μg/mL polybrene (Nakarai Tesque, Kyoto, Japan).22,23 pMSCV-luc-IRES-YFP plasmid was kindly gifted by Gerard Grosveld (St Jude Children’s Research Hospital). After infection, a single YFP expressing clone was recovered by using the limiting dilution method.
Mitochondrial respiration
The oxygen consumption rates (OCR) were measured using an extracellular flux analyzer (XFp analyzer; Agilent Technologies, Santa Clara, CA) as described in supplemental Materials and Methods.
Statistical analysis
The Mann-Whitney U test or a 1-way analysis of variance followed by the Tukey post hoc test was used to compare the data. The Kaplan-Meier product limit method was used to obtain survival probability and the log-rank test was used for the comparison between survival curves. P < .05 was considered statistically significant, and all data represent the mean ± standard error of the mean (SEM). All tests were performed using the program GraphPad Prism 6 (La Jolla, CA).
Results
Donor T cells differentiate into terminal Tex after allo-HCT
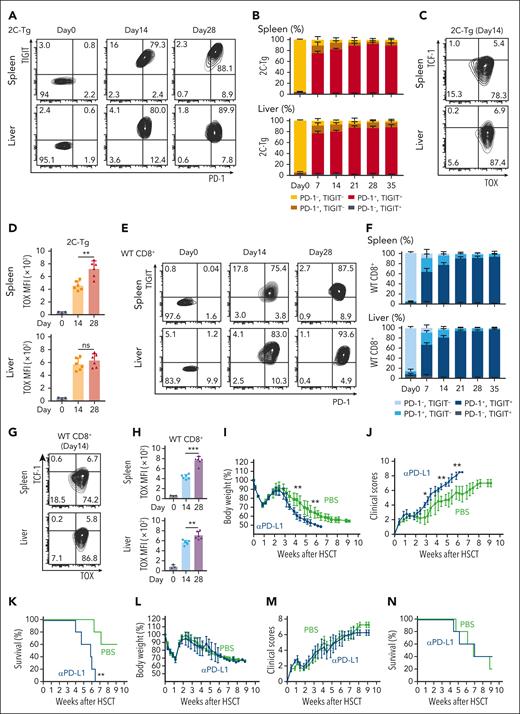
To evaluate the exhaustion of allospecific donor T cells, lethally irradiated B6D2F1 (H-2b/d) mice received transplantation with 5 × 10⁶ TCD-BM from B6 (H-2b) donors combined with 1 × 10⁶ T cells from host-specific 2C TCR transgenic (2C-Tg) mice (B6-CD8.1+ background) and 1 × 10⁶ WT T cells from B6-CD45.1+ donors on day 0. FCM analysis was performed to evaluate PD-1 and TIGIT expression on donor T cells in the spleen and liver weekly after allo-HCT. Allospecific 2C-Tg CD8+ T cells upregulated PD-1 and TIGIT by day 7 after allo-HCT, with ∼80% of 2C-Tg T cells were PD-1+ TIGIT+ Tex (Figure 1A-B). 2C-Tg CD8+ T cells upregulated TOX, a master regulator of T-cell exhaustion, and downregulated TCF-1 expression after allo-HCT, consistent with the observation of T-cell differentiation into terminal Tex (Figure 1C-D).
Donor T cells differentiated into terminal Tex after allo-HCT. (A-H) Lethally irradiated B6D2F1 mice received transplantation with T cells purified from B6-2C-Tg and B6-CD45.1 (WT) donors combined with TCD-BM from B6 donors. FCM of CD8+ T cells in the spleen (top) and liver (bottom) was performed. Contour plots and proportions (means ± SEM) of PD-1 and TIGIT expression on CD8.1+ 2C-Tg (A-B) and CD45.1+ WT (E-F) CD8+ T cells. Representative contour plots of TOX and TCF-1 and MFI of TOX expression (means ± SEM) in 2C-Tg CD8+ (C-D) and WT CD8+ T cells (G-H). Data from 2 experiments were combined (n = 5-6 per group) and shown with the data from naïve donor mice (day 0, n = 3 per group). (I-N) Lethally irradiated B6D2F1 mice received transplantation with BM cells and splenocytes from allogeneic B6 donors. Recipient mice were intraperitoneally injected with αPD-L1 or PBS from days 0 to 28 (I-K) or days 14 to 42 (L-N). Body weight changes (means ± standard deviation; panels I,L), clinical GVHD scores (means ± standard deviation; panels J,M), and survival curves (K,N). Data from 1 of the 2 experiments are shown (n = 5 per group). ∗ P < .05; ∗∗P < .01; ∗∗∗P < .005. MFI, mean fluorescence intensity; PBS, phosphate-buffered saline.
Donor T cells differentiated into terminal Tex after allo-HCT. (A-H) Lethally irradiated B6D2F1 mice received transplantation with T cells purified from B6-2C-Tg and B6-CD45.1 (WT) donors combined with TCD-BM from B6 donors. FCM of CD8+ T cells in the spleen (top) and liver (bottom) was performed. Contour plots and proportions (means ± SEM) of PD-1 and TIGIT expression on CD8.1+ 2C-Tg (A-B) and CD45.1+ WT (E-F) CD8+ T cells. Representative contour plots of TOX and TCF-1 and MFI of TOX expression (means ± SEM) in 2C-Tg CD8+ (C-D) and WT CD8+ T cells (G-H). Data from 2 experiments were combined (n = 5-6 per group) and shown with the data from naïve donor mice (day 0, n = 3 per group). (I-N) Lethally irradiated B6D2F1 mice received transplantation with BM cells and splenocytes from allogeneic B6 donors. Recipient mice were intraperitoneally injected with αPD-L1 or PBS from days 0 to 28 (I-K) or days 14 to 42 (L-N). Body weight changes (means ± standard deviation; panels I,L), clinical GVHD scores (means ± standard deviation; panels J,M), and survival curves (K,N). Data from 1 of the 2 experiments are shown (n = 5 per group). ∗ P < .05; ∗∗P < .01; ∗∗∗P < .005. MFI, mean fluorescence intensity; PBS, phosphate-buffered saline.
Similarly, vast majority of CD45.1+ WT CD8+ T cells differentiated into terminal Tex, indicating that both monoclonal and polyclonal alloreactive CD8+ T differentiated into terminal Tex after allo-HCT (Figure 1E-H).24 When donor T cells were infused into syngeneic B6 recipients, they remained PD-1–TOX–TCF-1+ phenotype, confirming the alloantigen-specific donor T-cell exhaustion after allo-HCT (supplemental Figure 1A-D). Donor WT CD4+ T cells also upregulated PD-1 and TOX after allo-HCT (supplemental Figure 1E-F). Consequently, interferon (IFN)-γ and tumor necrosis factor (TNF)-α production in donor CD4+ and CD8+ T cells was significantly impaired (supplemental Figure 1G-J).
PD-1 blockade by the administration of αPD-L1 monoclonal antibodies initiated on day 0 of allo-HCT significantly exacerbated acute GVHD (Figure 1I-K), as has been shown.9,19 In contrast, αPD-L1 starting on day 14 neither exacerbated GVHD (Figure 1L-N) nor induced proliferation of donor T cells (supplemental Figure 1K-M), confirming that PD-1 blockade was unable to restore T-cell functions of terminal Tex induced by day 14 after allo-HCT.
Single-cell RNA sequencing of donor T cells
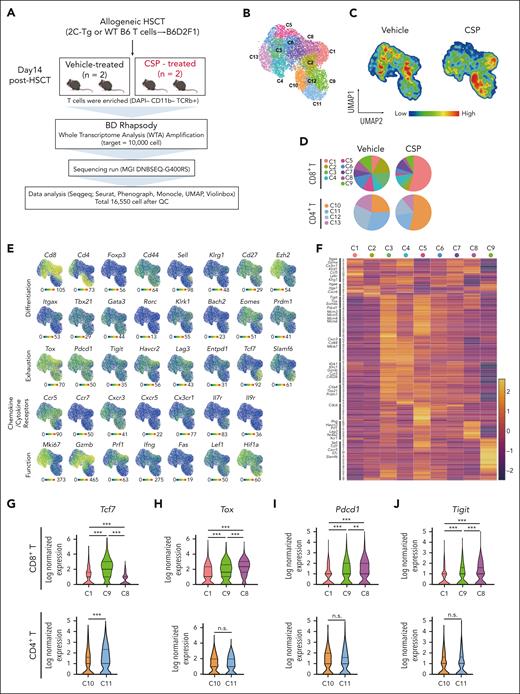
We performed scRNA-seq analysis to evaluate the heterogeneity of donor Tex and the effects of CNIs on T-cell exhaustion after allo-HCT. T cells were purified from the spleen of CSP- or vehicle-treated mice on day 14 (Figure 2A). Unsupervised clustering of scRNA-seq data identified 4 clusters of CD4+ T cells (C10-13) and 9 clusters of CD8+ T cells (C1-9) (Figure 2B); C10 and C1 accounted for >50% of whole CD4+ and CD8+ T cells in CSP-treated animals, respectively (Figure 2C-D). All these clusters expressed Tox and Pdcd1, indicating a transition toward Tex (Figure 2E).
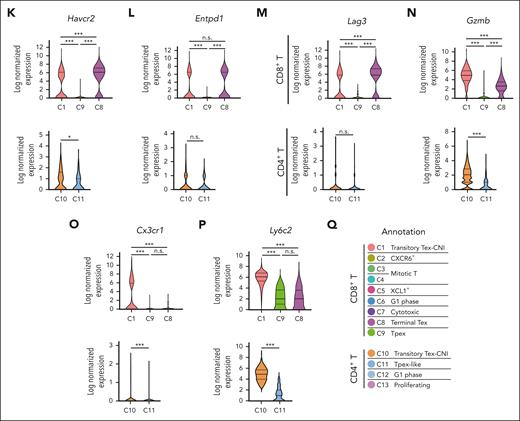
scRNA-seq of donor T cells in vehicle- or CSP-treated recipients. (A-Q) Allo-HCT was performed as in Figure 1A. Mice were treated with vehicle or CSP from days 0 to 13 after allo-HCT (n = 2 per group). Donor T cells were sorted from the spleen on day 14 and subjected to scRNA-seq. (A) A schematic overview of scRNA-seq analysis of donor T cells from the spleen. (B) UMAP for all 16 500 cells with 13 clusters of donor T cells identified using R with extension packages Seurat and PhenoGraph. (C) Compositional differences in T cells between vehicle- and CSP-treated mice were visualized in pseudocolor plots of UMAP. (D) The proportion of cells in each cluster from vehicle- or CSP-treated mice that contributed to each T-cell cluster. (E) Normalized gene-expression of molecules representative for T-cell differentiation, exhaustion, cytokine/chemokine receptors, and functions was projected on the UMAP. (F) Heatmap of top 283 DEGs in CD8+ T cells. Log2 normalized expression values for distinguishing genes among CD8+ T clusters. Characteristic molecules that were upregulated in each cluster are highlighted on the left of the heatmap. (G-P) Violin plots show expression of Tcf7 (G), Tox (H), Pdcd1 (I), Tigit (J), Havcr2 (K), Entpd1 (L), Lag3 (M), Gzmb (N), Cx3cr1 (O), and Ly6c2 (P) in the representative clusters in CD8+ T cells (top panels) and CD4+ T cells (bottom panels). (Q) Annotation of 13 T-cell clusters. ∗P < .05; ∗∗∗P < .005. n.s., not significant.
scRNA-seq of donor T cells in vehicle- or CSP-treated recipients. (A-Q) Allo-HCT was performed as in Figure 1A. Mice were treated with vehicle or CSP from days 0 to 13 after allo-HCT (n = 2 per group). Donor T cells were sorted from the spleen on day 14 and subjected to scRNA-seq. (A) A schematic overview of scRNA-seq analysis of donor T cells from the spleen. (B) UMAP for all 16 500 cells with 13 clusters of donor T cells identified using R with extension packages Seurat and PhenoGraph. (C) Compositional differences in T cells between vehicle- and CSP-treated mice were visualized in pseudocolor plots of UMAP. (D) The proportion of cells in each cluster from vehicle- or CSP-treated mice that contributed to each T-cell cluster. (E) Normalized gene-expression of molecules representative for T-cell differentiation, exhaustion, cytokine/chemokine receptors, and functions was projected on the UMAP. (F) Heatmap of top 283 DEGs in CD8+ T cells. Log2 normalized expression values for distinguishing genes among CD8+ T clusters. Characteristic molecules that were upregulated in each cluster are highlighted on the left of the heatmap. (G-P) Violin plots show expression of Tcf7 (G), Tox (H), Pdcd1 (I), Tigit (J), Havcr2 (K), Entpd1 (L), Lag3 (M), Gzmb (N), Cx3cr1 (O), and Ly6c2 (P) in the representative clusters in CD8+ T cells (top panels) and CD4+ T cells (bottom panels). (Q) Annotation of 13 T-cell clusters. ∗P < .05; ∗∗∗P < .005. n.s., not significant.
In CD8+ T cells, the C9 cluster was characterized by the high expression of Tcf7 and Slamf6 together with Tox and Pdcd1 expression, whereas C8 was characterized by expression of Tox, Pdcd1, Tigit, Havcr2, Entpd1, and Lag3, with low Tcf7 expression, indicating that C9 and C8 represented Tpex and terminal Tex, respectively (Figure 2E-M). C1 was characterized by the high expression of inhibitory receptors such as Havcr2, Entpd1, and Lag3, lower levels of Tox, Pdcd1, and Tigit than C8 and C9, and no expression of Slamf6 or Tcf7 (Figure 2E-M). Furthermore, C1 highly expressed cytotoxic molecules such as Gzmb and Prf1 together with Cx3cr1 and genes belonging to “natural killer (NK)-cell mediated cytotoxicity” pathway (Figure 2E-F, N-O; supplemental Figure 2A). Thus, C1 represented effector–like transitory Tex.15,25-27Ly6c2 was a specific marker of C1, distinguishing it from other clusters of CD8+ T cells (Figure 2P). We therefore named the C1 cluster CNI–induced transitory Tex (transitory-Tex-CNI) (Figure 2Q).
In CD4+ T cells, the C11 cluster expressed modest levels of Tox and Pdcd1 and high levels of Tcf7, suggesting that C11 represented the CD4+ counterpart of Tpex (Figure 2E-I). C10 expressed lower levels of Tcf7 and comparable levels of inhibitory receptors except Havcr2 compared with that of C11 (Figure 2K). Analogous to CD8+ transitory-Tex-CNI (C1), C10 also upregulated Gzmb, Cx3cr1, and Ly6c2 and was enriched with genes belonging to “NK-cell mediated cytotoxicity,” suggesting that C10 is a CD4+ counterpart of transitory-Tex-CNI (Figure 2N-Q; supplemental Figure 2A-B). Five genes, Ccl5, Gzmb, Ccr2, Ly6c2, and Fgl2, among the top 10 DEGs in C10 and C1 overlapped, further confirming the transcriptomic similarity of C10 and C1 (supplemental Figure 2C-D). Altogether, CSP generates both CD4+ and CD8+ transitory-Tex-CNI expressing both exhaustion- and effector-related molecules and inhibits differentiation of donor T cells to terminal Tex.
CSP induces effector–like transitory Tex
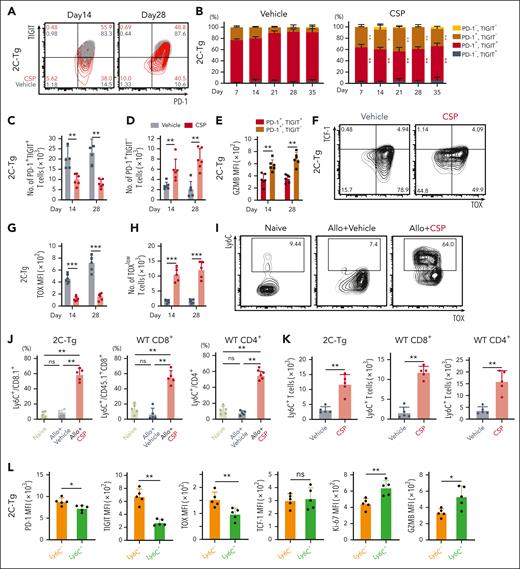
scRNA-seq data indicated that transitory Tex (C1) were distinguished from terminal Tex (C8) by lower expression of Pdcd1, Tigit, and Tox. We performed FCM analysis to confirm these molecular profiles by cell surface profiles. As expected, CSP treatment significantly increased the proportions and absolute numbers of PD-1+TIGIT– 2C-Tg CD8+ T cells, while reducing PD-1+TIGIT+ terminally exhausted 2C-Tg T cells both in the spleen and liver (Figure 3A-D; supplemental Figure 3A-D). PD-1+TIGIT– 2C-Tg T cells expressed significantly higher levels of granzyme B (GZMB) than PD-1+TIGIT+ terminal Tex, confirming that the PD-1+TIGIT– population represented the transitory-Tex-CNI defined by scRNA-seq (Figure 3E; supplemental Figure 3E). Moreover, CSP significantly suppressed TOX expression and increased the absolute numbers of TOXlowTCF-1– 2C-Tg CD8+ T cells in the spleen and liver (Figure 3F-H; supplemental Figure 3F-G). Similar results were obtained in the analysis of CD45.1+ WT CD8+ T cells (supplemental Figure 3H-V). CSP did not significantly alter the expression of PD-1 or TIGIT on donor CD4+ T cells (supplemental Figure 3W). Because CD4+ donor T cells also became functionally exhausted after allo-HCT without CNI treatment, exploration of markers other than TIGIT to discriminate between CD4+ transitory-Tex-CNI and terminal Tex was required (supplemental Figure 1G-J,M).
CSP induced donor transitory-Tex-CNI after allo-HCT. (A-L) Allo-HCT was performed as in Figure 1A. Mice were treated with vehicle or CSP daily from days 0 to 28 after allo-HCT. FCM of donor T cells in the spleen were performed. Contour plots (A) and proportions (B) of PD-1 and TIGIT expression, and absolute numbers of donor PD-1+TIGIT+ (C) and PD-1+TIGIT– (D) cells in 2C-Tg donor T cells (n = 6 per group). (E) MFI of GZMB in 2C-Tg PD-1+TIGIT+ or PD-1+TIGIT– cells on days 14 and 28 after allo-HCT (n = 6 per group). (F) Contour plots of TOX and TCF-1 expression in 2C-Tg donor T cells on day 14 after allo-HCT. MFI of TOX (G) and absolute numbers of TOXlow cells (H) (n = 6 per group). (I) Contour plots of TOX and Ly6C expression in 2C-Tg donor T cells. Proportions (J) and absolute numbers (K) of Ly6C+ cells in 2C-Tg donor T cells (n = 5 per group). (L) MFIs of PD-1, TIGIT, TOX, TCF1, Ki-67, and GZMB in Ly6C+ or Ly6C– donor 2C-Tg T cells in CSP-treated recipients (n = 5 per group). (B-E, G-H) Data from 2 experiments were combined and shown as means ± SEM. (J-L) Data from one of 2 similar experiments were shown as means ± SEM. ∗P < .05; ∗∗P < .01; ∗∗∗P < .005. MFI, mean fluorescence intensity; ns, not significant.
CSP induced donor transitory-Tex-CNI after allo-HCT. (A-L) Allo-HCT was performed as in Figure 1A. Mice were treated with vehicle or CSP daily from days 0 to 28 after allo-HCT. FCM of donor T cells in the spleen were performed. Contour plots (A) and proportions (B) of PD-1 and TIGIT expression, and absolute numbers of donor PD-1+TIGIT+ (C) and PD-1+TIGIT– (D) cells in 2C-Tg donor T cells (n = 6 per group). (E) MFI of GZMB in 2C-Tg PD-1+TIGIT+ or PD-1+TIGIT– cells on days 14 and 28 after allo-HCT (n = 6 per group). (F) Contour plots of TOX and TCF-1 expression in 2C-Tg donor T cells on day 14 after allo-HCT. MFI of TOX (G) and absolute numbers of TOXlow cells (H) (n = 6 per group). (I) Contour plots of TOX and Ly6C expression in 2C-Tg donor T cells. Proportions (J) and absolute numbers (K) of Ly6C+ cells in 2C-Tg donor T cells (n = 5 per group). (L) MFIs of PD-1, TIGIT, TOX, TCF1, Ki-67, and GZMB in Ly6C+ or Ly6C– donor 2C-Tg T cells in CSP-treated recipients (n = 5 per group). (B-E, G-H) Data from 2 experiments were combined and shown as means ± SEM. (J-L) Data from one of 2 similar experiments were shown as means ± SEM. ∗P < .05; ∗∗P < .01; ∗∗∗P < .005. MFI, mean fluorescence intensity; ns, not significant.
scRNA-seq demonstrated that Ly6c2 was upregulated in both CD4+ and CD8+ transitory-Tex-CNI compared with other T-cell populations (supplemental Figure 2D). FCM analysis confirmed that CSP upregulated Ly6C on donor T cells in the spleen and liver, resulting in an increase in the absolute numbers of these cells (Figure 3I-K; supplemental Figure 3X-Z). Ly6C+ 2C-Tg CD8+ donor T cells expressed significantly lower levels of PD-1, TIGIT, and TOX, higher levels of Ki67 and GZMB, and a comparable level of TCF-1 compared with those of Ly6C– cells (Figure 3L). Ly6C+ WT CD4+ donor T cells also expressed significantly higher levels of Ki67 and GZMB than Ly6C– cells, indicating that Ly6C is a common marker of CD4+ and CD8+ transitory-Tex-CNI endowed with proliferative and effector functions (supplemental Figure 3A).
Impacts of other immunosuppressants on the differentiation of transitory Tex after allo-HCT
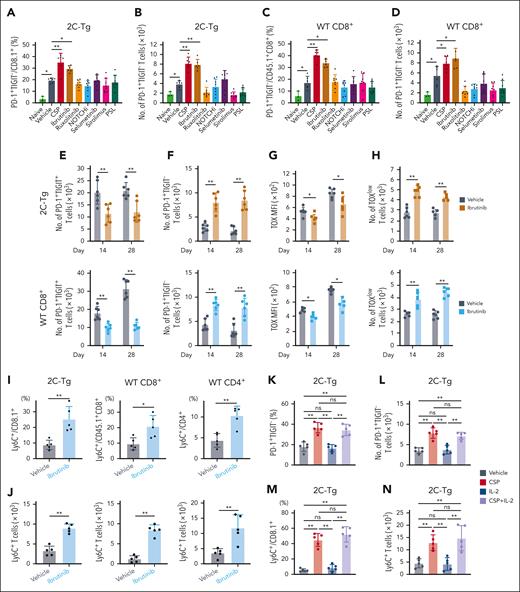
CNIs inhibit nuclear factor of activated T cells (NFAT) that restrain T-cell exhaustion in chronic viral infection and tumor models.28,29 We, then, investigated whether transitory Tex could be induced thorough NFAT inhibition by CSP or by general T cell suppression. To address this issue, mice were treated with variable classes of immunosuppressants, including ibrutinib, ruxolitinib (JAK1/2 inhibitor), DAPT (NOTCH inhibitor), selumetinib (MEK inhibitor), sirolimus (mTOR inhibitor), or prednisolone, which have been shown to ameliorate GVHD.30-36 FCM analysis on day 14 demonstrated that only CSP and ibrutinib significantly increased PD-1+TIGIT– 2C-Tg and WT CD8+ T cells (Figure 4A-D). Ibrutinib also significantly reduced the numbers of terminal Tex and expression levels of TOX, while increasing transitory Tex, TOXlow T cells, and Ly6C+ transitory Tex (Figure 4E-J). It should be noted that ibrutinib also inhibits NFAT, suggesting that NFAT inhibition is essential for induction of transitory Tex.37,38 We, then, tested whether low-dose interleukin (IL)-2 could impact the development of transitory Tex in CNI-treated recipients. Although it has been reported that IL-2 administration rescues CNI–induced IL-2 reduction and potentially modifies T-cell exhaustion,39-41 we found that low-dose IL-2 had no effect on the development of transitory Tex in either CNI-treated or vehicle-treated recipients (Figure 4K-N; supplemental Figure 4A-D). Altogether, we concluded that suppression of the NFAT-Tox axis, but not the reduction of IL-2 transcript level, which is also a downstream event of NFAT activation, plays a critical role in the CNI-induced development of transitory Tex.
Ibrutinib and CSP, but not other immunosuppressants, induced donor transitory-Tex-CNI after allo-HCT. (A-N) Allo-HCT was performed as in Figure 1A. (A-D) Mice were administered with vehicle or indicated reagents daily from days 0 to 14 after allo-HCT. Proportions and absolute numbers of PD-1+TIGIT– in 2C-Tg (A-B) and WT (C-D) CD8+ T cells in the spleen on day 14 (n = 6 per group). (E-J) Mice were administered with vehicle or ibrutinib daily from days 0 to 28 after allo-HCT. Absolute numbers of PD-1+TIGIT+ cells (E) and PD-1+TIGIT– cells (F), MFI of TOX (G), and absolute numbers of TOXlow cells (H), in 2C-Tg (top) and WT (bottom) CD8+ donor T cells in the spleen on days 14 and 28 (n = 6 per group). Proportions (I) and absolute numbers (J) of Ly6C+ T cells in 2C-Tg and WT CD8+ and WT CD4+ donor T cells on day 28 (n = 5 per group). (K-N) Mice were administered daily with vehicle or CSP in combination with low-dose IL-2 or alone from days 0 to 14 after allo-HCT. Proportions (K) and absolute numbers (L) of PD-1+TIGIT– and proportions (M) and absolute numbers (N) of Ly6C+ cells in 2C-Tg donor T cells in the spleen on day 14 (n = 5 per group). (A-H) Data from 2 experiments were combined and shown as means ± SEM. (I-N) Data from one of 2 similar experiments were shown as means ± SEM. ∗P < .05; ∗∗P < .01. MFI, mean fluorescence intensity; ns, not significant.
Ibrutinib and CSP, but not other immunosuppressants, induced donor transitory-Tex-CNI after allo-HCT. (A-N) Allo-HCT was performed as in Figure 1A. (A-D) Mice were administered with vehicle or indicated reagents daily from days 0 to 14 after allo-HCT. Proportions and absolute numbers of PD-1+TIGIT– in 2C-Tg (A-B) and WT (C-D) CD8+ T cells in the spleen on day 14 (n = 6 per group). (E-J) Mice were administered with vehicle or ibrutinib daily from days 0 to 28 after allo-HCT. Absolute numbers of PD-1+TIGIT+ cells (E) and PD-1+TIGIT– cells (F), MFI of TOX (G), and absolute numbers of TOXlow cells (H), in 2C-Tg (top) and WT (bottom) CD8+ donor T cells in the spleen on days 14 and 28 (n = 6 per group). Proportions (I) and absolute numbers (J) of Ly6C+ T cells in 2C-Tg and WT CD8+ and WT CD4+ donor T cells on day 28 (n = 5 per group). (K-N) Mice were administered daily with vehicle or CSP in combination with low-dose IL-2 or alone from days 0 to 14 after allo-HCT. Proportions (K) and absolute numbers (L) of PD-1+TIGIT– and proportions (M) and absolute numbers (N) of Ly6C+ cells in 2C-Tg donor T cells in the spleen on day 14 (n = 5 per group). (A-H) Data from 2 experiments were combined and shown as means ± SEM. (I-N) Data from one of 2 similar experiments were shown as means ± SEM. ∗P < .05; ∗∗P < .01. MFI, mean fluorescence intensity; ns, not significant.
Adoptive transfer of transitory-Tex-CNI develops cGVHD
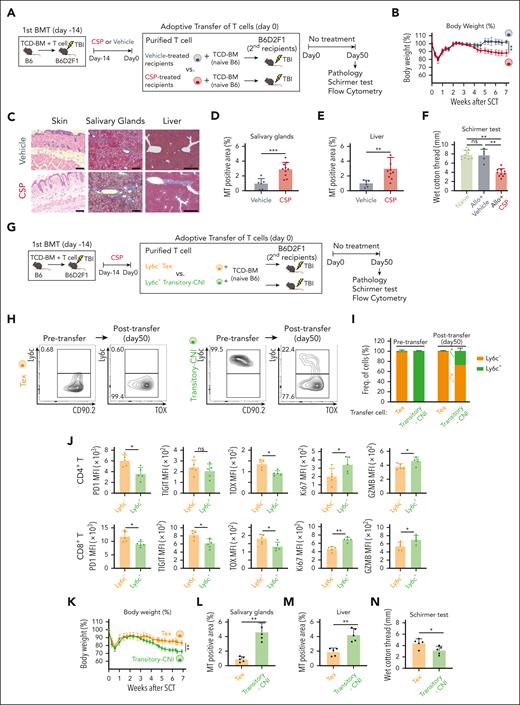
To evaluate the role of transitory-Tex-CNI in GVHD pathophysiology, we performed adoptive transfer experiments. A total of 1 × 10⁶ T cells harvested from vehicle- or CSP-treated recipients 14 days after allo-HCT were combined with TCD-BM from naïve B6 mice and adoptively transferred into lethally irradiated secondary B6D2F1 recipients (Figure 5A). We found that very small numbers of donor Tregs were contained in the adoptive transfer graft irrespective of CSP administration (supplemental Figure 5A-B). We also found that although PD-1, Tim-3, and TIGIT were expressed on the surface of Tregs, CNI did not change the expression levels of these exhaustion markers on Tregs, suggesting that CSP did not impact the quantity or function of Tregs in this adoptive transfer model (supplemental Figure 5C-D). Transfer of T cells from CSP-treated animals induced body weight loss (Figure 5B) and typical pathological features of cGVHD, such as subcutaneous fat loss and fibrosis in the skin, salivary glands, and liver in mice receiving CSP-treated T cells (Figure 5C-E). Tear secretion volume was significantly decreased in these mice (Figure 5F). In contrast, these changes were not observed in the recipients of the T cells from vehicle-treated recipients, indicating that CNI maintained donor T-cell alloreactivity to induce cGVHD after transfer (Figure 5B-F).
Transitory-Tex-CNI contributed to the development of cGVHD. (A-F) The first allo-HCT was performed as in Figure 1A, and recipient mice were orally administered with CSP or vehicle from days 0 to 14 after allo-HCT. A total of 1 × 10⁶ T cells purified from vehicle- or CSP-treated recipients 14 days were adoptively transferred into lethally irradiated secondary B6D2F1 recipients together with TCD-BM from naïve B6 mice. The secondary recipients were left untreated after transfer. (A) A schematic overview of the experiments. (B) Change in body weight after the transfer (n = 5 per group). (C) H&E staining of the skin (original magnification ×200; scale bar, 100 μm), and MT staining of the salivary glands (priginal magnification ×200; scale bar, 100 μm) and liver (original magnification ×40; scale bar, 500 μm) on day 50 after transfer. Proportions of fibrotic area to the whole section area in the salivary glands (D) and liver (E). (F) The volume of tear secretion was measured on day 50 after the transfer. (G-N) The first allo-HCT was performed as in Figure 1A and mice were administered with CSP from days 0 to 14 after allo-HCT. A total of 2 × 10⁶ Ly6C+ (transitory-Tex-CNI) or Ly6C– (terminal Tex) donor T cells were sorted from CSP-treated recipients on day 14 and adoptively transferred into irradiated secondary recipients together with TCD-BM from naïve B6 mice. (G) A schematic overview of the experiments. Representative contour plots (H) and proportions (I) of Ly6C expression on donor T cells before or 50 days after the transfer of terminal Tex and transitory-Tex-CNI (n = 5 per group). (J) Expression of indicated molecules in Ly6C+ and Ly6C– CD4+ (top) and CD8+ (bottom) T cells in the spleen on day 50 after the adoptive transfer of transitory-Tex-CNI. (K) Change in body weight after adoptive transfer (n = 5 per group). Fibrotic area in the salivary glands (L) and liver (M), and volume of tear secretion (N) were evaluated 50 days after the adoptive transfer. (B,I-K) Data from one of 2 similar experiments were shown as means ± SEM. (D-F, L-N) Data from 2 independent experiments were combined and shown as means ± SEM. ∗P < .05; ∗∗P < .01; ∗∗∗P < .005. ns, not significant.
Transitory-Tex-CNI contributed to the development of cGVHD. (A-F) The first allo-HCT was performed as in Figure 1A, and recipient mice were orally administered with CSP or vehicle from days 0 to 14 after allo-HCT. A total of 1 × 10⁶ T cells purified from vehicle- or CSP-treated recipients 14 days were adoptively transferred into lethally irradiated secondary B6D2F1 recipients together with TCD-BM from naïve B6 mice. The secondary recipients were left untreated after transfer. (A) A schematic overview of the experiments. (B) Change in body weight after the transfer (n = 5 per group). (C) H&E staining of the skin (original magnification ×200; scale bar, 100 μm), and MT staining of the salivary glands (priginal magnification ×200; scale bar, 100 μm) and liver (original magnification ×40; scale bar, 500 μm) on day 50 after transfer. Proportions of fibrotic area to the whole section area in the salivary glands (D) and liver (E). (F) The volume of tear secretion was measured on day 50 after the transfer. (G-N) The first allo-HCT was performed as in Figure 1A and mice were administered with CSP from days 0 to 14 after allo-HCT. A total of 2 × 10⁶ Ly6C+ (transitory-Tex-CNI) or Ly6C– (terminal Tex) donor T cells were sorted from CSP-treated recipients on day 14 and adoptively transferred into irradiated secondary recipients together with TCD-BM from naïve B6 mice. (G) A schematic overview of the experiments. Representative contour plots (H) and proportions (I) of Ly6C expression on donor T cells before or 50 days after the transfer of terminal Tex and transitory-Tex-CNI (n = 5 per group). (J) Expression of indicated molecules in Ly6C+ and Ly6C– CD4+ (top) and CD8+ (bottom) T cells in the spleen on day 50 after the adoptive transfer of transitory-Tex-CNI. (K) Change in body weight after adoptive transfer (n = 5 per group). Fibrotic area in the salivary glands (L) and liver (M), and volume of tear secretion (N) were evaluated 50 days after the adoptive transfer. (B,I-K) Data from one of 2 similar experiments were shown as means ± SEM. (D-F, L-N) Data from 2 independent experiments were combined and shown as means ± SEM. ∗P < .05; ∗∗P < .01; ∗∗∗P < .005. ns, not significant.
We then performed adoptive transfer experiments of transitory-Tex-CNI. A total of 1 × 10⁶ CD90+Ly6C+ transitory-Tex-CNI or CD90+Ly6C– terminal Tex harvested from the spleens on day 14 after allo-HCT were combined with TCD-BM from naïve B6 mice and adoptively transferred into lethally irradiated secondary B6D2F1 recipients (Figure 5G). The majority of transferred transitory-Tex-CNI differentiated into Ly6C– terminal Tex by 50 days after transfer, whereas ∼25% of these cells remained Ly6C+ (Figure 5H-I) We confirmed that significant numbers of CTV-labeled transitory Tex divided a few times early after adoptive transfer, suggesting that these cells were actively proliferating (supplemental Figure 5E-F). These Ly6C+ T cells persisted 50 days after the transfer and maintained the phenotype of transitory-Tex-CNI, as described before (Figure 5J). In contrast, transferred Ly6C– terminal Tex remained Ly6C– terminal Tex phenotype (Figure 5H-I). Recipients of transitory-Tex-CNI presented severe weight loss and pathological features of cGVHD in the skin, salivary glands, and liver (Figure 5K-M; supplemental Figure 5G). The volume of tear secretion was also significantly decreased in these mice (Figure 5N). Altogether, these data confirmed that transitory-Tex-CNI maintained the potential to develop cGVHD.
Transitory-Tex-CNI maintain responsiveness to PD-1 blockade after allo-HCT
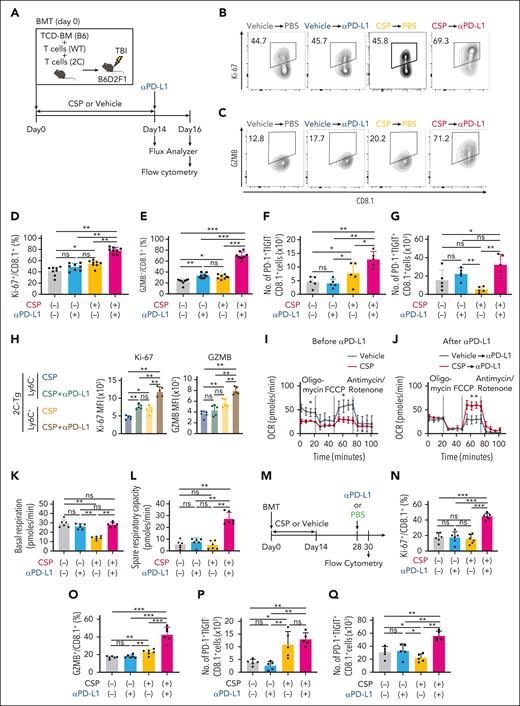
It has been reported that Tpex and transitory Tex, but not terminal Tex, were activated and proliferated in response to PD-1 blockade in tumor and chronic infection models.15,42-44 To test whether transitory-Tex-CNI could contribute to graft-versus-leukemia (GVL) effects induced by PD-1 blockade after allo-HCT, mice were treated with CSP or vehicle from days 0 to 14 and given intraperitoneal (IP) injection with αPD-L1 on day 14 (Figure 6A). FCM analysis of donor T cells in the spleen on day 16 after allo-HCT demonstrated that αPD-L1 induced minimum upregulation of GZMB without a proliferative response in 2C-Tg CD8+ donor T cells in vehicle-treated mice (Figure 6B-E). In contrast, αPD-L1 induced a significant proliferative response and marked increase in GZMB expression in 2C-Tg CD8+ donor T cells in CSP-treated mice. Moreover, αPD-L1 induced a slight increase in PD-1+TIGIT– cells and marked expansion of PD-1+TIGIT+ terminal Tex, indicating that αPD-L1 promoted the self-renewal of transitory-Tex-CNI and at the same time the differentiation of these cells into terminal Tex (Figure 6F-G). We found that αPD-L1 enhanced the expression of Ki-67 and GZMB preferentially in Ly6C+ cells, further confirming the advantage of Ly6C as a marker of transitory-Tex-CNI (Figure 6H). αPD-L1 also upregulated Ki-67 and GZMB in WT CD8+ donor T cells and induced a proliferative response in WT CD4+ donor T cells in CSP-treated, but not vehicle-treated, allogeneic recipients (supplemental Figure 6A-C). When the recipients were treated with ibrutinib instead of CSP, transitory Tex again maintained responsiveness to PD-1 blockade (supplemental Figure 6D-E). To test whether Ly6C is a universal marker of responsive cells after PD-1 blockade, we tested whether Ly6C+ T cells in naïve B6 mice could respond to PD-1 blockade. We found that neither Ly6C+ nor Ly6C– T cells expressed PD-1 or TIGIT, and the expression of Ki-67 and GZMB on Ly6C+ CD4+ and CD8+ T cells was not changed by injection of αPD-L1, indicating that αPD-L1-responsible Ly6C+ transitory Tex were specifically induced in allogeneic recipients treated with CSP (supplemental Figure 6F-K).
Transitory-Tex-CNI maintained responsiveness to PD-1 blockade. (A-L) Allo-HCT was performed as in Figure 1A. Recipients were administered with CSP or vehicle from days 0 to 14 followed by intraperitoneal injection of αPD-L1 on day 14 after allo-HCT. (A) A schematic overview of experiments. (B-G) FCM of donor T cells in the spleen were performed on day 16. Contour plots (B-C) and proportions of Ki-67 (D) and GZMB (E) expression in 2C-Tg CD8+ donor T cells. Absolute numbers of PD-1+TIGIT– (F) and PD-1+TIGIT+ (G) in 2C-Tg CD8+ donor T cells (n = 5 per group). (H) MFI of Ki-67 and GZMB in Ly6C+ and Ly6C– 2C-Tg CD8+ donor T cells from CSP-treated recipients with or without injection of αPD-L1 on 16 days (n = 5 per group). (I-L) OCR of purified donor T cells were evaluated using a Seahorse XF analyzer. OCR curves before (day 14; I) and after (day 16; J) αPD-L1. Basal respiration (K) and spare respiratory capacity (L) on day 16 after allo-HCT. (M-Q) Recipient mice were administered with CSP or vehicle from days 0 to 14 and intraperitoneally injected with αPD-L1 on day 28 after allo-HCT. FCM analysis of donor T cells in the spleen were performed on day 30. (M) A schematic overview of the experiments. Proportions of Ki-67 (N) and GZMB (O) expression, and absolute numbers of PD-1+TIGIT– (P) and PD-1+TIGIT+ (Q) in 2C-Tg CD8+ donor T cells (n = 5 per group). (D-G, K, L, N-Q) Data from 2 independent experiments were combined and shown as means ± SEM. (H-J) Data from one of 3 similar experiments were shown as means ± SEM. ∗P < .05; ∗∗P < .01; ∗∗∗P < .005. MFI, mean fluorescence intensity; ns, not significant; OCR, oxygen consumption rate.
Transitory-Tex-CNI maintained responsiveness to PD-1 blockade. (A-L) Allo-HCT was performed as in Figure 1A. Recipients were administered with CSP or vehicle from days 0 to 14 followed by intraperitoneal injection of αPD-L1 on day 14 after allo-HCT. (A) A schematic overview of experiments. (B-G) FCM of donor T cells in the spleen were performed on day 16. Contour plots (B-C) and proportions of Ki-67 (D) and GZMB (E) expression in 2C-Tg CD8+ donor T cells. Absolute numbers of PD-1+TIGIT– (F) and PD-1+TIGIT+ (G) in 2C-Tg CD8+ donor T cells (n = 5 per group). (H) MFI of Ki-67 and GZMB in Ly6C+ and Ly6C– 2C-Tg CD8+ donor T cells from CSP-treated recipients with or without injection of αPD-L1 on 16 days (n = 5 per group). (I-L) OCR of purified donor T cells were evaluated using a Seahorse XF analyzer. OCR curves before (day 14; I) and after (day 16; J) αPD-L1. Basal respiration (K) and spare respiratory capacity (L) on day 16 after allo-HCT. (M-Q) Recipient mice were administered with CSP or vehicle from days 0 to 14 and intraperitoneally injected with αPD-L1 on day 28 after allo-HCT. FCM analysis of donor T cells in the spleen were performed on day 30. (M) A schematic overview of the experiments. Proportions of Ki-67 (N) and GZMB (O) expression, and absolute numbers of PD-1+TIGIT– (P) and PD-1+TIGIT+ (Q) in 2C-Tg CD8+ donor T cells (n = 5 per group). (D-G, K, L, N-Q) Data from 2 independent experiments were combined and shown as means ± SEM. (H-J) Data from one of 3 similar experiments were shown as means ± SEM. ∗P < .05; ∗∗P < .01; ∗∗∗P < .005. MFI, mean fluorescence intensity; ns, not significant; OCR, oxygen consumption rate.
Impairment of mitochondrial fitness is a fundamental change during the development of terminal Tex.15,42-46 We next evaluated oxidative phosphorylation in donor T cells isolated from vehicle- or CSP-treated allogeneic recipients before (day 14) and after (day 16) αPD-L1 treatment. T cells from vehicle-treated recipients showed low mitochondrial spare respiratory capacity, and αPD-L1 treatment did not affect the basal respiration or spare respiratory capacity in these mice, indicating profoundly impaired mitochondrial fitness in terminal Tex after allo-HCT (Figure 6I-L). Donor T cells from CSP-treated recipients demonstrated significantly suppressed basal respiration, as previously shown in tacrolimus-treated T cells (Figure 6I-K).47 αPD-L1 dramatically enhanced the spare respiratory capacity of donor T cells in CSP-treated, but not in vehicle-treated recipients, indicating that CSP treatment preserved mitochondrial fitness and responsiveness to αPD-L1 administration (Figure 6I,J,L).
We found that PD-1+TIGIT– 2C-Tg T cells persisted during prolonged CSP treatment from days 0 to 28 and αPD-L1 injection on day 28 induced proliferation, activation, and differentiation of 2C-Tg donor CD8+ T cells (supplemental Figure 6L-P). More importantly, PD-1+TIGIT– transitory-Tex-CNI persisted at 16 days after the cessation of CSP treatment and maintained responsiveness to αPD-L1 administration, suggesting that transitory-Tex-CNI differentiated early after allo-HCT persisted for a long period and maintained alloreactivity of donor T cells (Figure 6M-Q). We confirmed that PD-1+TIGIT– and Ly6C+ transitory Tex persisted on day 160 after allo-HCT (supplemental Figure 6Q-T). In summary, we concluded that transitory Tex induced by CSP treatment early after transplant persist for at least 4 months after discontinuing CSP treatment.
Transitory-Tex-CNI play a critical role in GVL effects induced by PD-1 blockade
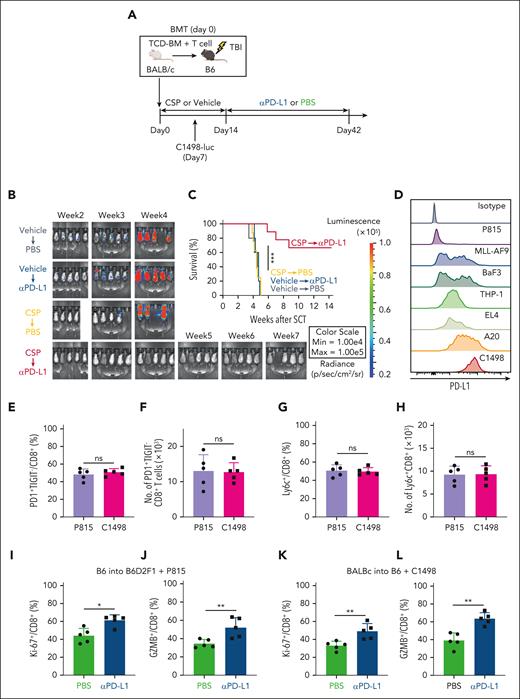
Next, we tested whether transitory-Tex-CNI could contribute to GVL effects induced by αPD-L1 treatment using another allo-HCT model, in which B6 recipients received transplantation from BALB/c donors and injected with recipient-type luciferase-expressing C1498 myeloid leukemia cells (C1498-luc) (Figure 7A). First, we confirmed that CSP again induced PD-1+TIGIT– and TOXlow TCF-1– donor CD8+ transitory-Tex-CNI with proliferative and effector makers in this model (supplemental Figure 7A-G). C1498-luc-inoculated recipients were treated with vehicle or CSP from days 0 to 14, followed by intraperitoneal injection with PBS or αPD-L1 3 times weekly from days 14 to 42 (Figure 7A). Bioluminescence imaging showed that leukemia cells expanded in vehicle-treated mice, and all the mice died by week 5 after allo-HCT, irrespective of αPD-L1 treatment (Figure 7B-C). Pretreatment with CSP dramatically enhanced the antileukemic effects of αPD-L1, and 70% of recipients treated with CSP in combination with αPD-L1 eradicated C1498-luc cells, indicating that transitory-Tex-CNI played a critical role in GVL effects induced by PD-1 blockade. (Figure 7B-C). Because C1498 cells strongly express PD-L1, we tested whether PD-L1 expression on leukemia cells could impact on the development of transitory Tex after allo-HCT (Figure 7D). We evaluated PD-L1 on various mouse leukemia cells and found that P815 cells had minimal expression of PD-L1 (Figure 7D). CSP induced transitory Tex in both P815- and C1498-inoculated recipients at a similar level (Figure 7E-H). Furthermore, transitory Tex in both groups were similarly activated by PD-1 blockade, indicating that PD-L1 on leukemia cells is not involved in the development of transitory Tex after allo-HCT (Figure 7I-L).
Transitory-Tex-CNI contributed to GVL effects after PD-1 blockade. (A-C, E-H, K-L) Lethally irradiated B6 mice received transplantation with TCD-BM combined with purified T cells from BALB/c donors and administered with CSP or vehicle from days 0 to 14 after allo-HCT. Recipient mice were IV injected with 5 × 10⁴ (CSP-treated recipients) or 1 × 10⁶ (vehicle-treated recipients) C1498-luc cells on day 7 after allo-HCT. (A-C) Recipients were intraperitoneally injected with αPD-L1 twice a week from days 14 to 42 after allo-HCT. (A) A schematic overview of the experiments. (B) Leukemia growth was evaluated using bioluminescence imaging weekly after leukemia injection. (C) Survival curves of recipients (n = 9 per group). (D) Histograms show PD-L1 expression on various mouse leukemia cells. (E-J) In P815 group, lethally irradiated B6D2F1 mice received transplantation with TCD-BM combined with purified T cells from B6 donors and administered with CSP from days 0 to 14 after allo-HCT. Recipient mice were IV injected with 5 × 10⁴ P815 cells on day 7 after allo-HCT. Proportions (E) and absolute numbers (F) of PD-1+TIGIT– cells, and proportions (G) and absolute numbers (H) of Ly6C+ cells in CD8+ donor T cells on day 16 after allo-HCT (n = 5 per group). P815-innoculated (I-J) and C1498-innoculated (K-L) recipients were intraperitoneally injected with αPD-L1 or PBS on day 14 after allo-HCT. Proportions of Ki-67 (I,K) and GZMB (J,L) expression in CD8+ donor T cells on day 16 after allo-HCT (n = 5 per group). (C) Data from 2 independent experiments were combined and shown as means ± SEM. (E-L) Data from one of 2 similar experiments were shown as means ± SEM. ∗P < .05; ∗∗P < .01; ∗∗∗P < .005. ns, not significant.
Transitory-Tex-CNI contributed to GVL effects after PD-1 blockade. (A-C, E-H, K-L) Lethally irradiated B6 mice received transplantation with TCD-BM combined with purified T cells from BALB/c donors and administered with CSP or vehicle from days 0 to 14 after allo-HCT. Recipient mice were IV injected with 5 × 10⁴ (CSP-treated recipients) or 1 × 10⁶ (vehicle-treated recipients) C1498-luc cells on day 7 after allo-HCT. (A-C) Recipients were intraperitoneally injected with αPD-L1 twice a week from days 14 to 42 after allo-HCT. (A) A schematic overview of the experiments. (B) Leukemia growth was evaluated using bioluminescence imaging weekly after leukemia injection. (C) Survival curves of recipients (n = 9 per group). (D) Histograms show PD-L1 expression on various mouse leukemia cells. (E-J) In P815 group, lethally irradiated B6D2F1 mice received transplantation with TCD-BM combined with purified T cells from B6 donors and administered with CSP from days 0 to 14 after allo-HCT. Recipient mice were IV injected with 5 × 10⁴ P815 cells on day 7 after allo-HCT. Proportions (E) and absolute numbers (F) of PD-1+TIGIT– cells, and proportions (G) and absolute numbers (H) of Ly6C+ cells in CD8+ donor T cells on day 16 after allo-HCT (n = 5 per group). P815-innoculated (I-J) and C1498-innoculated (K-L) recipients were intraperitoneally injected with αPD-L1 or PBS on day 14 after allo-HCT. Proportions of Ki-67 (I,K) and GZMB (J,L) expression in CD8+ donor T cells on day 16 after allo-HCT (n = 5 per group). (C) Data from 2 independent experiments were combined and shown as means ± SEM. (E-L) Data from one of 2 similar experiments were shown as means ± SEM. ∗P < .05; ∗∗P < .01; ∗∗∗P < .005. ns, not significant.
Discussion
Although the heterogeneity of Tex has been actively studied in chronic infection and solid tumor models, our understanding of the role of Tex in immune-mediated diseases is limited. Recent studies showed that Tpex maintained the responsiveness to self-antigens and contribute to the development of type 1 diabetes.48,49 Donor CD8+ T cells differentiated into TCF-1+ Tpex after major histocompatibility complex (MHC)-matched experimental HCT, whereas their functions and the impact of CNIs, always given in clinical HCT, on Tex differentiation remained largely unknown.50 In this study, Tpex was only a minor population and the vast majority of donor T cells had differentiated into terminal Tex early after MHC-mismatched HCT, in contrast to a previous study demonstrating predominant differentiation of donor T cells into Tpex after MHC-matched HCT.50 Administration of CD40 agonistic antibodies promoted the transition from Tpex to terminal Tex after MHC-matched HCT,50 suggesting that more potent TCR signaling in MHC-mismatched HCT in our model may be responsible for the induction of rapid and robust terminal Tex differentiation. We found that the administration of CSP suppressed TOX expression in donor T cells and inhibited terminal Tex differentiation after MHC-mismatched HCT. It has been shown that tacrolimus suppressed T-cell expression of TCF-1, a central regulator of Tpex maintenance, in chronic viral infection, suggesting that CNIs could inhibit the persistence of Tpex by downregulating TCF-1 after allo-HCT.28
CD8+CX3CR1+ Tex comprises the following 2 distinct subsets in chronic viral infection: intermediate (transitory) Tex and killer cell lectin-like receptor-expressing Tex (TexKLR).51 Trajectory analysis demonstrated that TexKLR is another end point of Tex differentiation and intermediate Tex are progenitors of canonical terminal Tex and TexKLR.51 In this study, Ly6C+CX3CR1+ donor T cells differentiated into Ly6C–CX3CR1lowTOXhigh terminal Tex, whereas a subset of these cells self-renewed after adaptive transfer, indicating that these cells represent transitory cells but not terminally differentiated cells. Thus, we annotated these cells as transitory-Tex-CNI. A previous study showed that donor-derived CD44lowCD62Lhigh postmitotic donor T cells emerged after MHC-matched HCT expressed stem-like markers such as Sca-1 and CD122 and developed acute GVHD-like pathology after adoptive transfer into the secondary recipients.52 Unlike these stem-like memory cells, transitory-Tex-CNI were CD44highCD62Llow without expression of stem-like markers and induced chronic, but not acute, GVHD after adoptive transfer.
We found that adoptive transfer of donor T cells harvested from the spleens of vehicle-treated recipients on day 14 after the first HCT did not lead to GVHD in secondary recipients, whereas the severity of GVHD in primary recipients continued to increase after day 14. Recently, it has been reported that donor T cells, after initial priming in the secondary lymphoid organs, migrate into the GVHD target tissues and give rise to the progenitor-like tissue-resident T cells, which constitute a small part of the T cells in the target organs and are maintained independently of circulating T cells.53 These tissue-resident T cells in the GVHD target organs may have been involved in the exacerbation of GVHD in the recipients of the first HCT. In this study, we found a novel GVHD–inducible T-cell population, CNI–induced transitory Tex, but it remains to be clarified whether CNIs affect the development of progenitor-like tissue-resident T cells after allo-HCT.
Although the molecular and cellular mechanisms of T-cell exhaustion have been primarily studied in CD8+ T cells, there are a series of reports showing that chronic antigen stimulation induces functionally exhausted CD4+PD-1+TOX+TCF1– T cells.54-57 A recent study showed that naïve CD4 T cells differentiated into PD-1+TCF1+BCL6–/low progenitor CD4+ T cells during chronic viral infection, and these progenitor CD4+ T cells were self-renewing cells and further differentiated into 2 distinctive terminally differentiated populations: TCF-1–BCL6– effector T cells and PD-1+TCF1+BCL6+ follicular helper T cells.58 Although it remained to be determined whether there were functionally exhausted T cells, in this study CD4+ T cells showed reduced proliferation in response to PD-1 blockade, suggesting that CD4+ donor T cells were also exhausted after allo-HCT.
Transitory Tex could be a promising therapeutic target and may serve as a biomarker for predicting the development of cGVHD, leukemia relapse, and efficacy of immunotherapies after allo-HCT. The role of transitory Tex in allo-HCT using posttransplant cyclophosphamide (PTCy) is particularly intriguing, because CNIs are started at various time points during allo-HCT, according to the policies of the physician or the institution.59,60 Earlier initiation of CNIs may induce more transitory Tex and could be associated with the development of cGVHD. Recently, Minnie et al reported that PTCy depleted alloantigen-driven exhausted T cells but spared T cells displaying progenitor-like characteristics.61 They also found that the depletion of exhausted T cells by PTCy was context-dependent, because PTCy enabled donor T-cell exhaustion in the presence of myeloma cells. Whether PTCy combined with CNIs administered at various time points can affect T-cell exhaustion in the presence of tumor cells should be tested in future studies. It has been reported that the response to donor lymphocyte infusion (DLI) is associated with reversal of T-cell exhaustion in leukemia patients, whereas T cells from nonresponders remain to be exhausted after DLI.62,63 It remains to be clarified whether short-term administration of CNIs after DLI can suppress T-cell exhaustion and enhance antileukemia effects. In conclusion, our data will pave a new avenue to explore roles of T-cell exhaustion in immune tolerance and GVHD after allo-HCT.
Acknowledgments
The authors thank Miyuki Azuma (Department of Molecular Immunology, Tokyo Medical and Dental University) for generously providing them with MIH5 hybridoma cells (RCB2324) and C. Yokoyama for technical assistance.
This study was supported by JSPS KAKENHI (21K16259 to T.A., 20K17366 to H.O., 20H00502 and 21K19364 to M.M., 21H02944 and 20K21610 to T. Teshima, and 21K08409 to D.H.), MEXT Quantum Leap Flagship Program (MEXT Q-LEAP; JPMXS0120330644 to M.M.), AMED (JP20ek0510030, JP21zf0127004, JP223fa627005 to M.M.) and Takeda Science Foundation (M.M.). This study was also supported in part, by the Grant for Joint Research Program of the Institute for Genetic Medicine by the Photo-excitonic Project, Hokkaido University, and by the Promotion Project for Young Investigators at Hokkaido University.
Authorship
Contribution: D.H. and T. Teshima developed the conceptual framework of the study, designed the experiments, supervised the experiments, conducted studies, analyzed data, and wrote the manuscript; H.S. conducted studies, analyzed data, and wrote the manuscript; S.H., T. Tateno, Z.Z., S.O., X.C., R.K., N.M., M.O., and Yuta Hasegawa conducted experiments; S.I.K., Y.T., and Yoshinori Hasegawa conducted single-cell RNA sequencing and data analysis; H.O., T.A., and M.M. supervised the experiments and wrote the manuscript; and H.G. and T.E. supervised the experiments.
Conflict-of-interest disclosure: The authors declare no competing financial interests.
Correspondence: Daigo Hashimoto, Department of Hematology, Hokkaido University Faculty of Medicine, N15W7, Kita-ku, Sapporo 060-8638, Japan; e-mail: d5hash@pop.med.hokudai.ac.jp.
References
Author notes
∗T.T. and D.H. contributed equally to this study.
New single-cell RNA sequence data have been deposited at Gene Expression Omnibus and are publicly available as of the date of publication (accession number PRJNA859364). This article does not report original code. All other data needed to evaluate the conclusions in the study are present in the article or the supplemental Materials and Methods. Any additional information required to reanalyze the data reported in this article is available upon request from the corresponding author, Daigo Hashimoto (d5hash@pop.med.hokudai.ac.jp).
The online version of this article contains a data supplement.
There is a Blood Commentary on this article in this issue.
The publication costs of this article were defrayed in part by page charge payment. Therefore, and solely to indicate this fact, this article is hereby marked “advertisement” in accordance with 18 USC section 1734.

This feature is available to Subscribers Only
Sign In or Create an Account Close Modal