

Key Points
CLL LN metabolism characterization based on IBR-treated samples and in vitro stimulation shows glycolytic, TCA, and AA metabolic changes.
Inhibition of glutamine import attenuates microenvironment-induced resistance to venetoclax.

Abstract
Altered metabolism is a hallmark of both cell division and cancer. Chronic lymphocytic leukemia (CLL) cells circulate between peripheral blood (PB) and lymph nodes (LNs), where they receive proliferative and prosurvival signals from surrounding cells. However, insight into the metabolism of LN CLL and how this may relate to therapeutic response is lacking. To obtain insight into CLL LN metabolism, we applied a 2-tiered strategy. First, we sampled PB from 8 patients at baseline and after 3-month ibrutinib (IBR) treatment, which forces egress of CLL cells from LNs. Second, we applied in vitro B-cell receptor (BCR) or CD40 stimulation to mimic the LN microenvironment and performed metabolomic and transcriptomic analyses. The combined analyses indicated prominent changes in purine, glucose, and glutamate metabolism occurring in the LNs. CD40 signaling mostly regulated amino acid metabolism, tricarboxylic acid cycle (TCA), and energy production. BCR signaling preferably engaged glucose and glycerol metabolism and several biosynthesis routes. Pathway analyses demonstrated opposite effects of in vitro stimulation vs IBR treatment. In agreement, the metabolic regulator MYC and its target genes were induced after BCR/CD40 stimulation and suppressed by IBR. Next, 13C fluxomics performed on CD40/BCR-stimulated cells confirmed a strong contribution of glutamine as fuel for the TCA cycle, whereas glucose was mainly converted into lactate and ribose-5-phosphate. Finally, inhibition of glutamine import with V9302 attenuated CD40/BCR-induced resistance to venetoclax. Together, these data provide insight into crucial metabolic changes driven by the CLL LN microenvironment. The prominent use of amino acids as fuel for the TCA cycle suggests new therapeutic vulnerabilities.
Introduction
Altered metabolism has become a hallmark of cancer.1 Recent advances have shown that the Warburg dogma, meaning a preferred use of glycolysis instead of mitochondrial oxidative phosphorylation (OXPHOS) to provide cellular energy, does not actually hold for all cancers. In particular, indolent hematologic cancers can deviate from this pattern; OXPHOS is still quite active in these cancers,2,3 and the Warburg effect can be modified by external signaling.4-6 Chronic lymphocytic leukemia (CLL) is a type of cancer that relies heavily on the tumor microenvironment (TME).7-9 CLL cells circulate between peripheral blood (PB) and lymph nodes (LNs), which presumably necessitates high metabolic plasticity.10 In LNs, CLL cells receive proliferative and prosurvival signals from surrounding cells (eg, via the B-cell receptor [BCR] and CD40) and become activated and less sensitive to drugs.11-16 CLL also has altered metabolism in PB; a previous study showed that quiescent PB CLL cells had higher OXPHOS than healthy B cells, but not higher glycolysis.17 Moreover, in vitro studies have indicated TME signals promote metabolic changes in CLL cells, such as glutathione synthesis, glucose metabolism, and ATP production.18-21
Previous reports have shown that altered metabolism might be related to drug resistance and relapse. For example, induced resistance to the widely used BCL2 inhibitor venetoclax (VEN) was accompanied by profound metabolic changes in cell line models.22 VEN has become a prime therapeutic strategy in CLL and induces direct cell death and rapid decline of leukemic cell counts; however, emerging resistance is a growing clinical problem.23,24 This may be linked to the fact that residual LN sites are frequently observed under VEN treatment.25,26 Another successful drug applied in CLL is the Bruton tyrosine kinase (BTK) inhibitor ibrutinib (IBR), which blocks adhesion in and migration to LN sites.27,28 Under IBR treatment, patients initially undergo lymphocytosis,29 but the circulating cells in PB are deprived from signals they normally receive in the LNs, and as a result, they eventually die. Thus, the circulating inert cells under IBR treatment also lack metabolic changes that are linked with the state of active proliferation in the LN TME.30 Importantly, under prolonged IBR treatment, relapse and outgrowth of resistant clones are also unmet clinical problems.31
The goal of this investigation was to obtain detailed insight into the altered metabolism of LNs compared with PB in CLL and how this may be related to therapeutic responses. Such insight is currently lacking. Because it is technically difficult to obtain direct insight into CLL LN metabolism, we applied a 2-tiered strategy. Using PB samples taken from patients before and after treatment with IBR, we obtained a differential analysis of cells lacking LN signals.28 This was combined with in vitro stimulation by BCR and CD40, which have been shown to be prominent signals triggering various survival and metabolic pathways (eg, NF-κB, mTOR, and AKT).13,32-34 Thus, we indirectly mapped the metabolism of CLL in the TME, as well as the effects of IBR treatment. In addition, we explored the effects of targeting CLL metabolism in a model for resistance to VEN. The data obtained provide insight into glycolytic pathway engagement as well as OXPHOS and TCA cycle activity in the LN setting. A major finding was the extent to which glutamine import fuels the TCA cycle upon stimulation and that blocking its import attenuated VEN resistance.
Materials and methods
Patient materials
After written informed consent, patient blood was obtained during diagnostic or follow-up procedures at the Departments of Hematology and Pathology of the Academic Medical Center Amsterdam or the Southampton General Hospital (supplemental Table 1). The studies were approved by the Academic Medical Center Ethical Review Board or the institutional review boards at the University of Southampton and conducted in agreement with the Declaration of Helsinki. Blood mononuclear cells of patients with CLL, obtained after Ficoll density gradient centrifugation (Pharmacia Biotech), were cryopreserved and stored as previously described.35 Expression of CD5 and CD19 on leukemic cells was assessed by flow cytometry. Most CLL samples included in this study contained 85% to 99% CD5+/CD19+ cells.
Cell culture, fluorescence-activated cell sorting analyses, in vitro activation of CLL cells, metabolic analyses by Seahorse, metabolomic and fluxomic analyses, RNA sequencing, quantitative polymerase chain reaction, and various means of data analyses are described in detail in the data supplement.
Statistics
The paired-sample t test was used to analyze paired observations. ns means the difference is not significant and P value is > .05. *P < .05, **P < .01, ***P < .001, ****P < .0001.
Results
LN CLL cells and emigrants are more metabolically active than CLL cells about to reenter LNs
CLL cells in PB can be distinguished by their surface expression of CD5 and CXCR4, with CD5highCXCR4dim cells designated as recent emigrants from LNs and CD5dimCXCR4high as older less vital cells that need to immigrate to lymphoid tissue.10,32 Metabolic differences were analyzed by gating the outer 10% fractions corresponding to these 2 populations (Figure 1A). CLL cells harvested from actual LN samples were analyzed in parallel in order to assess to what extent the emigrant vs immigrant CLL populations in PB resembled the features of LN residents. As a first step in metabolic profiling, 2 key aspects of cellular metabolism were measured: uptake of a labeled form of glucose (2-NBDG) and quantification of mitochondrial mass using MitoTracker Green.36-38 Although differences among patients were observed, glucose uptake and mitochondrial mass were consistently higher in CD5highCXCR4dim cells, as well as in the paired LN samples, compared with CD5dimCXCR4high cells (Figure 1B). This indicates that glycolytic and mitochondrial metabolism of CLL cells are enhanced in those CLL cells that recently left the LNs compared with those in long-term circulating PB.
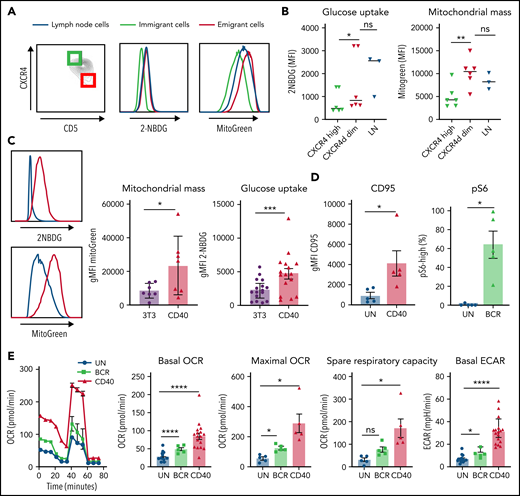
Increased mitochondrial mass and glucose uptake in LNs and recent emigrants and effects of CD40 and BCR triggering on CLL metabolism. (A) Combined staining of CXCR4 and CD5 within the CD19/CD5+ CLL population from PB mononuclear cells (PBMCs) to discriminate LN immigrants (CD5dim and CXCR4high) and emigrants (CD5high and CXCR4dim). The outer 10% of these populations is indicated by green and red squares, respectively. Glucose uptake and mitochondrial mass were measured with 2-NBDG and MitoTracker Green, respectively, in the upper and lower 10% percentiles of these populations and in paired LN samples (blue lines). Representative histograms are shown. (B) Summary data of glucose uptake and mitochondrial mass (PBMCs, n = 6; LNs, n = 3; paired samples are indicated). Data are represented as individual values and mean. Statistical analyses were performed with paired Student t test. (C) CLL cells were stimulated by coculture on CD40L-expressing 3T3 cells (CD40) or by beads coated with anti–immunoglobulin M (IgM; BCR) for 24 hours. Glucose uptake and mitochondrial mass were measured by fluorescence-activated cell sorting (FACS) with 2-NBDG or MitoTracker Green, respectively, in unstimulated cells (3T3; blue line) or CD40-stimulated cells (red line). Representative histograms are shown. Relative glucose uptake and mitochondrial mass of CD40-stimulated cells compared with 3T3 condition were plotted in bar graph (2-NBDG, n = 16; MitoGreen, n = 7). (D) CD95 was measured after 24 hours of CD40 stimulation by FACS (n = 5), and pS6 was measured after 30 minutes of BCR stimulation by FACS (n = 5). (E) MitoStress test was performed on Seahorse XF analyzer in CLL cells activated by CD40 (n = 17)/BCR (n = 5) for 24 hours and in the corresponding unstimulated control cells (UN). Representative oxygen consumption rate (OCR) curve is shown. Basal OCR, maximal OCR, and spare respiratory capacity were calculated in 5 independent experiments. Extracellular acidification rate (ECAR) was also measured, and basal ECAR is shown. Data arerepresented as mean ± standard error of the mean of the indicated individual values. Statistical analyses were performed with paired Student t test. *P < .05, **P < .01, ***P < .001, ****P < .0001. MFI, mean fluorescence intensity; ns, not significant.
Increased mitochondrial mass and glucose uptake in LNs and recent emigrants and effects of CD40 and BCR triggering on CLL metabolism. (A) Combined staining of CXCR4 and CD5 within the CD19/CD5+ CLL population from PB mononuclear cells (PBMCs) to discriminate LN immigrants (CD5dim and CXCR4high) and emigrants (CD5high and CXCR4dim). The outer 10% of these populations is indicated by green and red squares, respectively. Glucose uptake and mitochondrial mass were measured with 2-NBDG and MitoTracker Green, respectively, in the upper and lower 10% percentiles of these populations and in paired LN samples (blue lines). Representative histograms are shown. (B) Summary data of glucose uptake and mitochondrial mass (PBMCs, n = 6; LNs, n = 3; paired samples are indicated). Data are represented as individual values and mean. Statistical analyses were performed with paired Student t test. (C) CLL cells were stimulated by coculture on CD40L-expressing 3T3 cells (CD40) or by beads coated with anti–immunoglobulin M (IgM; BCR) for 24 hours. Glucose uptake and mitochondrial mass were measured by fluorescence-activated cell sorting (FACS) with 2-NBDG or MitoTracker Green, respectively, in unstimulated cells (3T3; blue line) or CD40-stimulated cells (red line). Representative histograms are shown. Relative glucose uptake and mitochondrial mass of CD40-stimulated cells compared with 3T3 condition were plotted in bar graph (2-NBDG, n = 16; MitoGreen, n = 7). (D) CD95 was measured after 24 hours of CD40 stimulation by FACS (n = 5), and pS6 was measured after 30 minutes of BCR stimulation by FACS (n = 5). (E) MitoStress test was performed on Seahorse XF analyzer in CLL cells activated by CD40 (n = 17)/BCR (n = 5) for 24 hours and in the corresponding unstimulated control cells (UN). Representative oxygen consumption rate (OCR) curve is shown. Basal OCR, maximal OCR, and spare respiratory capacity were calculated in 5 independent experiments. Extracellular acidification rate (ECAR) was also measured, and basal ECAR is shown. Data arerepresented as mean ± standard error of the mean of the indicated individual values. Statistical analyses were performed with paired Student t test. *P < .05, **P < .01, ***P < .001, ****P < .0001. MFI, mean fluorescence intensity; ns, not significant.
CD40 and BCR signaling both enhance CLL metabolism
To investigate separately which LN signals could contribute to enhanced metabolism, PB CLL cells were activated in vitro by CD40 or BCR stimulation, 2 key activation signals believed to occur in the LNs. We applied coculture of CLL cells with CD40L-expressing 3T3 fibroblasts or anti-IgM–coated beads. As a first assessment of metabolic changes, glucose uptake and mitochondrial mass were measured after CD40 stimulation. Both parameters were increased in stimulated cells, recapitulating the metabolic profile of CLL cells resident in the LNs (Figure 1C). Response to both CD40 and BCR stimulation was confirmed by analysis of the activation markers CD95 and pS6, respectively. CD95 was significantly increased on the surface of CLL cells after 24 hours of CD40 stimulation, and pS6 phosphorylation levels were also significantly enhanced after 30 minutes of BCR stimulation (Figure 1D). To further investigate the metabolic capacity of CLL cells in response to in vitro LN stimuli, OCR and ECAR were measured as indicators of OXPHOS and glycolysis, respectively, in a Seahorse XF analyzer. Especially CD40- but also BCR-stimulated CLL cells showed increased basal and maximal OCRs as well as spare respiratory capacity, consistent with enhanced OXPHOS in these cells. Basal ECAR was also enhanced by both stimuli, showing that lactate production and therefore glycolysis are enhanced in CLL cells by these signals (Figure 1E). Similar changes in glucose uptake, mitochondrial mass, and OCR/ECAR could be observed in healthy donor PB B cells (supplemental Figure 1), indicating that these were not CLL-specific.
Effect of in vivo IBR treatment on response to in vitro CD40 or BCR stimulation
Because of sample scarcity and practical difficulties to directly study metabolism in fresh LN samples, in vitro stimulation of PB CLL cells with CD40 and BCR stimulation was used as an indirect way to study metabolism in LN CLL cells. Paired PB was sampled from 8 patients before and after 3 months of IBR treatment. The BTK inhibitor IBR forces CLL cells to egress from LNs.39 Consequently, PB CLL cells from IBR-treated patients are not able to return to the LNs and be reactivated, resulting in a no-LN phenotype. In contrast, CLL cells from baseline samples represent a more active phenotype, because these cells have been recirculating between PB and LNs. The baseline samples and samples from patients after 3-month IBR treatment were then stimulated in vitro by CD40 or BCR to mimic the LN microenvironment, and metabolomic analysis was performed with liquid chromatography–mass spectrometry (Figure 2A). In this setup, we hypothesized that opposite effects of IBR vs CD40/BCR would reflect the actual CLL metabolic status in the LNs.
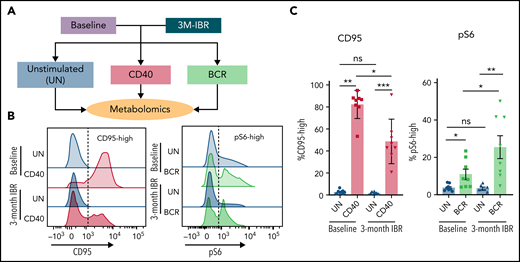
Effects of IBR treatment on in vitro CD40 and BCR stimulation. (A) As an indirect way to study LN metabolism, PB mononuclear cell samples from patients with CLL at baseline or after 3-month treatment with IBR were restimulated with in vitro CD40/BCR by coculture on CD40L-expressing 3T3 cells (CD40) or by anti-IgM–coated beads (BCR) for 24 hours. Metabolomic analysis was subsequently performed in these samples. (B) CD95 was measured after 24 hours of CD40 stimulation, and pS6 was measured after 30-minute BCR stimulation. Representative histograms are shown for all conditions. (C) Percentages of CD95-high cells and pS6-high cells were calculated (n = 8). Data are shown as mean ± standard error of the mean of the indicated individual values. Statistical analyses were performed with paired Student t test. *P < .05, **P < .01, ***P < .001. ns, not significant.
Effects of IBR treatment on in vitro CD40 and BCR stimulation. (A) As an indirect way to study LN metabolism, PB mononuclear cell samples from patients with CLL at baseline or after 3-month treatment with IBR were restimulated with in vitro CD40/BCR by coculture on CD40L-expressing 3T3 cells (CD40) or by anti-IgM–coated beads (BCR) for 24 hours. Metabolomic analysis was subsequently performed in these samples. (B) CD95 was measured after 24 hours of CD40 stimulation, and pS6 was measured after 30-minute BCR stimulation. Representative histograms are shown for all conditions. (C) Percentages of CD95-high cells and pS6-high cells were calculated (n = 8). Data are shown as mean ± standard error of the mean of the indicated individual values. Statistical analyses were performed with paired Student t test. *P < .05, **P < .01, ***P < .001. ns, not significant.
Controls for response to the stimuli were CD95 induction after CD40 and pS6 after BCR. CD95 was upregulated in both baseline and IBR-treated samples stimulated by CD40L, indicating CD40 signaling could be activated in both groups. However, the fraction of CD95-high cells after CD40 stimulation in IBR-treated samples was lower (Figure 2B), indicating that the response to CD40 in vitro stimulation was reduced after in vivo IBR treatment. Basal pS6 was decreased by IBR treatment, showing that IBR treatment suppressed BCR signaling. After in vitro BCR stimulation, pS6 was upregulated in both baseline and IBR-treated samples, and the percentage of pS6-high cells was higher in IBR-treated samples, suggesting that CLL cells can be activated by BCR after IBR treatment (Figure 2C). Further analysis of pS6, p-Btk and p-Erk revealed that BCR stimulation in IBR-treated samples was sometimes more prominent than at baseline (supplemental Figure 2), which corroborates previous findings where increases in p-Syk after IBR were noted.40
Metabolomic analyses reveal specific signatures of CD40 and BCR stimulation and IBR treatment
Using liquid chromatography–mass spectrometry, 79 metabolites were analyzed on patient samples before and after IBR treatment, with and without CD40 or BCR stimulation in vitro (Figure 2A). Metabolomic data were analyzed with Tercen software and are represented by z score and ordered according to hierarchic clustering. The global overview showed that each patient displayed a specific metabolic profile, presumably resulting from distinct physiology, diet, life style, etc. (Figure 3).41,42 Nevertheless, specific metabolic signatures could be identified in the different groups. Increased metabolic activity in CLL induced by CD40/BCR was confirmed by metabolomics, as both CD40- and BCR-stimulated CLL cells showed increased abundance of various metabolites compared with unstimulated cells. The metabolites enhanced by CD40 or BCR were quite distinct, which was further explored in subsequent pathway analyses. IBR treatment also resulted in changes in metabolite abundance. Overall, most of the metabolite levels were decreased by IBR treatment (Figure 3 black boxes), according to a no-LN phenotype. The group of metabolites that increased after CD40 stimulation in baseline samples was attenuated in IBR-treated samples (Figure 3 yellow boxes). In contrast, for BCR-stimulated cells, the levels of a subgroup of metabolites were higher upon IBR-treated samples (Figure 3 green boxes), in line with previous observations of increased pS6 signaling in those samples. In accordance with the distinct response to BCR triggering between patients with and without IgVh mutation,43 principle component analyses showed that BCR stimulation separated these groups (supplemental Figure 3), but only partially. This could be due to the substantial individual variation among this limited patient cohort and precluded detailed analyses of these differences beyond the PCA level. Notch mutations, which might potentially also affect the metabolism of CLL,21 were not detected in these samples. In summary, metabolomic analyses suggested that both CD40 and BCR stimulation enhanced metabolism of CLL cells, whereas IBR had opposite effects. In addition, IBR treatment dampened the response to CD40 stimulation but increased the response to BCR triggering.
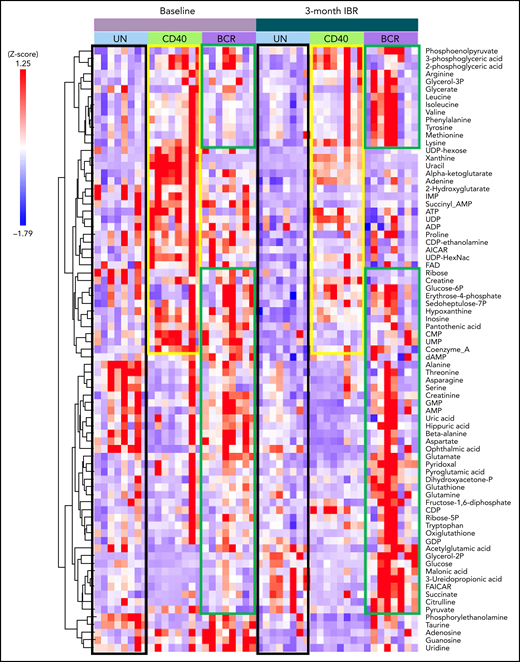
Metabolomic analysis of IBR-treated patient samples stimulated by CD40 or BCR. Heat map showing the abundance of 79 metabolites in CLL cells from 8 samples from patients with CLL at baseline or after 3-month treatment with IBR, which were restimulated by in vitro CD40/BCR for 24 hours. Metabolomic data were analyzed with Tercen software (https://www.tercen.com/) and are represented by z score followed with h clustering. Metabolic signatures induced by IBR treatment and CD40 and BCR stimulation are highlighted in black, yellow, and green, respectively. UN, unstimulated control.
Metabolomic analysis of IBR-treated patient samples stimulated by CD40 or BCR. Heat map showing the abundance of 79 metabolites in CLL cells from 8 samples from patients with CLL at baseline or after 3-month treatment with IBR, which were restimulated by in vitro CD40/BCR for 24 hours. Metabolomic data were analyzed with Tercen software (https://www.tercen.com/) and are represented by z score followed with h clustering. Metabolic signatures induced by IBR treatment and CD40 and BCR stimulation are highlighted in black, yellow, and green, respectively. UN, unstimulated control.
Metabolic pathways enhanced by CD40 or BCR are mirrored by IBR
Because metabolites upregulated by CD40 and BCR stimulation were distinct, enrichment analysis was performed to assess whether different metabolic pathways were affected.
To further analyze the strongest effects as observed in the global heat map (Figure 3), baseline samples stimulated with CD40 and IBR-treated samples stimulated with BCR were compared with baseline samples, respectively. Significantly increased metabolites were selected for pathway analysis (Figure 4A-B volcano plots; supplemental Tables 2 and 3). Metabolite enrichment analysis was performed with MetaboAnalyst software, and the top 15 upregulated pathways in each condition were selected. Six pathways were upregulated by both CD40 and BCR (purine metabolism, Warburg effect, lysine degradation, glucose-alanine cycle, glutamate metabolism, and alanine metabolism), and the other pathways were distinct in each group (Figure 4C). In summary, both stimuli increased catabolic pathways, such as pyruvate metabolism and the TCA cycle, in the case of CD40-stimulated cells, and glycolysis and mitochondrial electron transport chain, in the case of BCR. Regarding anabolic pathways, the effects of CD40 stimulation were upregulation of amino sugar metabolism, pyrimidine metabolism, and serine/glycine synthesis pathway, whereas the effects of BCR were centered on triacylglycerol and cardiolipid biosynthesis, gluconeogenesis, and glycerolipid metabolism.
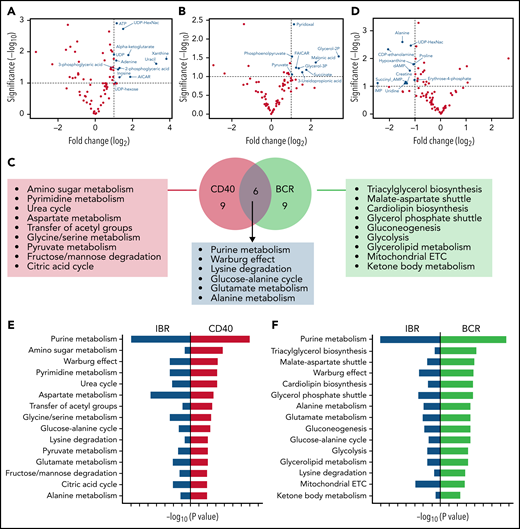
Metabolic pathways upregulated by CD40 or BCR were mirrored by IBR. Volcano plots of significantly increased metabolites in baseline+CD40 vs baseline cells (A) or 3-month IBR treatment+BCR vs baselineUN (B). Statistical analyses were performed with paired Student t test with selective threshold P value < .1 and fold change (FC) > 2 (n = 8). (C) Venn diagram showing the metabolic pathways upregulated by CD40 or BCR stimulation. Pathway analysis was performed from significantly increased metabolites in baseline+CD40 vs baseline or 3-month IBR treatment+BCR vs baseline (n = 8) using MetaboAnalyst software (https://www.metaboanalyst.ca/). (D) Volcano plot of significantly decreased metabolites by 3-month IBR treatmentvs baseline. Statistical analyses were performed with paired Student t test with threshold P value < .1 and FC > 2 (n = 8). Top 15 pathways upregulated by CD40 (E) or BCR (F), which were downregulated by IBR treatment. ETC, electron transport chain.
Metabolic pathways upregulated by CD40 or BCR were mirrored by IBR. Volcano plots of significantly increased metabolites in baseline+CD40 vs baseline cells (A) or 3-month IBR treatment+BCR vs baselineUN (B). Statistical analyses were performed with paired Student t test with selective threshold P value < .1 and fold change (FC) > 2 (n = 8). (C) Venn diagram showing the metabolic pathways upregulated by CD40 or BCR stimulation. Pathway analysis was performed from significantly increased metabolites in baseline+CD40 vs baseline or 3-month IBR treatment+BCR vs baseline (n = 8) using MetaboAnalyst software (https://www.metaboanalyst.ca/). (D) Volcano plot of significantly decreased metabolites by 3-month IBR treatmentvs baseline. Statistical analyses were performed with paired Student t test with threshold P value < .1 and FC > 2 (n = 8). Top 15 pathways upregulated by CD40 (E) or BCR (F), which were downregulated by IBR treatment. ETC, electron transport chain.
To investigate the pathways downregulated by IBR, significantly decreased metabolites were selected from pairwise comparisons between baseline and IBR-treated samples (Figure 4D). Enrichment analysis was performed in significantly downregulated metabolites. Comparison of the results of pathway analysis in CD40, BCR, or IBR conditions showed that pathways upregulated by CD40 or BCR were downregulated by IBR treatment (Figure 4E-F). Thus, pathway analyses based on metabolomics confirmed that IBR has opposite effects on CLL metabolism to those induced by in vitro CD40/BCR stimulation.
Gene sets upregulated in LN CLL and after stimulation with BCR or CD40 are downregulated during IBR treatment
To assess whether the observed changes in metabolic pathways in CLL were accompanied by equivalent changes in gene expression, RNA sequencing data of CD40- and BCR-stimulated CLL cells generated in house were aligned with published gene expression data sets of paired PB and LN CLL cells44 and with baseline, 1-month, and 6-month IBR samples30 (supplemental Figure 4A shows workflow). The fold change in gene expression of the various data sets is displayed in Figure 5. Key genes related to the pathways upregulated by CD40 and BCR in metabolomics were analysed (Figure 4C). These included the purinosome45 and glutamate metabolism (Figure 5A), glutamine metabolism (Figure 5B), glycolysis (Figure 5C) and OXPHOS (Figure 5D). Clearly, these metabolic gene sets were upregulated in LNs compared with PB samples. CD40 and BCR signaling upregulated subsets of these genes, but effects generally overlapped (Figure 5A). Glucose and glutamine metabolism–related genes were upregulated by both BCR and CD40 stimulation. Importantly, the patterns of gene induction in LN, BCR, and CD40 data sets were to a large extent mirrored by downregulation of gene expression in the IBR-treated samples. Of the genes encoding glutamine transporters, SCL1A5 was upregulated in LN, BCR, and CD40 samples and downregulated in IBR-treated samples (Figure 5B). Most glycolysis-associated genes behaved similarly, with the notable exception of SLC2A1, encoding glucose transporter 1 (Figure 5C). Similar opposite changes with reduced expression upon stimulation and in LNs were seen for the phosphatase LHPP and SDHA (Figure 5D). Interestingly, these genes have been reported as tumor suppressors in distinct cancer types.46,47
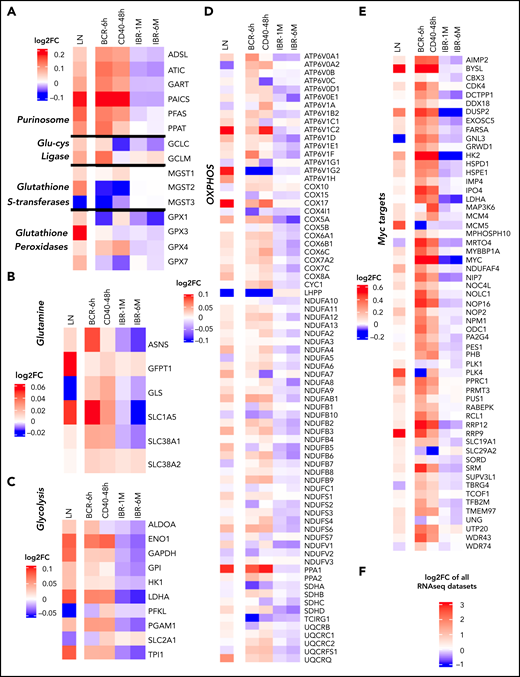
RNA sequencing (RNAseq) profiling of metabolism-related genes in CD40- and BCR-stimulated CLL cells. RNAseq was performed from CLL cells stimulated by BCR (n = 12; 6 hours) or CD40 (n = 4; 48 hours). Log2 fold change (FC) in the expression of selected genes was calculated relative to the corresponding unstimulated controls with differential gene expression analysis by DESeq2. The FC in expression of the same genes in LNs compared with PB was calculated from a previously published microarray data set (n = 17)44 with differential gene expression analysis by R2 software (https://r2.amc.nl). Additionally, the FC of gene expression in 1-month (n = 18) and 6-month (n = 17) IBR-treated patient samples compared with baseline samples was calculated from a previously published data set30 with differential gene expression analysis by DESeq2. Gene expression data were compiled and analyzed according the scheme in supplemental Figure 3A and depicted as log2 FC compared with the reference data sets: PB vs LNs, unstimulated vs BCR or CD40, and baseline vs IBR for 1 or 6 months. The PB/LN data set derived from micorarrays44 was scaled differently (shown next to each heat map) than the RNAseq data. The heat map shows the log2 FCs of gene expressions in the 3 groups in overlapping metabolic pathways of CD40 and BCR stimulation, including purinosome, glutamate-cysteine ligase, glutathione S-transferases and glutathione peroxidases (A), glutamine metabolism (B), glycolysis (C), and OXPHOS-related genes (D). (E) MYC and MYC target genes. (F) Scale for all the heat maps of RNAseq data sets.
RNA sequencing (RNAseq) profiling of metabolism-related genes in CD40- and BCR-stimulated CLL cells. RNAseq was performed from CLL cells stimulated by BCR (n = 12; 6 hours) or CD40 (n = 4; 48 hours). Log2 fold change (FC) in the expression of selected genes was calculated relative to the corresponding unstimulated controls with differential gene expression analysis by DESeq2. The FC in expression of the same genes in LNs compared with PB was calculated from a previously published microarray data set (n = 17)44 with differential gene expression analysis by R2 software (https://r2.amc.nl). Additionally, the FC of gene expression in 1-month (n = 18) and 6-month (n = 17) IBR-treated patient samples compared with baseline samples was calculated from a previously published data set30 with differential gene expression analysis by DESeq2. Gene expression data were compiled and analyzed according the scheme in supplemental Figure 3A and depicted as log2 FC compared with the reference data sets: PB vs LNs, unstimulated vs BCR or CD40, and baseline vs IBR for 1 or 6 months. The PB/LN data set derived from micorarrays44 was scaled differently (shown next to each heat map) than the RNAseq data. The heat map shows the log2 FCs of gene expressions in the 3 groups in overlapping metabolic pathways of CD40 and BCR stimulation, including purinosome, glutamate-cysteine ligase, glutathione S-transferases and glutathione peroxidases (A), glutamine metabolism (B), glycolysis (C), and OXPHOS-related genes (D). (E) MYC and MYC target genes. (F) Scale for all the heat maps of RNAseq data sets.
MYC is a master regulator of metabolism,48 and we therefore probed for potential activation of MYC-dependent gene expression (https://www.gsea-msigdb.org/gsea/msigdb/cards/HALLMARK_MYC_TARGETS_V2.html) in these data sets. This revealed that MYC targets were upregulated in LN CLL cells and upon CD40/BCR stimulation and downregulated under IBR treatment (Figure 5E). Consistent with this, MYC RNA expression was increased in LN vs PB cells and was reduced under IBR treatment. Quantitative polymerase chain reaction analysis confirmed that in vitro BCR or CD40 stimulation increased expression of MYC RNA as well as selected target genes (LDHA, HK2, and ODC1; supplemental Figure 4B). Combined, these data showed the key metabolic regulator MYC and its targets were upregulated in LN CLL cells.
Glutamine is the main fuel of the TCA cycle in CD40- and BCR-stimulated CLL cells
The data so far demonstrate that both glucose and glutamine metabolism were upregulated in CLL cells stimulated in vitro with CD40 or BCR, mimicking the LN microenvironment. The contribution of these substrates in the fueling of CLL cells was investigated in stimulated cells cultured in the presence of either 13C6-glucose or 13C5-glutamine, followed by fluxomic analyses (Figure 6A). Uptake of either glucose or glutamine by unstimulated PB CLL cells was very low, with 13C labeling close to 0 for most metabolites, which indicates that these cells have very low metabolic activity (Figure 6B). This is consistent with the results previously obtained regarding OCR and ECAR (Figure 1). In contrast, both CD40 and BCR stimulation increased the uptake and utilization of glucose and glutamine (Figure 6B). 13C labeling from glucose was detected in all glycolytic intermediates analyzed in both CD40- and BCR-stimulated CLL cells, showing that glucose was catalyzed to lactate and also partly converted to acetyl-CoA, which entered the TCA cycle (Figure 6B). An important fraction of citrate was enriched with 13C from glucose, and the labeling was also detected, but to a lower extent, in the other TCA intermediates analyzed. These results corroborate that stimulated cells increase glycolytic flux compared with unstimulated controls, as previously suggested by increased 2-NBDG uptake and ECAR. Labeling from glucose was also increased in several metabolites of the pentose phosphate pathway, such as ribose-5-phosphate and sedoheptulose 7-phosphate (Figure 6B, supplemental Figure 5A).
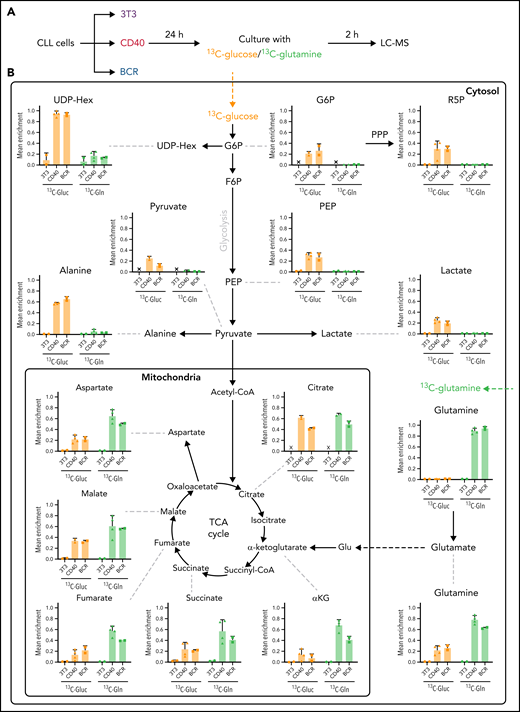
Glucose and glutamine fueling of CD40- and BCR-stimulated CLL cells. (A) Fluxomic analysis was performed in CLL cells stimulated with CD40 or BCR for 24 hours and subsequently cultured in medium containing either 5 mM of 13C6-glucose or 1 mM of 13C5-glutamine for 2 hours. For glucose-tracing experiments, culture medium also contained 1 mM of unlabeled glutamine and 5 μM carnitine, whereas in glutamine-tracing experiments, culture medium also contained 5 mM of unlabeled glucose and 5 μM carnitine. Incorporation of 13C in metabolic intermediates was analyzed by liquid chromatography–mass spectrometry (LC-MS). (B) Analysis of incorporation of 13C from fully labeled glucose (orange bars) or glutamine (green bars) in CLL cells after CD40 or BCR stimulation. Mean enrichment indicates the fraction of a given metabolite that was labeled, being 1 the total amount of that metabolite within a sample (3T3, n = 2; CD40, n = 4; BCR, n = 2; from 2 independent experiments). PPP, pentose phosphate pathway.
Glucose and glutamine fueling of CD40- and BCR-stimulated CLL cells. (A) Fluxomic analysis was performed in CLL cells stimulated with CD40 or BCR for 24 hours and subsequently cultured in medium containing either 5 mM of 13C6-glucose or 1 mM of 13C5-glutamine for 2 hours. For glucose-tracing experiments, culture medium also contained 1 mM of unlabeled glutamine and 5 μM carnitine, whereas in glutamine-tracing experiments, culture medium also contained 5 mM of unlabeled glucose and 5 μM carnitine. Incorporation of 13C in metabolic intermediates was analyzed by liquid chromatography–mass spectrometry (LC-MS). (B) Analysis of incorporation of 13C from fully labeled glucose (orange bars) or glutamine (green bars) in CLL cells after CD40 or BCR stimulation. Mean enrichment indicates the fraction of a given metabolite that was labeled, being 1 the total amount of that metabolite within a sample (3T3, n = 2; CD40, n = 4; BCR, n = 2; from 2 independent experiments). PPP, pentose phosphate pathway.
The contribution of glutamine to the TCA cycle was much higher in both BCR- and CD40-stimulated cells. Most of the glutamine was firstly converted to glutamate and then to α-ketoglutarate, and all intermediates of the TCA cycle were highly enriched with 13C from glutamine (Figure 6B). More detailed analyses of isotopologue forms is described in supplemental Figure 6.
Glutamine also contributed to glutathione synthesis in both CD40- and BCR-stimulated cells, which was shown by enrichment of 13C from glutamine in both reduced and oxidized glutathione, indicating that glutamine is used not only as an energy fuel but also as precursor of biosynthetic processes in stimulated CLL cells (supplemental Figure 5B). Combined, these data reveal that glucose is mainly used for glycolysis and the pentose phosphate pathway, and glutamine is the key metabolite to fuel the TCA cycle in LN CLL cells.
Glutamine import inhibition relieves VEN resistance caused by CD40/BCR stimulation
VEN, a BCL-2 inhibitor, is a widely used drug for the treatment of patients with CLL. Despite its clinical success, the issue of resistance is an emerging clinical need. We and others have applied in vitro CD40 and BCR stimulation as a model for VEN resistance that may occur in (residual) LN sites.35,49-51 The SLC1A5 gene, encoding the glutamine transporter ASCT2, was clearly induced by BCR/CD40 stimulation and in LNs but downregulated upon IBR treatment (Figure 5B). Therefore, V9302, a reported inhibitor of ASCT2,52 was applied in conjunction with BCR and CD40 stimulation. V9302 decreased basal and maximal OCR in both CD40- and BCR-stimulated cells. The effect was more pronounced in BCR-stimulated cells and at the level of ATP-linked respiration. The increase in ECAR induced by CD40 or BCR was not affected by V9302 (Figure 7A-C). CLL cells stimulated by CD40/BCR in the presence or absence of V9302 were then tested for sensitivity to VEN. As expected, especially CD40- but also BCR-stimulated CLL cells displayed resistance to VEN.16,49,53 When glutamine uptake was inhibited by adding V9302 during stimulation (supplemental Figure 7), CLL cells became resensitized to VEN in both CD40- and BCR-stimulated samples (Figure 7D). The reduction in 50% inhibitory concentration was ∼100-fold for both stimuli. Importantly, viability compared with unstimulated cells was not affected by V9302, and the compound also did not affect CD40/BCR stimulation itself, mitochondrial mass, or glucose uptake (supplemental Figure 8). In conclusion, these data show that inhibition of glutamine metabolism could be a potential way to attenuate TME-induced VEN resistance.
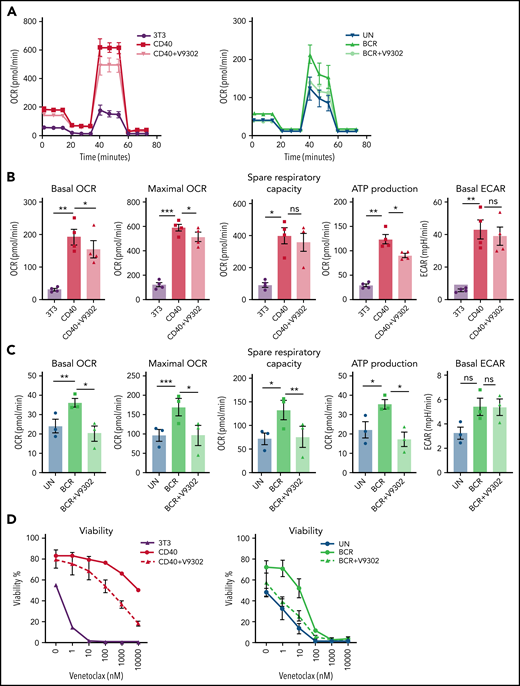
Glutamine transport inhibition impairs CLL metabolism and VEN resistance. (A-C) CLL cells were stimulated by CD40 (n = 4) or BCR (n = 3) for 24 hours in the presence or absence of V9302, an inhibitor of the glutamine transporter ASCT2. CLL cells were harvested, and MitoStress tests were performed on Seahorse XF analyzer. Basal and maximal OCR were measured, and spare respiration capacity and ATP-linked respiration were calculated and plotted, as was basal ECAR. (D) CD40- or BCR-stimulated CLL cells in absence/presence of V9302 (both n = 6) were collected and incubated with various concentrations of the Bcl-2 inhibitor VEN for 24 hours; cells were then stained by DioC6/TO-PRO-3 for viability measurement. Statistical analyses were performed with paired Student t test. *P < .05, **P < .01, ***P < .001. ns, not significant; UN, unstimulated control.
Glutamine transport inhibition impairs CLL metabolism and VEN resistance. (A-C) CLL cells were stimulated by CD40 (n = 4) or BCR (n = 3) for 24 hours in the presence or absence of V9302, an inhibitor of the glutamine transporter ASCT2. CLL cells were harvested, and MitoStress tests were performed on Seahorse XF analyzer. Basal and maximal OCR were measured, and spare respiration capacity and ATP-linked respiration were calculated and plotted, as was basal ECAR. (D) CD40- or BCR-stimulated CLL cells in absence/presence of V9302 (both n = 6) were collected and incubated with various concentrations of the Bcl-2 inhibitor VEN for 24 hours; cells were then stained by DioC6/TO-PRO-3 for viability measurement. Statistical analyses were performed with paired Student t test. *P < .05, **P < .01, ***P < .001. ns, not significant; UN, unstimulated control.
Discussion
This study provides a first broad overview of metabolic changes occurring in the LN microenvironment in CLL, based on actual LN samples and complementary data sets from patients before and after IBR treatment and from in vitro stimulations mimicking the LN situation. This setup allowed for the study of metabolic features that are specific to the CLL cells resident in the LNs, compared with CLL cells that cannot return to the LNs after IBR treatment. Metabolic changes occurring in LN CLL cells were recapitulated in vitro by stimulation of CD40 and BCR in CLL cells from PB, whereas IBR treatment showed opposite effects, together providing indirect insight into the LN metabolism. In vivo IBR treatment enhanced BCR responsiveness both in terms of signaling and metabolic profile, in accordance with previous reports that IBR therapy releases leukemic surface IgM from antigen drive in patients with CLL.40 In contrast, decreased CD40 responsiveness was noted upon IBR in vivo treatment, which warrants further investigation.53
Both in vitro CD40 and BCR stimulation increased the mitochondrial respiratory capacity of CLL cells, as well as their glycolytic activity, and several catabolic and anabolic pathways upregulated after stimulation were shared between the 2 stimuli, consistent with increased use of glucose and glutamine/glutamate in stimulated cells.
Analysis of expression of key metabolism-related genes by RNA sequencing indicated that transcriptional programs in the LNs largely overlap those found after CD40 and BCR stimulation, despite some differences between BCR and CD40. The opposite transcriptional changes found in IBR-treated patients provide in vivo support for the validity of the overall approach. The complementary data sets have not yet been fully explored, and we focused here on glutamine metabolism, which has been studied more thoroughly in solid cancers to date. Expression of MYC and its target genes was also increased by both CD40 and BCR stimulation, in actual LN samples, and downregulated under IBR treatment, together indicating an important role in the metabolic reprogramming of CLL in response to LN signals.
The combined Seahorse, metabolomic, and fluxomic analyses demonstrate that glutamine is an important fuel of the TCA cycle in stimulated cells and that LN signals induce a shift in the utilization of glucose and glutamine. MYC is one of the most important regulators of glutaminase, and it has been shown that MYC-driven tumors upregulate GLS and SLC1A5 and increase consumption and catabolization of glutamine.54,55 Glutamine contributes not only to TCA fueling but also to the synthesis of amino acid, lipids, and nucleotides, as well as to the production of glutathione to maintain cellular antioxidant potential.55 In both BCR- and CD40-stimulated cells, increased synthesis of glutathione from glutamine was detected, indicating a biosynthetic role of glutamine in CLL beyond its contribution to oxidative metabolism. Although for many years glucose was considered the most important fuel of cancer cells, the current view is that the contribution of glutamine to catabolism, as well as to anabolism, is crucial to the extent that some cancers are considered glutamine addicted.54,56 To date, little is known about the role of glutamine in primary CLL, especially in LN-resident CLL cells, where glucose metabolism has not been completely explored either.
From several parameters analyzed, it could be interpreted that the effects of CD40 on metabolism are stronger than those of BCR. However, this might be explained by differences in the experimental setup to mimic these 2 signaling pathways. Recombinant cell-bound CD40 ligand and anti-IgM–coated biobeads were used, respectively. Because these are fundamentally different stimulation techniques that are optimized separately, we avoided direct quantitative comparisons between them.
By blocking glutamine metabolism during in vitro stimulation using the V9302 inhibitor, primary CLL cells were sensitized to VEN. The underlying mechanism needs to be further explored and might be linked to stress response upon amino acid starvation.57 The data indicate that the metabolic status of CLL cells, in particular glutamine import and catabolism, is a key determinant for their response and resistance to proapoptotic drugs such as VEN. Our observations in primary leukemic cells are in accordance with studies in cell lines from mantle cell lymphoma, chronic myeloid leukemia, and multiple myeloma, in which inhibition of glutamine transport or glutaminolysis leads to increased sensitivity to BH3 mimetics, which is linked to impaired lipogenesis from glutamine-derived citrate.58 Inhibition of glutamine import also had antitumor functions in (models of) solid cancers.59-61 In the MC38 murine colon carcinoma model, metabolic differences were observed within different cell types in the TME, with cancer cells being the main consumers of glutamine and immune cells relying more on glucose. Treatment of MC38-bearing mice with V9302 resulted in decreased glutamine uptake, and a shift toward glucose utilization by all cells in the TME and decreased tumor mass.54
Together, the results presented here highlight the role of glutamine, in addition to that of glucose, in the metabolic reprogramming that CLL cells undergo in the LNs, and this process shows potential as a therapeutic target.
Acknowledgments
The authors thank the patients for their blood donations and cooperation in the studies. They also thank Faris Naji from Tercen for discussion about omics data and master student Liu Zhenyu for his contribution to preliminary experiments with the V9302 glutamine inhibitor. The authors thank the reviewers for useful comments and our colleagues Dan Landau, Clare Sun, and Adrian Wiestner for their help and sharing of RNA sequencing data of IBR-treated patients.
This work was supported by Netherlands Organization for Scientific Research/Netherlands Organization for Health Research and Development Veni grant 4600284662, Vidi grant 91715337, ERC Consolidator: BOOTCAMP (864815), Lymph and Co: 2018-LYCo-008, Cancer Center Amsterdam grant 2022 and Cancer Research UK grant C2750/A23669.
Authorship
Contribution: E.E., G.J.W.v.d.W., Z.C., and G.P. conceptualized the study; Z.C., E.E., F.S.P., G.J.W.v.d.W., J.C.R., B.V.S., and M.v.W. were responsible for methodology; Z.C., H.S.-M., G.C., B.V.-A., L.D.S., B.V.S., M.v.W., D.J.B., J.A.C.v.B., and F.S.P. performed investigations; A.P.K. and F.F. were responsible for patient samples; Z.C., H.S.-M., and E.E. were responsible for visualization; E.E. and A.P.K. acquired funding; Z.C. and H.S.-M. performed project administration; E.E., A.P.K., F.F., and G.P. supervised the study; Z.C., E.E., H.S.-M., and G.C. wrote the original manuscript draft; and Z.C., H.S.-M., G.C., E.E., A.P.K., B.V.S., M.v.W., B.V.-A., and J.C.R. reviewed and edited the manuscript.
Conflict-of-interest disclosure: The authors declare no competing financial interests.
Correspondence: Eric Eldering, Amsterdam UMC, Meibergdreef 9, Amsterdam, 1105 AZ, The Netherlands; e-mail: e.eldering@amsterdamumc.nl.
All data, codes, and materials used in the analysis will be made available. Accession numbers to data deposited in public databases will be provided upon publication. The assigned GEO accession number for our RNA sequencing data is GSE201341.
The online version of this article contains a data supplement.
There is a Blood Commentary on this article in this issue.
The publication costs of this article were defrayed in part by page charge payment. Therefore, and solely to indicate this fact, this article is hereby marked “advertisement” in accordance with 18 USC section 1734.

This feature is available to Subscribers Only
Sign In or Create an Account Close Modal