

Key Points
PP2A drives terminal myeloid differentiation and growth arrest across diverse AML subtypes through c-Myc degradation and p21 induction.
PP2A activation inhibits leukemic stem cells without compromising normal hematopoiesis, improving overall survival in AML murine models.

Abstract
Dysregulated cellular differentiation is a hallmark of acute leukemogenesis. Phosphatases are widely suppressed in cancers but have not been traditionally associated with differentiation. In this study, we found that the silencing of protein phosphatase 2A (PP2A) directly blocks differentiation in acute myeloid leukemia (AML). Gene expression and mass cytometric profiling revealed that PP2A activation modulates cell cycle and transcriptional regulators that program terminal myeloid differentiation. Using a novel pharmacological agent, OSU-2S, in parallel with genetic approaches, we discovered that PP2A enforced c-Myc and p21 dependent terminal differentiation, proliferation arrest, and apoptosis in AML. Finally, we demonstrated that PP2A activation decreased leukemia-initiating stem cells, increased leukemic blast maturation, and improved overall survival in murine Tet2−/−Flt3ITD/WT and human cell-line derived xenograft AML models in vivo. Our findings identify the PP2A/c-Myc/p21 axis as a critical regulator of the differentiation/proliferation switch in AML that can be therapeutically targeted in malignancies with dysregulated maturation fate.
Introduction
Acute myeloid leukemia (AML) is a rapidly progressing malignancy characterized by abnormal hematopoietic maturation, uncontrolled cellular proliferation, and overall poor outcomes in patients. Therapies that target oncogenic drivers have improved the outcomes of subsets of patients with AML. However, because of the heterogeneity of AML, these approaches are limited for patients without a clear targetable driver mutation or chromosomal rearrangement. Driver mutations in AML frequently dysregulate the balance between cell proliferation and cell differentiation.1,2 Therefore, exploiting the use of these widely dysregulated pathways to induce hematopoietic maturation and proliferation arrest has the potential to be applicable across diverse AML subtypes.
Aberrant protein phosphorylation is one of the leading mechanisms by which malignant cells evade cell death and differentiation.3 Cancer-associated aberrant kinase activation has been extensively studied4,5 as drivers of leukemias, and in some cases their inhibition has been associated with differentiation. In contrast, suppression of phosphatase activity is shown in leukemias and other malignancies with dysregulated maturation,6-10 but their role in differentiation remains largely unexplored. One such phosphatase, a serine/threonine phosphatase PP2A, is commonly inactivated in myeloid leukemias including in ∼78% of cases of AML.11-14 Cancer-associated PP2A inactivation is often related to either subunit deregulation15-19 or overexpression of PP2A inhibitors, including SETBP1, CIP2A, SBDS, and SET, which are frequently associated with poor overall survival.12,20-24 PP2A was first characterized as a tumor suppressor in SV40-mediated oncogenic transformation.25,26 PP2A has since been shown to be a tumor suppressor in different cancers including lung and breast cancers, chronic myelogenous leukemia, and chronic lymphocytic leukemia.9,11-13,27-31
Studies of phosphatases such as PP2A are challenging because of their complex multimeric structures with multiple isoforms.6 In addition, the immunosuppressive nature of traditional PP2A-activating drugs, such as FTY720,32 precludes their clinical translation. As a result, despite the frequency and outcome of inactivation of PP2A in AML, little is understood about the function of PP2A in leukemic cells. We hypothesized that PP2A inactivation contributes to dysregulated leukemic fate in AML and that pharmacological reactivation of PP2A would restore terminal myeloid differentiation and proliferation arrest. Using OSU-2S6,33 as a novel PP2A activator in AML in parallel with genetic approaches, we identified the PP2A-driven c-Myc/p21 axis as a critical regulator of proliferation/differentiation decisions in AML through in vitro and in vivo experiments.
Materials and methods
Cells
Cell lines were obtained from American Type Culture Collection and German Collection of Microorganisms and Cell Cultures GmbH. Primary AML cells were obtained from patient apheresis or bone marrow (BM) aspirates after consent was received in an institution-approved protocol, according to the Declaration of Helsinki. The cells were cultured (0.5 × 10⁶ cells per microliter to 1 × 10⁶ cells per microliter) in StemSpanSFEM (Stemcell Technologies) or RPMI1640 (Life Technologies) with 10% fetal bovine serum (Sigma-Aldrich), l-glutamine (2 mM), penicillin (100 U/mL), and streptomycin (100 µg/mL) (Life Technologies) and supplemented with interleukin-3, granulocyte macrophage–colony-stimulating factor, and stem cell factor (10 ng/mL) (R&D Systems). AML cell lines were cultured similarly without supplements.
Cell viability and staining
Apoptosis was measured by annexin-V-FITC and propidium iodide staining, as described previously.33 For coculture experiments, viability was determined with annexin-V PE and 7-AAD. Live/Dead staining was used in combination with surface markers for gating live cells in flow cytometry. For lineage determination of AML cells in murine BM, a mixture of antibodies (CD3, Gr1, CD11b, B220, and Ter-119) was used with relevant isotype control. Flow cytometric data were analyzed with Kaluza software (Beckman Coulter).
RNA-seq analyses
Library generation and sequencing are described in the supplemental Methods (available on the Blood Web site). Each FASTQ file was separately processed using the QuaCRS pipeline34 to ensure data quality. Initial alignment to reference human recombinant RNA and mitochondrial DNA sequences was performed with HISAT2, v2.0.6.35 The remaining reads were aligned to human reference genome GRCh38p7. The featureCounts36 program, v1.5.1, was used in default mode to quantify gene expression for genes annotated in GENCODE release 25.37,38 Differential gene expression was calculated from the resulting gene expression matrix by DESeq2.39 Gene networks were analyzed by using Ingenuity Pathway Analysis (Qiagen Inc) and Gene Set Enrichment Analysis (Broad Institute, MIT, Cambridge, MA).
Immunoblot analysis
Immunoblot analysis was performed as described previously.29
Mass cytometry
Cells were stained with metal-conjugated antibodies and analyzed as described40,41 (supplemental Methods).
Murine AML model
CD45.1+ C57BL/6 (Pep Boy) mice (female) were lethally irradiated (2 × 500 rad, 3- to 4-hour interval) and coinjected with 1 × 10⁶ AML cells harvested from the spleens of CD45.2+Vav-CrePOSTet2fl/flFlt3ITD/WT mice (henceforth, referred to as Tet2−/−Flt3ITD)42 and 1 × 10⁶ support BM from Pep Boy donors. Three mice were nonirradiated and nonengrafted, and 3 mice received normal-support BM transplant (BMT-only control). To ease the effect of lethal irradiation on appetite and general health, the mice were fed wet mash for the duration of study. Blood was monitored by flow cytometry. CD45.1 vs CD45.2 markers were used to observe the Tet2−/−Flt3ITD leukemic cells. Mice were assigned to vehicle (2-hydroxypropyl-β-cyclodextrin; Sigma-Aldrich) or OSU-2S (10 mg/kg)33,43,44 treatments administered intraperitoneally (IP) 3 times per week, once disease was established (40% to 60% circulating CD45.2 cells). In addition, OSU-2S (60 mg/kg) was administered to 2 mice orally 3 times per week (excluded from the survival analysis). Low body score, weight loss >20%, and hind limb paralysis were early-removal criteria (ERC). One mouse (censored) met ERC because of injection-related distress. At early removal, the BM and spleen were analyzed by flow cytometry. Colony forming unit (CFU) assays (supplemental Methods) were conducted with BM cells.
Statistics
Analyses were performed with SAS 9.4 (SAS Inc.) at the OSU Center for Biostatistics. For experiments treating cells with vehicle or OSU-2S, paired Student t tests were performed to find the treatment effect. Cytotoxicity data were analyzed by a mixed-effect model, incorporating repeated measures for each subject. Interaction contrast in statistics model was used to test the antagonist or agonist effect of siRNA or overexpression vector. The difference in survival between groups was analyzed with the log-rank test. Multiplicity was adjusted by Holm’s method.
Results
PP2A activation causes AML cell death and modulates proliferation, differentiation, and hematopoiesis genes
PP2A activity is widely suppressed in AML.11 To elucidate the cellular effects of PP2A reactivation, we used OSU-2S, a nonimmunosuppressive analogue of FTY720,33 as a novel PP2A activator in AML. OSU-2S activated PP2A, including PP2A-B56α and B55α45 regulatory subunits containing holoenzymes, in AML cell lines (Figure 1A; supplemental Figure 1A) and primary AML cells (Figure 1B), by disrupting the PP2A catalytic subunit (PP2Ac) association with its inhibitor SET (supplemental Figure 1B-D) and increasing levels of PP2Ac coimmunoprecipitated with PP2A-B56α (B56α; supplemental Figure 1E). OSU-2S caused significant dose-dependent cytotoxicity against AML cell lines (Figure 1C) and primary AMLs, both in monoculture (Figure 1D; supplemental Figure 1F) and in coculture with mesenchymal stromal cells mimicking protective BM microenvironment46 (supplemental Figure 1G; morphology [supplemental Figure 1H] and purity [supplemental Figure 1I] of the mesenchymal stromal cells and their lack of sensitivity to OSU-2S [supplemental Figure 1J] were also confirmed). Mononuclear cells from peripheral blood of healthy donors (PBMCs) showed decreased sensitivity to OSU-2S compared with the primary AML cells (supplemental Figure 1K, 50% inhibitory dose [IC50] in AML cells, 3.129, µM vs PBMCs, 7.328 µM)]. The primary AML samples and cell lines used collectively represent different mutational/cytogenetic backgrounds, including FLT3-ITD, cKIT, TP53, IDH1, and TET2 (supplemental Table 1). The basal PP2A expression and activity of select samples in supplemental Figure 1F are shown in supplemental Figure 1L-M). No major change in PP2Ac expression was observed with OSU-2S treatment (supplemental Figure 1N). Abrogation of OSU-2S–mediated cytotoxicity by siRNA knockdown of PP2Acα (PP2Ac; Figure 1E-F), as well as PP2A-B56α (Figure 1G-H), and pharmacological inhibition of PP2A using concentrations of okadaic acid, which inhibits PP2A29 (supplemental Figure 2A), confirmed the specific involvement of PP2A activation in OSU-2S–mediated activity. Interestingly, knockdown of PP2A-B56γ (supplemental Figure 2B-C), B55α (supplemental Figure 2D-E), and PP2Acβ (supplemental Figure 2F-G) subunits failed to rescue OSU-2S–mediated cytotoxicity, indicating specific involvement of B56α and PP2ACα containing holoenzymes. Importantly, OSU-2S failed to activate PP4, a phosphatase that shares substrates with PP2A, and PPP4C knockdown did not rescue OSU-2S activity in HL-60 cells (supplemental Figure 2H-I).47
![PP2A-mediated cell death in response to OSU-2S. (A) Fold change in PP2A activity of AML cells lines treated with OSU-2S (5 µM, 4 hours), normalized to dimethyl sulfoxide (DMSO) vehicle control (Veh) (n = 3). OSU-2S significantly increased PP2A activity in HL-60 (P = .0227), MV4-11 (P = .0206), and Kasumi-1 (P = .0206) cells. (B) Fold change in PP2A activity of patient-derived AML (n = 7, AML 2-, 6-, 8-, 11-, 15-, 16-, and 2-fold1) treated with OSU-2S (5 µM, 4 hours), normalized to Veh. OSU-2S treatment significantly increased PP2A activity (P = .0037), comparable to the phosphatase activator control FTY720. (C) Percentage cell viability (measured by annexin V/PI staining) with OSU-2S treatment normalized to DMSO Veh control in AML cell lines. OSU-2S demonstrated potent dose-dependent cytotoxicity against AML cell lines HL-60 (n = 4, IC50 [24 hours] ∼3.47 µM; IC50 [48 hours] ∼2.76 µM), MV4-11 (n = 3, IC50 [24 hours ] ∼3.58 µM; IC50 [48 hours] ∼3.24 µM), U937 (n = 4, IC50 [24 hours] ∼4.6 µM; IC50 [48 hours] ∼4.56 µM), Kasumi-1 (n = 4, IC50 [24 hours] ∼5.062 µM; IC50 [48 hours] ∼4.22 µM) and MOLM-13 (n = 3, IC50 [24 hours] ∼4.1 µM; IC50 [48 hours] ∼2.3 µM). (D) Percentage of viable cells (measured by annexin V/PI staining) normalized to Veh in patient-derived AML cells (n = 13) treated with increasing concentrations of OSU-2S. OSU-2S treatment showed significant dose-dependent cytotoxicity (mean IC50 [24 hours] ∼3.83 µM; IC50 [48 hours] ∼3.13 µM, P [dose trend] < 0.0001). (E) Relative PP2Ac expression in PP2Ac (50 nM) siRNA transfected cells, normalized to nonspecific negative control (nc) siRNA transfected cells. PP2Ac protein levels were measured by densitometric quantification of immunoblots and normalized to actin loading control. Representative western blot images are shown. PP2Ac siRNA significantly knocked down PP2Ac protein expression. (F) Percentage of viable cells in HL-60 (n = 10) and MV4-11 (n = 6) cells transfected with nc siRNA or PP2Ac siRNA, normalized to Veh-treated, nc siRNA-transfected cells. Cells were treated 24 hours after transfection with Veh and 1.75 µM OSU-2S (HL-60) or 2.5 µM OSU-2S (MV4-11) for an additional 24 hours. OSU-2S showed significant cytotoxicity in nc siRNA-transfected cells; however, PP2Ac siRNA significantly reversed OSU-2S–mediated cytotoxicity (HL-60: P = .0001, 53.15% rescue in cell death; MV4-11: P = .0013, 46.36% rescue). (G) Relative PP2A-B56α (also denoted as B56α) expression in B56α siRNA (60 nM) transfected cells, normalized to nonspecific nc siRNA-transfected cells. B56α protein levels were measured by densitometric quantification of immunoblots and normalized to actin loading control. Representative western blot images are shown. B56α siRNA significantly knocked down PP2A B56α protein expression. (H) Percentage of viable cells in HL-60 (n = 10) and MV4-11 (n = 8) cells transfected with nc siRNA or B56α siRNA, normalized to Veh-treated, nc siRNA-transfected cells. Cells were treated 24 hours after transfection with Veh and 1.75 µM OSU-2S (HL-60) or 2.5 µM OSU-2S (MV4-11) for an additional 24 hours. B56α siRNA significantly reversed OSU-2S–mediated cytotoxicity (HL-60: P = .032, 58.23% rescue in cell death; MV4-11: P = .0004, 82% rescue). *P < .05; **P < .01; ***P < .001; ****P < .0001.](https://ash.silverchair-cdn.com/ash/content_public/journal/blood/139/9/10.1182_blood.2020010344/6/m_bloodbld2020010344f1.png?Expires=1769172022&Signature=zONkDJlwlr6fGhP4-gO4kN3Ly7KV1hbIgHf4-qNbP9CU3Hu7VBb8dPB182YXHqVgOEoVsktkvbpOSKFnz1oH9RRPYSQowJNH6Zs8oPaTR5nOyab-CdotCK1kkfuF-LOrlMYI5Vc5p-kQSsIRqCsiQ~IWx~2oOaWeU-tGrTyQR--lGcvAz7CD0AZVVzGqXmGhAFYzFMSI9mOQOfpuyi1u4pA1vecMk58dZHNmP5R-YZ6GpPJvUT3xONIbGSJwL~ZsWZnn1GqZuYqmOJSU7inRZOZHJTlA~4ALTOQGqvp1i6y9BAVNptF-2c1yekcMDz-R5F0Hh6ddduupWNN4F7OQDw__&Key-Pair-Id=APKAIE5G5CRDK6RD3PGA)
PP2A-mediated cell death in response to OSU-2S. (A) Fold change in PP2A activity of AML cells lines treated with OSU-2S (5 µM, 4 hours), normalized to dimethyl sulfoxide (DMSO) vehicle control (Veh) (n = 3). OSU-2S significantly increased PP2A activity in HL-60 (P = .0227), MV4-11 (P = .0206), and Kasumi-1 (P = .0206) cells. (B) Fold change in PP2A activity of patient-derived AML (n = 7, AML 2-, 6-, 8-, 11-, 15-, 16-, and 2-fold1) treated with OSU-2S (5 µM, 4 hours), normalized to Veh. OSU-2S treatment significantly increased PP2A activity (P = .0037), comparable to the phosphatase activator control FTY720. (C) Percentage cell viability (measured by annexin V/PI staining) with OSU-2S treatment normalized to DMSO Veh control in AML cell lines. OSU-2S demonstrated potent dose-dependent cytotoxicity against AML cell lines HL-60 (n = 4, IC50 [24 hours] ∼3.47 µM; IC50 [48 hours] ∼2.76 µM), MV4-11 (n = 3, IC50 [24 hours ] ∼3.58 µM; IC50 [48 hours] ∼3.24 µM), U937 (n = 4, IC50 [24 hours] ∼4.6 µM; IC50 [48 hours] ∼4.56 µM), Kasumi-1 (n = 4, IC50 [24 hours] ∼5.062 µM; IC50 [48 hours] ∼4.22 µM) and MOLM-13 (n = 3, IC50 [24 hours] ∼4.1 µM; IC50 [48 hours] ∼2.3 µM). (D) Percentage of viable cells (measured by annexin V/PI staining) normalized to Veh in patient-derived AML cells (n = 13) treated with increasing concentrations of OSU-2S. OSU-2S treatment showed significant dose-dependent cytotoxicity (mean IC50 [24 hours] ∼3.83 µM; IC50 [48 hours] ∼3.13 µM, P [dose trend] < 0.0001). (E) Relative PP2Ac expression in PP2Ac (50 nM) siRNA transfected cells, normalized to nonspecific negative control (nc) siRNA transfected cells. PP2Ac protein levels were measured by densitometric quantification of immunoblots and normalized to actin loading control. Representative western blot images are shown. PP2Ac siRNA significantly knocked down PP2Ac protein expression. (F) Percentage of viable cells in HL-60 (n = 10) and MV4-11 (n = 6) cells transfected with nc siRNA or PP2Ac siRNA, normalized to Veh-treated, nc siRNA-transfected cells. Cells were treated 24 hours after transfection with Veh and 1.75 µM OSU-2S (HL-60) or 2.5 µM OSU-2S (MV4-11) for an additional 24 hours. OSU-2S showed significant cytotoxicity in nc siRNA-transfected cells; however, PP2Ac siRNA significantly reversed OSU-2S–mediated cytotoxicity (HL-60: P = .0001, 53.15% rescue in cell death; MV4-11: P = .0013, 46.36% rescue). (G) Relative PP2A-B56α (also denoted as B56α) expression in B56α siRNA (60 nM) transfected cells, normalized to nonspecific nc siRNA-transfected cells. B56α protein levels were measured by densitometric quantification of immunoblots and normalized to actin loading control. Representative western blot images are shown. B56α siRNA significantly knocked down PP2A B56α protein expression. (H) Percentage of viable cells in HL-60 (n = 10) and MV4-11 (n = 8) cells transfected with nc siRNA or B56α siRNA, normalized to Veh-treated, nc siRNA-transfected cells. Cells were treated 24 hours after transfection with Veh and 1.75 µM OSU-2S (HL-60) or 2.5 µM OSU-2S (MV4-11) for an additional 24 hours. B56α siRNA significantly reversed OSU-2S–mediated cytotoxicity (HL-60: P = .032, 58.23% rescue in cell death; MV4-11: P = .0004, 82% rescue). *P < .05; **P < .01; ***P < .001; ****P < .0001.
PP2A-mediated cell death in response to OSU-2S. (A) Fold change in PP2A activity of AML cells lines treated with OSU-2S (5 µM, 4 hours), normalized to dimethyl sulfoxide (DMSO) vehicle control (Veh) (n = 3). OSU-2S significantly increased PP2A activity in HL-60 (P = .0227), MV4-11 (P = .0206), and Kasumi-1 (P = .0206) cells. (B) Fold change in PP2A activity of patient-derived AML (n = 7, AML 2-, 6-, 8-, 11-, 15-, 16-, and 2-fold1) treated with OSU-2S (5 µM, 4 hours), normalized to Veh. OSU-2S treatment significantly increased PP2A activity (P = .0037), comparable to the phosphatase activator control FTY720. (C) Percentage cell viability (measured by annexin V/PI staining) with OSU-2S treatment normalized to DMSO Veh control in AML cell lines. OSU-2S demonstrated potent dose-dependent cytotoxicity against AML cell lines HL-60 (n = 4, IC50 [24 hours] ∼3.47 µM; IC50 [48 hours] ∼2.76 µM), MV4-11 (n = 3, IC50 [24 hours ] ∼3.58 µM; IC50 [48 hours] ∼3.24 µM), U937 (n = 4, IC50 [24 hours] ∼4.6 µM; IC50 [48 hours] ∼4.56 µM), Kasumi-1 (n = 4, IC50 [24 hours] ∼5.062 µM; IC50 [48 hours] ∼4.22 µM) and MOLM-13 (n = 3, IC50 [24 hours] ∼4.1 µM; IC50 [48 hours] ∼2.3 µM). (D) Percentage of viable cells (measured by annexin V/PI staining) normalized to Veh in patient-derived AML cells (n = 13) treated with increasing concentrations of OSU-2S. OSU-2S treatment showed significant dose-dependent cytotoxicity (mean IC50 [24 hours] ∼3.83 µM; IC50 [48 hours] ∼3.13 µM, P [dose trend] < 0.0001). (E) Relative PP2Ac expression in PP2Ac (50 nM) siRNA transfected cells, normalized to nonspecific negative control (nc) siRNA transfected cells. PP2Ac protein levels were measured by densitometric quantification of immunoblots and normalized to actin loading control. Representative western blot images are shown. PP2Ac siRNA significantly knocked down PP2Ac protein expression. (F) Percentage of viable cells in HL-60 (n = 10) and MV4-11 (n = 6) cells transfected with nc siRNA or PP2Ac siRNA, normalized to Veh-treated, nc siRNA-transfected cells. Cells were treated 24 hours after transfection with Veh and 1.75 µM OSU-2S (HL-60) or 2.5 µM OSU-2S (MV4-11) for an additional 24 hours. OSU-2S showed significant cytotoxicity in nc siRNA-transfected cells; however, PP2Ac siRNA significantly reversed OSU-2S–mediated cytotoxicity (HL-60: P = .0001, 53.15% rescue in cell death; MV4-11: P = .0013, 46.36% rescue). (G) Relative PP2A-B56α (also denoted as B56α) expression in B56α siRNA (60 nM) transfected cells, normalized to nonspecific nc siRNA-transfected cells. B56α protein levels were measured by densitometric quantification of immunoblots and normalized to actin loading control. Representative western blot images are shown. B56α siRNA significantly knocked down PP2A B56α protein expression. (H) Percentage of viable cells in HL-60 (n = 10) and MV4-11 (n = 8) cells transfected with nc siRNA or B56α siRNA, normalized to Veh-treated, nc siRNA-transfected cells. Cells were treated 24 hours after transfection with Veh and 1.75 µM OSU-2S (HL-60) or 2.5 µM OSU-2S (MV4-11) for an additional 24 hours. B56α siRNA significantly reversed OSU-2S–mediated cytotoxicity (HL-60: P = .032, 58.23% rescue in cell death; MV4-11: P = .0004, 82% rescue). *P < .05; **P < .01; ***P < .001; ****P < .0001.
To identify downstream events contributing to the PP2A-mediated antileukemic effect, we interrogated global transcriptome changes in MV4-11 cells treated with OSU-2S (Figure 2A; supplemental Figure 3A; supplemental Table 2). Cell differentiation and cell death pathways were upregulated, whereas proliferation, hematopoietic progenitor cell levels, and DNA replication and repair pathways were downregulated (Figure 2B; supplemental Figure 3B; supplemental Table 3). Further, Gene Set Enrichment Analysis revealed reduced c-Myc and E2F transcription signatures (Figure 2C). Several genes implicated in proliferation/differentiation decisions and AML pathogenesis were deregulated (Figure 2A) including downregulation of CDK2, cyclin D1, cyclin E1, KIT,5 TERT,48 and IDH249 and upregulation of p21, p27, GADD45β,50 KLF-2, -4, and -6,51,52 and CCAAT/enhancer-binding protein β (CEBPβ), a known inducer of myeloid differentiation,53,54 confirmed by quantitative reverse transcription-polymerase chain reaction in MV4-11, HL-60, and primary AML cells (Figure 2D-F; supplemental Figure 3C-D).
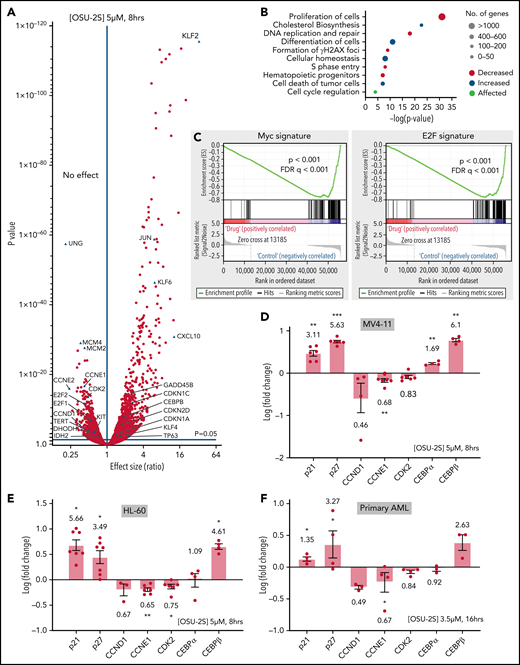
PP2A–mediated gene expression changes in response to OSU-2S. (A) Differential expression of genes in MV4-11 cells (5 µM, 8 hours) treated with OSU-2S, compared with vehicle control (Veh). (B) Major pathways predicted to be differentially regulated from OSU-2S–mediated changes in the transcriptome. (C) Gene Set Enrichment Analysis enrichment plot showing negative correlation of Myc and E2F targets with OSU-2S-treated RNA expression. Fold change (log) modulation of cell cycle regulators and differentiation genes in MV4-11 (D) and HL-60 (E) cells treated with OSU-2S (5 μM, 8 hours) normalized to Veh-treated cells. (F) Fold change (log) modulation of cell cycle regulators and differentiation genes in primary AML cells (AML 17-AML 20) treated with OSU-2S (3.5 μM, 16 hours) normalized to Veh-treated cells. *P < .05; **P < .01; ***P < .001.
PP2A–mediated gene expression changes in response to OSU-2S. (A) Differential expression of genes in MV4-11 cells (5 µM, 8 hours) treated with OSU-2S, compared with vehicle control (Veh). (B) Major pathways predicted to be differentially regulated from OSU-2S–mediated changes in the transcriptome. (C) Gene Set Enrichment Analysis enrichment plot showing negative correlation of Myc and E2F targets with OSU-2S-treated RNA expression. Fold change (log) modulation of cell cycle regulators and differentiation genes in MV4-11 (D) and HL-60 (E) cells treated with OSU-2S (5 μM, 8 hours) normalized to Veh-treated cells. (F) Fold change (log) modulation of cell cycle regulators and differentiation genes in primary AML cells (AML 17-AML 20) treated with OSU-2S (3.5 μM, 16 hours) normalized to Veh-treated cells. *P < .05; **P < .01; ***P < .001.
PP2A switches AML cell fate from proliferation to differentiation
To confirm PP2A-mediated myeloid differentiation, we evaluated differentiation markers CD11b and CD14 on OSU-2S-treated cells. OSU-2S significantly increased the proportion of cells expressing CD11b and CD14 in primary AML and HL-60, U937 (Figure 3A-B; supplemental Figure 4A-F), and MV4-11 cell lines (supplemental Figure 4G). Cells underwent morphological changes indicative of differentiation, including lower nuclear/cytoplasmic ratio, and highly vacuolated and granulated cytoplasm (Figure 3C). PP2Ac and B56α knockdown (Figure 1E,G; supplemental Figure 4H) significantly rescued OSU-2S–mediated CD11b induction, confirming involvement of PP2A in OSU-2S-mediated differentiation (Figure 3D-E). In addition, increased CD11b and CD14 expression was also observed with additional PP2A activators, such as FTY72029 and perphenazine (PPZ)30,31 (Figure 3F-H; supplemental Figure 4I-K). Transient overexpression of PP2Ac and SET knockdown in HL-60 cells also resulted in decreased viability and increased differentiation (supplemental Figure 4L-M). To further elucidate PP2A-mediated changes in cell fate, we used mass cytometry to study cell cycle, maturation, and progenitor, apoptosis, and DNA damage markers in AML cells. These experiments revealed an increased trend in the expression of myeloid maturation markers including CD15 (2-fold), CD14 (1.4-fold), and CD66b (1.8-fold) in OSU-2S–treated primary AML and HL-60 cells (Figure 3I-J; supplemental Figure 5A-B; supplemental Tables 4 and 5). Further, the apoptotic marker cleaved PARP and the DNA damage marker pH2AX were upregulated, whereas the PP2A target phospho-ERK (pERK) was downregulated (supplemental Figure 5A-C).
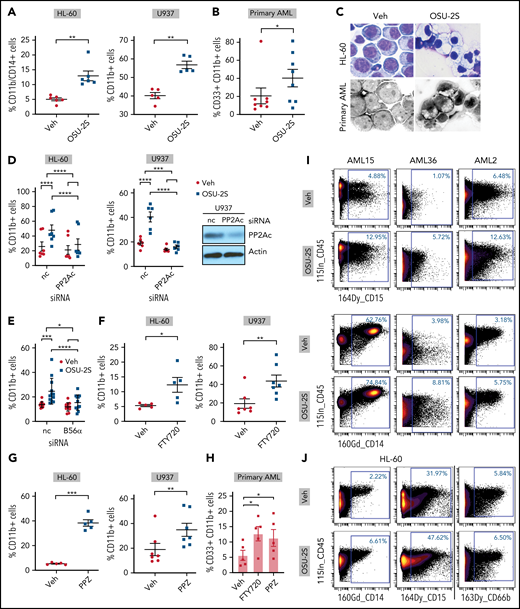
PP2A–mediated leukemic maturation. (A) Increase in the percentage of CD11b+/CD14+ or CD11b+ cells (CD11b-FITC or CD11b-BV421, CD14-BV650) in the HL-60 (n = 6, P = .001) and U937 cell lines (n = 5, P = .0011) treated with OSU-2S (2.5 μM, 48 hours) compared with vehicle control (Veh). (B) Increased percentage of CD33+/CD11b+ (CD33-PE, CD11b-FITC, or CD11b-BV421) primary AML cells (n = 8; AML14-16, 20, 24-27) treated with OSU-2S (3.5 μM, 48 hours) compared with Veh (P = .0384; 19.93% mean increase in CD11b+ cells). (C) Representative morphological changes in HL-60 and primary AML cells (AML14) treated with OSU-2S. (D) Percentage of CD11b+ cells transfected with negative control (nc) siRNA or PP2Ac siRNA and treated 24 hours after transfection with Veh or OSU-2S (1.75 µM) for an additional 16 to 24 hours. OSU-2S–mediated induction of CD11b was significantly reversed by siRNA knockdown of PP2Ac (HL-60: n = 7, P < .0001, 66.64% rescue; U937: n = 6, P = .0004, 89.69% rescue). (E) Percentage of CD11b+ HL-60 cells transfected with either nc siRNA or B56α siRNA and treated 24 hours after transfection with Veh or OSU-2S (1.75 µM) for an additional 16 to 24 hours. OSU-2S–mediated induction of CD11b was significantly reversed by siRNA knockdown of PP2A B56α (n = 12, P = .017, 67.7% rescue). (F) Increase in percentage of CD11b+ cells with 2.5 µM FTY720 in HL-60 (48 hours; n = 5; P = .0338) and U937 cells (72 hours; n = 7, P = 0016) compared with Veh. (G) Increase in percentage of CD11b+ cells with 10 µM PPZ in HL-60 (48 hours; n = 5, P = .0002) and U937 cells (72 hours; n = 7, P = .0012) compared with Veh. (H) Increase in percentage of CD11b+ cells in primary AML cells (n = 5; AML 15, 18, 24, 38, and 44) treated with FTY720 (2.5 µM, 48 hours, P = .0375, 7.054% increase) or PPZ (10 µM, 48 hours, P = .0181, 5.668% increase) compared with Veh. (I) Representative images of mass cytometric analysis of primary AML cells treated with Veh or OSU-2S (3 μM, 48 hours) revealed increased surface differentiation markers CD14 and CD15. (J) Mass cytometric analysis of HL-60 cells treated with Veh or OSU-2S revealed an increase in the surface differentiation markers CD14, CD15, and CD66b. *P < .05; **P < .01; ***P < .001; ****P < .0001.
PP2A–mediated leukemic maturation. (A) Increase in the percentage of CD11b+/CD14+ or CD11b+ cells (CD11b-FITC or CD11b-BV421, CD14-BV650) in the HL-60 (n = 6, P = .001) and U937 cell lines (n = 5, P = .0011) treated with OSU-2S (2.5 μM, 48 hours) compared with vehicle control (Veh). (B) Increased percentage of CD33+/CD11b+ (CD33-PE, CD11b-FITC, or CD11b-BV421) primary AML cells (n = 8; AML14-16, 20, 24-27) treated with OSU-2S (3.5 μM, 48 hours) compared with Veh (P = .0384; 19.93% mean increase in CD11b+ cells). (C) Representative morphological changes in HL-60 and primary AML cells (AML14) treated with OSU-2S. (D) Percentage of CD11b+ cells transfected with negative control (nc) siRNA or PP2Ac siRNA and treated 24 hours after transfection with Veh or OSU-2S (1.75 µM) for an additional 16 to 24 hours. OSU-2S–mediated induction of CD11b was significantly reversed by siRNA knockdown of PP2Ac (HL-60: n = 7, P < .0001, 66.64% rescue; U937: n = 6, P = .0004, 89.69% rescue). (E) Percentage of CD11b+ HL-60 cells transfected with either nc siRNA or B56α siRNA and treated 24 hours after transfection with Veh or OSU-2S (1.75 µM) for an additional 16 to 24 hours. OSU-2S–mediated induction of CD11b was significantly reversed by siRNA knockdown of PP2A B56α (n = 12, P = .017, 67.7% rescue). (F) Increase in percentage of CD11b+ cells with 2.5 µM FTY720 in HL-60 (48 hours; n = 5; P = .0338) and U937 cells (72 hours; n = 7, P = 0016) compared with Veh. (G) Increase in percentage of CD11b+ cells with 10 µM PPZ in HL-60 (48 hours; n = 5, P = .0002) and U937 cells (72 hours; n = 7, P = .0012) compared with Veh. (H) Increase in percentage of CD11b+ cells in primary AML cells (n = 5; AML 15, 18, 24, 38, and 44) treated with FTY720 (2.5 µM, 48 hours, P = .0375, 7.054% increase) or PPZ (10 µM, 48 hours, P = .0181, 5.668% increase) compared with Veh. (I) Representative images of mass cytometric analysis of primary AML cells treated with Veh or OSU-2S (3 μM, 48 hours) revealed increased surface differentiation markers CD14 and CD15. (J) Mass cytometric analysis of HL-60 cells treated with Veh or OSU-2S revealed an increase in the surface differentiation markers CD14, CD15, and CD66b. *P < .05; **P < .01; ***P < .001; ****P < .0001.
Evaluation of proliferation and cell cycle markers including cyclinB1, phospho Rb (pRb), Ki67, and IdU40,41,55 in OSU-2S–treated cells revealed decreased expression associated with proliferation arrest (Figure 4A-D; supplemental Figure 5A,D). Importantly, cell cycle arrest at S phase entry was seen in primary AML by significant accumulation of cells at the G0/G1 phase and a decreased proportion of cells at the S phase (Figure 4C; supplemental Figure 5D). Cell cycle analysis of synchronized OSU-2S–treated HL-60 cells also confirmed S phase arrest by increased accumulation in the G0/G1 phase and decrease in the S phase, which was rescued by okadaic acid, confirming involvement of PP2A (Figure 4E; supplemental Figure 5E). Interestingly, primary cells induced to express maturation markers CD14 and CD15 did not express Ki67 (Figure 4F). Importantly, we observed consistent induction of maturation markers in cells in the G0/G1 phase and not in the S phase after OSU-2S treatment (Figure 4G).
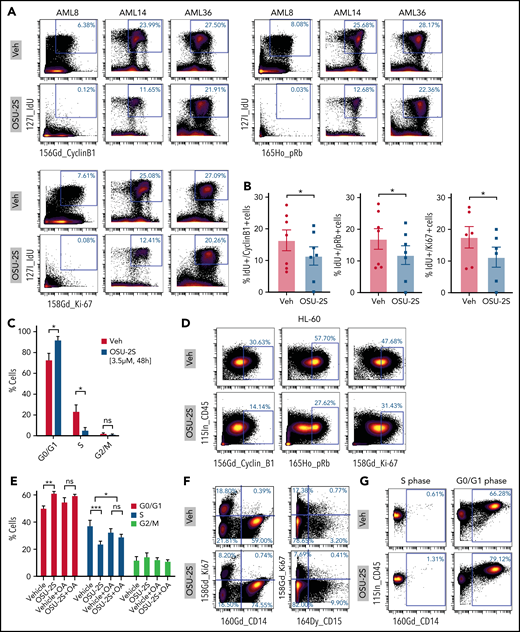
PP2A–mediated cell cycle arrest in response to OSU-2S. Representative plots (n = 7) (A) and quantification (B) of mass cytometric analysis of primary AML cells treated with Veh or OSU-2S (3 µM, 48 hours) showing a decrease in cell cycle and proliferation markers of phosphoretinoblastoma (pRb), cyclin B1, IdU, and Ki67 with OSU-2S treatment. (C) Mass cytometric analysis of primary AML cells (n = 5; AML 2, 8, 14, 15, and 21) treated with Veh or OSU-2S (3 μM, 48 hours) showed a significant increase in G0/G1 (P = .0265) and a significant decrease in S phase (P = .0339) with OSU-2S. No significant changes in G2/M were observed. pRb, IdU, and cyclin B1 were used to gate the cell cycle phases.41 (D) OSU-2S (5 μM, 48 hours) decreased cyclin B1, pRb, and Ki67 levels in HL-60 cells, as detected by mass cytometry. (E) Percentage of cells in the G0/G1, S, and G2M phases of the cell cycle in HL-60 cells (n = 3) treated with Veh or OSU-2S (5 μM, 16 hours), with or without pretreatment (2 hours) with 5 nM okadaic acid (OA), as detected by propidium iodide staining and flow cytometry. OSU-2S significantly accumulated cells in the G0-G1 phase (P = .0017) and decreased the proportion of cells in the S phase (P = .0003), which was rescued with OA (P = .0347). (F) Analysis of proliferation vs differentiation markers (Ki67 vs CD14 and CD15) show that cells induced to differentiate by OSU-2S are negative for Ki67. (G) OSU-2S–mediated induction of maturation markers in cells in the G0/G1 phase but not in the S phase. *P < .05; **P < .01; ***P < .001.
PP2A–mediated cell cycle arrest in response to OSU-2S. Representative plots (n = 7) (A) and quantification (B) of mass cytometric analysis of primary AML cells treated with Veh or OSU-2S (3 µM, 48 hours) showing a decrease in cell cycle and proliferation markers of phosphoretinoblastoma (pRb), cyclin B1, IdU, and Ki67 with OSU-2S treatment. (C) Mass cytometric analysis of primary AML cells (n = 5; AML 2, 8, 14, 15, and 21) treated with Veh or OSU-2S (3 μM, 48 hours) showed a significant increase in G0/G1 (P = .0265) and a significant decrease in S phase (P = .0339) with OSU-2S. No significant changes in G2/M were observed. pRb, IdU, and cyclin B1 were used to gate the cell cycle phases.41 (D) OSU-2S (5 μM, 48 hours) decreased cyclin B1, pRb, and Ki67 levels in HL-60 cells, as detected by mass cytometry. (E) Percentage of cells in the G0/G1, S, and G2M phases of the cell cycle in HL-60 cells (n = 3) treated with Veh or OSU-2S (5 μM, 16 hours), with or without pretreatment (2 hours) with 5 nM okadaic acid (OA), as detected by propidium iodide staining and flow cytometry. OSU-2S significantly accumulated cells in the G0-G1 phase (P = .0017) and decreased the proportion of cells in the S phase (P = .0003), which was rescued with OA (P = .0347). (F) Analysis of proliferation vs differentiation markers (Ki67 vs CD14 and CD15) show that cells induced to differentiate by OSU-2S are negative for Ki67. (G) OSU-2S–mediated induction of maturation markers in cells in the G0/G1 phase but not in the S phase. *P < .05; **P < .01; ***P < .001.
PP2A induced differentiation is mediated by p21 upregulation
PP2A-induced growth arrest leading to leukemic differentiation indicates that the processes are molecularly linked. Along with cell cycle arrest, OSU-2S was found to upregulate cell cycle inhibitors, such as p21 and p27, as seen by RNA-sequencing and qPCR (Figure 2A,D-F). We saw a consistent induction of p21 protein across HL-60 and MV4-11 cell lines (Figure 5A-B; supplemental Figure 6A) and patient samples treated with OSU-2S (Figure 5C). siRNA-mediated knockdown of PP2Ac rescued OSU-2S–mediated p21 induction, confirming the specific involvement of PP2A (Figure 5D-E).
![PP2A activation induced p21-mediated cell death and differentiation via c-Myc degradation. (A) HL-60 and MV4-11 cells treated with Veh or 2.5 μM OSU-2S resulted in increased p21 levels as evidenced by immunoblotting, representative images. Relative densitometric quantification is presented below the blots, as well as in the graph of p21 protein levels (B), normalized to the actin loading control. OSU-2S treatment significantly increased p21 protein expression. (C) Densitometric quantification of p21 immunoblotting, normalized to the actin loading control, and western blot images of primary AML cells treated with OSU-2S (3.5 μM, 16 hours). OSU-2S significantly induced p21 expression in primary AML. (D) Cells treated with OSU-2S (1.75 µM [HL-60] or 2.5 µM [MV4-11] for 8 hours) 24 hours after transfection with negative control (nc) or PP2Ac siRNA were probed for p21 expression by immunoblot analysis; representative images are shown. Relative densitometric quantification is presented as numbers below the blots, as well as in the graph of relative p21 protein levels (E), normalized to the actin loading control. OSU-2S–mediated p21 induction was significantly reversed by PP2Ac siRNA, confirming involvement of PP2A. (F) Relative viability (annexin V/PI) in cells transfected with nc siRNA or p21 siRNA (60 nM) and treated 24 hours after transfection with Veh and 1.75 µM OSU-2S (HL-60) or 2.5 µM OSU-2S (MV4-11, U937) for an additional 24 hours. p21 knockdown significantly rescued OSU-2S–mediated cytotoxicity (HL-60: n = 15, P < .0001, 70.3% rescue; MV4-11: n = 7, P < .0001, 58.5% rescue, U937: n = 5, P = .0007, 50.24% rescue). Immunoblot analysis (48 hours after transfection) confirmed p21 knockdown. (G) Percent CD11b + cells in HL-60 or U937 cells transfected with nc or p21 siRNA and treated 24 hours after transfection with Veh or OSU-2S (1.75 µM, 16-24 hours). p21 knockdown significantly reversed OSU-2S–mediated differentiation (HL-60: n = 12, P < .0001, 86.96% rescue; U937: n = 5, P = .0053, 94.29% rescue). (H) OSU-2S treatment (2.5 μM) resulted in c-Myc downmodulation in HL-60 and MV4-11 cells. (I) Representative western blot images and densitometric quantification of c-Myc protein levels, normalized to actin. (J) OSU-2S treatment (3.5 μM, 16 hours) resulted in c-Myc downmodulation in primary AML cells; western blot images and densitometric quantification. (K) Cells treated with OSU-2S (1.75 µM [HL-60] or 2.5 µM [MV4-11] for 8 hours) 24 hours after transfection with nc or PP2Ac siRNA were probed for c-Myc expression. (L) Representative western blot images and densitometric quantification of c-Myc, normalized to actin. OSU-2S–mediated c-Myc downregulation was significantly reversed by PP2A siRNA, as seen by immunoblot analysis, confirming involvement of PP2A. (M) Cells treated with OSU-2S (1.75 µM [HL-60] or 2.5 µM [MV4-11] for 8 hours) 24 hours after transfection with nc or B56α siRNA were probed for c-Myc expression. Representative western blot images and (N) densitometric quantification of c-Myc, normalized to actin. OSU-2S–mediated c-Myc downregulation was significantly reversed by PP2A B56α siRNA according to immunoblot analysis. (O) Percentage of relative viability (annexin V/PI) in cells transfected with empty pcDNA3 vector or pcDNA3-c-Myc and treated 48 hours after transfection with Veh and 1.75 µM OSU-2S (HL-60) or 2.5 µM OSU-2S (MV4-11, U937), for an additional 24 hours. c-Myc overexpression significantly rescued OSU-2S–mediated cytotoxicity (HL-60: n = 9, P = .0041, 86.7% rescue; MV4-11: n = 4, P = .0142, 87.35% rescue, U937: n = 5, P = .0013, 41.9% rescue). Immunoblot analysis (48 hours after transfection) confirmed c-Myc overexpression. (P) Percentage of CD11b+ cells in HL-60 or U937 cells transfected with pcDNA3 or pcDNA3-c-Myc and treated 48 hours after transfection with Veh or OSU-2S (1.75 µM for 16-24 hours). c-Myc overexpression significantly rescued OSU-2S–mediated differentiation (HL-60: n = 14, P < .0001, 83.1% rescue; U937: n = 5, P = .0368, 68.9% rescue). (Q) p21 expression in cells transfected with pcDNA3 or pcDNA3-c-Myc and treated 48 hours after transfection with Veh or OSU-2S (1.75 µM [HL-60] or 2.5 µM [MV4-11], 8 hours). Representative western blot images and densitometric quantification of c-Myc (R) and p21 (S), normalized to actin. c-Myc overexpression significantly reversed OSU-2S–mediated p21 upregulation. *P < .05; **P < .01; ***P < .001; ****P < .0001.](https://ash.silverchair-cdn.com/ash/content_public/journal/blood/139/9/10.1182_blood.2020010344/6/m_bloodbld2020010344f5a.png?Expires=1769172022&Signature=MOwPUfK9DgabmyKfpj3uSBMfpHE8LyxHQTpfuzVgpVBOWTV5E1jg3pze2E6LR81VX14pFu0fs~-dtxaKRNKiZkkhkXBUJ2jctFBBODJxN-KHH5R-qmgym93XNfs0y1WgIMBfQ6~2Lb7nWws6tHwILUrX6OC4wdnWfW10lWmjZD-MDNUgjsm3TzyvvM7MGsM-GqnMiT6mps6tI3RHK0Ggdk5hXz5ggbxCWBTwn94FgE~BH7drxpSK3Ej~htznOOe6eXrcpCfFkRnwMLkQX4akZhBLWa5FduZ3FqmOGNYipuWTSBI0VlyDMAbU5KqmV96WT1ywKQH4kjH2VJ4SyitS3Q__&Key-Pair-Id=APKAIE5G5CRDK6RD3PGA)
![PP2A activation induced p21-mediated cell death and differentiation via c-Myc degradation. (A) HL-60 and MV4-11 cells treated with Veh or 2.5 μM OSU-2S resulted in increased p21 levels as evidenced by immunoblotting, representative images. Relative densitometric quantification is presented below the blots, as well as in the graph of p21 protein levels (B), normalized to the actin loading control. OSU-2S treatment significantly increased p21 protein expression. (C) Densitometric quantification of p21 immunoblotting, normalized to the actin loading control, and western blot images of primary AML cells treated with OSU-2S (3.5 μM, 16 hours). OSU-2S significantly induced p21 expression in primary AML. (D) Cells treated with OSU-2S (1.75 µM [HL-60] or 2.5 µM [MV4-11] for 8 hours) 24 hours after transfection with negative control (nc) or PP2Ac siRNA were probed for p21 expression by immunoblot analysis; representative images are shown. Relative densitometric quantification is presented as numbers below the blots, as well as in the graph of relative p21 protein levels (E), normalized to the actin loading control. OSU-2S–mediated p21 induction was significantly reversed by PP2Ac siRNA, confirming involvement of PP2A. (F) Relative viability (annexin V/PI) in cells transfected with nc siRNA or p21 siRNA (60 nM) and treated 24 hours after transfection with Veh and 1.75 µM OSU-2S (HL-60) or 2.5 µM OSU-2S (MV4-11, U937) for an additional 24 hours. p21 knockdown significantly rescued OSU-2S–mediated cytotoxicity (HL-60: n = 15, P < .0001, 70.3% rescue; MV4-11: n = 7, P < .0001, 58.5% rescue, U937: n = 5, P = .0007, 50.24% rescue). Immunoblot analysis (48 hours after transfection) confirmed p21 knockdown. (G) Percent CD11b + cells in HL-60 or U937 cells transfected with nc or p21 siRNA and treated 24 hours after transfection with Veh or OSU-2S (1.75 µM, 16-24 hours). p21 knockdown significantly reversed OSU-2S–mediated differentiation (HL-60: n = 12, P < .0001, 86.96% rescue; U937: n = 5, P = .0053, 94.29% rescue). (H) OSU-2S treatment (2.5 μM) resulted in c-Myc downmodulation in HL-60 and MV4-11 cells. (I) Representative western blot images and densitometric quantification of c-Myc protein levels, normalized to actin. (J) OSU-2S treatment (3.5 μM, 16 hours) resulted in c-Myc downmodulation in primary AML cells; western blot images and densitometric quantification. (K) Cells treated with OSU-2S (1.75 µM [HL-60] or 2.5 µM [MV4-11] for 8 hours) 24 hours after transfection with nc or PP2Ac siRNA were probed for c-Myc expression. (L) Representative western blot images and densitometric quantification of c-Myc, normalized to actin. OSU-2S–mediated c-Myc downregulation was significantly reversed by PP2A siRNA, as seen by immunoblot analysis, confirming involvement of PP2A. (M) Cells treated with OSU-2S (1.75 µM [HL-60] or 2.5 µM [MV4-11] for 8 hours) 24 hours after transfection with nc or B56α siRNA were probed for c-Myc expression. Representative western blot images and (N) densitometric quantification of c-Myc, normalized to actin. OSU-2S–mediated c-Myc downregulation was significantly reversed by PP2A B56α siRNA according to immunoblot analysis. (O) Percentage of relative viability (annexin V/PI) in cells transfected with empty pcDNA3 vector or pcDNA3-c-Myc and treated 48 hours after transfection with Veh and 1.75 µM OSU-2S (HL-60) or 2.5 µM OSU-2S (MV4-11, U937), for an additional 24 hours. c-Myc overexpression significantly rescued OSU-2S–mediated cytotoxicity (HL-60: n = 9, P = .0041, 86.7% rescue; MV4-11: n = 4, P = .0142, 87.35% rescue, U937: n = 5, P = .0013, 41.9% rescue). Immunoblot analysis (48 hours after transfection) confirmed c-Myc overexpression. (P) Percentage of CD11b+ cells in HL-60 or U937 cells transfected with pcDNA3 or pcDNA3-c-Myc and treated 48 hours after transfection with Veh or OSU-2S (1.75 µM for 16-24 hours). c-Myc overexpression significantly rescued OSU-2S–mediated differentiation (HL-60: n = 14, P < .0001, 83.1% rescue; U937: n = 5, P = .0368, 68.9% rescue). (Q) p21 expression in cells transfected with pcDNA3 or pcDNA3-c-Myc and treated 48 hours after transfection with Veh or OSU-2S (1.75 µM [HL-60] or 2.5 µM [MV4-11], 8 hours). Representative western blot images and densitometric quantification of c-Myc (R) and p21 (S), normalized to actin. c-Myc overexpression significantly reversed OSU-2S–mediated p21 upregulation. *P < .05; **P < .01; ***P < .001; ****P < .0001.](https://ash.silverchair-cdn.com/ash/content_public/journal/blood/139/9/10.1182_blood.2020010344/6/m_bloodbld2020010344f5b.png?Expires=1769172022&Signature=nKdiqC8R6~R7nn7cgJ5saE5ncJxcIwYyj8WW68Tc0WXo3MLX2Bl7uGbNZEdzVALK8UNMThzanyVMsKuJxlem5fPaxioFa6Wq8MHLHugrioHp9Ie4xEvEakZa~u1nrhhWKJ2gQhWylxsjsVzg-Tgmxun5e~ac8XRG8hfpCDJ6NqplZ5lZXNXHi7d21uGrMFufEpGlHAYQJcnDaVvczOla0PWR0fpHCn0MgyQB669gi8h7EHLiN~j9gio5Bd9JRocjkcYquSk1rnkODmR5YtJOdurvi2IenWHIV13hAOn3sRHLqCT9KgXoaZTYG9W4WMb2oXXpLLr9Fyd5lxXeD0k7iQ__&Key-Pair-Id=APKAIE5G5CRDK6RD3PGA)
![PP2A activation induced p21-mediated cell death and differentiation via c-Myc degradation. (A) HL-60 and MV4-11 cells treated with Veh or 2.5 μM OSU-2S resulted in increased p21 levels as evidenced by immunoblotting, representative images. Relative densitometric quantification is presented below the blots, as well as in the graph of p21 protein levels (B), normalized to the actin loading control. OSU-2S treatment significantly increased p21 protein expression. (C) Densitometric quantification of p21 immunoblotting, normalized to the actin loading control, and western blot images of primary AML cells treated with OSU-2S (3.5 μM, 16 hours). OSU-2S significantly induced p21 expression in primary AML. (D) Cells treated with OSU-2S (1.75 µM [HL-60] or 2.5 µM [MV4-11] for 8 hours) 24 hours after transfection with negative control (nc) or PP2Ac siRNA were probed for p21 expression by immunoblot analysis; representative images are shown. Relative densitometric quantification is presented as numbers below the blots, as well as in the graph of relative p21 protein levels (E), normalized to the actin loading control. OSU-2S–mediated p21 induction was significantly reversed by PP2Ac siRNA, confirming involvement of PP2A. (F) Relative viability (annexin V/PI) in cells transfected with nc siRNA or p21 siRNA (60 nM) and treated 24 hours after transfection with Veh and 1.75 µM OSU-2S (HL-60) or 2.5 µM OSU-2S (MV4-11, U937) for an additional 24 hours. p21 knockdown significantly rescued OSU-2S–mediated cytotoxicity (HL-60: n = 15, P < .0001, 70.3% rescue; MV4-11: n = 7, P < .0001, 58.5% rescue, U937: n = 5, P = .0007, 50.24% rescue). Immunoblot analysis (48 hours after transfection) confirmed p21 knockdown. (G) Percent CD11b + cells in HL-60 or U937 cells transfected with nc or p21 siRNA and treated 24 hours after transfection with Veh or OSU-2S (1.75 µM, 16-24 hours). p21 knockdown significantly reversed OSU-2S–mediated differentiation (HL-60: n = 12, P < .0001, 86.96% rescue; U937: n = 5, P = .0053, 94.29% rescue). (H) OSU-2S treatment (2.5 μM) resulted in c-Myc downmodulation in HL-60 and MV4-11 cells. (I) Representative western blot images and densitometric quantification of c-Myc protein levels, normalized to actin. (J) OSU-2S treatment (3.5 μM, 16 hours) resulted in c-Myc downmodulation in primary AML cells; western blot images and densitometric quantification. (K) Cells treated with OSU-2S (1.75 µM [HL-60] or 2.5 µM [MV4-11] for 8 hours) 24 hours after transfection with nc or PP2Ac siRNA were probed for c-Myc expression. (L) Representative western blot images and densitometric quantification of c-Myc, normalized to actin. OSU-2S–mediated c-Myc downregulation was significantly reversed by PP2A siRNA, as seen by immunoblot analysis, confirming involvement of PP2A. (M) Cells treated with OSU-2S (1.75 µM [HL-60] or 2.5 µM [MV4-11] for 8 hours) 24 hours after transfection with nc or B56α siRNA were probed for c-Myc expression. Representative western blot images and (N) densitometric quantification of c-Myc, normalized to actin. OSU-2S–mediated c-Myc downregulation was significantly reversed by PP2A B56α siRNA according to immunoblot analysis. (O) Percentage of relative viability (annexin V/PI) in cells transfected with empty pcDNA3 vector or pcDNA3-c-Myc and treated 48 hours after transfection with Veh and 1.75 µM OSU-2S (HL-60) or 2.5 µM OSU-2S (MV4-11, U937), for an additional 24 hours. c-Myc overexpression significantly rescued OSU-2S–mediated cytotoxicity (HL-60: n = 9, P = .0041, 86.7% rescue; MV4-11: n = 4, P = .0142, 87.35% rescue, U937: n = 5, P = .0013, 41.9% rescue). Immunoblot analysis (48 hours after transfection) confirmed c-Myc overexpression. (P) Percentage of CD11b+ cells in HL-60 or U937 cells transfected with pcDNA3 or pcDNA3-c-Myc and treated 48 hours after transfection with Veh or OSU-2S (1.75 µM for 16-24 hours). c-Myc overexpression significantly rescued OSU-2S–mediated differentiation (HL-60: n = 14, P < .0001, 83.1% rescue; U937: n = 5, P = .0368, 68.9% rescue). (Q) p21 expression in cells transfected with pcDNA3 or pcDNA3-c-Myc and treated 48 hours after transfection with Veh or OSU-2S (1.75 µM [HL-60] or 2.5 µM [MV4-11], 8 hours). Representative western blot images and densitometric quantification of c-Myc (R) and p21 (S), normalized to actin. c-Myc overexpression significantly reversed OSU-2S–mediated p21 upregulation. *P < .05; **P < .01; ***P < .001; ****P < .0001.](https://ash.silverchair-cdn.com/ash/content_public/journal/blood/139/9/10.1182_blood.2020010344/6/m_bloodbld2020010344f5c.png?Expires=1769172022&Signature=CbGzlzqenRIr4DgWvUPTKBqF40kI0GAogOK2SX4G9ue7jWpkS~5bqekdtPhKoTd81aN6p5xRSs2z26VQHlrkQ759HHYAxr7ybfweN6ewvwB6QP4sDIvQtjqFRbIl1sgz0yk0O0jtC9nqJp7RGO~Syb1g~3NZxJ3wfYYeJ~IM5VQRkwHg0KiyOBOpsTzYnEGlFHEe6Xt80IAFh5tW0RKwfRqi5Mzfk85ZtCzX73q5Wm1rtkhe3wWgaScW-0SVunaH85uo8XtZU0WPZKru1YrN0lOOrYCaYzE571WjwH1ONCIAsXc6O6sd~Mgi7AcTeD8rXA6mFo4T3LJWvw3whZUQmQ__&Key-Pair-Id=APKAIE5G5CRDK6RD3PGA)
PP2A activation induced p21-mediated cell death and differentiation via c-Myc degradation. (A) HL-60 and MV4-11 cells treated with Veh or 2.5 μM OSU-2S resulted in increased p21 levels as evidenced by immunoblotting, representative images. Relative densitometric quantification is presented below the blots, as well as in the graph of p21 protein levels (B), normalized to the actin loading control. OSU-2S treatment significantly increased p21 protein expression. (C) Densitometric quantification of p21 immunoblotting, normalized to the actin loading control, and western blot images of primary AML cells treated with OSU-2S (3.5 μM, 16 hours). OSU-2S significantly induced p21 expression in primary AML. (D) Cells treated with OSU-2S (1.75 µM [HL-60] or 2.5 µM [MV4-11] for 8 hours) 24 hours after transfection with negative control (nc) or PP2Ac siRNA were probed for p21 expression by immunoblot analysis; representative images are shown. Relative densitometric quantification is presented as numbers below the blots, as well as in the graph of relative p21 protein levels (E), normalized to the actin loading control. OSU-2S–mediated p21 induction was significantly reversed by PP2Ac siRNA, confirming involvement of PP2A. (F) Relative viability (annexin V/PI) in cells transfected with nc siRNA or p21 siRNA (60 nM) and treated 24 hours after transfection with Veh and 1.75 µM OSU-2S (HL-60) or 2.5 µM OSU-2S (MV4-11, U937) for an additional 24 hours. p21 knockdown significantly rescued OSU-2S–mediated cytotoxicity (HL-60: n = 15, P < .0001, 70.3% rescue; MV4-11: n = 7, P < .0001, 58.5% rescue, U937: n = 5, P = .0007, 50.24% rescue). Immunoblot analysis (48 hours after transfection) confirmed p21 knockdown. (G) Percent CD11b + cells in HL-60 or U937 cells transfected with nc or p21 siRNA and treated 24 hours after transfection with Veh or OSU-2S (1.75 µM, 16-24 hours). p21 knockdown significantly reversed OSU-2S–mediated differentiation (HL-60: n = 12, P < .0001, 86.96% rescue; U937: n = 5, P = .0053, 94.29% rescue). (H) OSU-2S treatment (2.5 μM) resulted in c-Myc downmodulation in HL-60 and MV4-11 cells. (I) Representative western blot images and densitometric quantification of c-Myc protein levels, normalized to actin. (J) OSU-2S treatment (3.5 μM, 16 hours) resulted in c-Myc downmodulation in primary AML cells; western blot images and densitometric quantification. (K) Cells treated with OSU-2S (1.75 µM [HL-60] or 2.5 µM [MV4-11] for 8 hours) 24 hours after transfection with nc or PP2Ac siRNA were probed for c-Myc expression. (L) Representative western blot images and densitometric quantification of c-Myc, normalized to actin. OSU-2S–mediated c-Myc downregulation was significantly reversed by PP2A siRNA, as seen by immunoblot analysis, confirming involvement of PP2A. (M) Cells treated with OSU-2S (1.75 µM [HL-60] or 2.5 µM [MV4-11] for 8 hours) 24 hours after transfection with nc or B56α siRNA were probed for c-Myc expression. Representative western blot images and (N) densitometric quantification of c-Myc, normalized to actin. OSU-2S–mediated c-Myc downregulation was significantly reversed by PP2A B56α siRNA according to immunoblot analysis. (O) Percentage of relative viability (annexin V/PI) in cells transfected with empty pcDNA3 vector or pcDNA3-c-Myc and treated 48 hours after transfection with Veh and 1.75 µM OSU-2S (HL-60) or 2.5 µM OSU-2S (MV4-11, U937), for an additional 24 hours. c-Myc overexpression significantly rescued OSU-2S–mediated cytotoxicity (HL-60: n = 9, P = .0041, 86.7% rescue; MV4-11: n = 4, P = .0142, 87.35% rescue, U937: n = 5, P = .0013, 41.9% rescue). Immunoblot analysis (48 hours after transfection) confirmed c-Myc overexpression. (P) Percentage of CD11b+ cells in HL-60 or U937 cells transfected with pcDNA3 or pcDNA3-c-Myc and treated 48 hours after transfection with Veh or OSU-2S (1.75 µM for 16-24 hours). c-Myc overexpression significantly rescued OSU-2S–mediated differentiation (HL-60: n = 14, P < .0001, 83.1% rescue; U937: n = 5, P = .0368, 68.9% rescue). (Q) p21 expression in cells transfected with pcDNA3 or pcDNA3-c-Myc and treated 48 hours after transfection with Veh or OSU-2S (1.75 µM [HL-60] or 2.5 µM [MV4-11], 8 hours). Representative western blot images and densitometric quantification of c-Myc (R) and p21 (S), normalized to actin. c-Myc overexpression significantly reversed OSU-2S–mediated p21 upregulation. *P < .05; **P < .01; ***P < .001; ****P < .0001.
PP2A activation induced p21-mediated cell death and differentiation via c-Myc degradation. (A) HL-60 and MV4-11 cells treated with Veh or 2.5 μM OSU-2S resulted in increased p21 levels as evidenced by immunoblotting, representative images. Relative densitometric quantification is presented below the blots, as well as in the graph of p21 protein levels (B), normalized to the actin loading control. OSU-2S treatment significantly increased p21 protein expression. (C) Densitometric quantification of p21 immunoblotting, normalized to the actin loading control, and western blot images of primary AML cells treated with OSU-2S (3.5 μM, 16 hours). OSU-2S significantly induced p21 expression in primary AML. (D) Cells treated with OSU-2S (1.75 µM [HL-60] or 2.5 µM [MV4-11] for 8 hours) 24 hours after transfection with negative control (nc) or PP2Ac siRNA were probed for p21 expression by immunoblot analysis; representative images are shown. Relative densitometric quantification is presented as numbers below the blots, as well as in the graph of relative p21 protein levels (E), normalized to the actin loading control. OSU-2S–mediated p21 induction was significantly reversed by PP2Ac siRNA, confirming involvement of PP2A. (F) Relative viability (annexin V/PI) in cells transfected with nc siRNA or p21 siRNA (60 nM) and treated 24 hours after transfection with Veh and 1.75 µM OSU-2S (HL-60) or 2.5 µM OSU-2S (MV4-11, U937) for an additional 24 hours. p21 knockdown significantly rescued OSU-2S–mediated cytotoxicity (HL-60: n = 15, P < .0001, 70.3% rescue; MV4-11: n = 7, P < .0001, 58.5% rescue, U937: n = 5, P = .0007, 50.24% rescue). Immunoblot analysis (48 hours after transfection) confirmed p21 knockdown. (G) Percent CD11b + cells in HL-60 or U937 cells transfected with nc or p21 siRNA and treated 24 hours after transfection with Veh or OSU-2S (1.75 µM, 16-24 hours). p21 knockdown significantly reversed OSU-2S–mediated differentiation (HL-60: n = 12, P < .0001, 86.96% rescue; U937: n = 5, P = .0053, 94.29% rescue). (H) OSU-2S treatment (2.5 μM) resulted in c-Myc downmodulation in HL-60 and MV4-11 cells. (I) Representative western blot images and densitometric quantification of c-Myc protein levels, normalized to actin. (J) OSU-2S treatment (3.5 μM, 16 hours) resulted in c-Myc downmodulation in primary AML cells; western blot images and densitometric quantification. (K) Cells treated with OSU-2S (1.75 µM [HL-60] or 2.5 µM [MV4-11] for 8 hours) 24 hours after transfection with nc or PP2Ac siRNA were probed for c-Myc expression. (L) Representative western blot images and densitometric quantification of c-Myc, normalized to actin. OSU-2S–mediated c-Myc downregulation was significantly reversed by PP2A siRNA, as seen by immunoblot analysis, confirming involvement of PP2A. (M) Cells treated with OSU-2S (1.75 µM [HL-60] or 2.5 µM [MV4-11] for 8 hours) 24 hours after transfection with nc or B56α siRNA were probed for c-Myc expression. Representative western blot images and (N) densitometric quantification of c-Myc, normalized to actin. OSU-2S–mediated c-Myc downregulation was significantly reversed by PP2A B56α siRNA according to immunoblot analysis. (O) Percentage of relative viability (annexin V/PI) in cells transfected with empty pcDNA3 vector or pcDNA3-c-Myc and treated 48 hours after transfection with Veh and 1.75 µM OSU-2S (HL-60) or 2.5 µM OSU-2S (MV4-11, U937), for an additional 24 hours. c-Myc overexpression significantly rescued OSU-2S–mediated cytotoxicity (HL-60: n = 9, P = .0041, 86.7% rescue; MV4-11: n = 4, P = .0142, 87.35% rescue, U937: n = 5, P = .0013, 41.9% rescue). Immunoblot analysis (48 hours after transfection) confirmed c-Myc overexpression. (P) Percentage of CD11b+ cells in HL-60 or U937 cells transfected with pcDNA3 or pcDNA3-c-Myc and treated 48 hours after transfection with Veh or OSU-2S (1.75 µM for 16-24 hours). c-Myc overexpression significantly rescued OSU-2S–mediated differentiation (HL-60: n = 14, P < .0001, 83.1% rescue; U937: n = 5, P = .0368, 68.9% rescue). (Q) p21 expression in cells transfected with pcDNA3 or pcDNA3-c-Myc and treated 48 hours after transfection with Veh or OSU-2S (1.75 µM [HL-60] or 2.5 µM [MV4-11], 8 hours). Representative western blot images and densitometric quantification of c-Myc (R) and p21 (S), normalized to actin. c-Myc overexpression significantly reversed OSU-2S–mediated p21 upregulation. *P < .05; **P < .01; ***P < .001; ****P < .0001.
To test whether p21 upregulation plays a role in PP2A-mediated cell death and differentiation, we used anti-p21 siRNA to knock down p21 protein (Figure 5F), which resulted in increased leukemic viability and decreased CD11b expression (supplemental Figure 6B). p21 knockdown rescued OSU-2S–mediated cell death (Figure 5F) and prevented CD11b upregulation (Figure 5G), establishing a role for p21 in PP2A-mediated differentiation and death. A classic downstream target of p21 is hypophosphorylation of retinoblastoma (Rb), which induces cell cycle arrest.56,57 Consistent with this, we observed decreased phospho Rb (pRb) in mass cytometric analysis of AML cells (Figure 4A-B; supplemental Figure 5A). p21 knockdown rescued the OSU-2S–mediated decrease in pRb (supplemental Figure 6C-D), indicating that p21 controlled PP2A-mediated cell cycle arrest via Rb hypophosphorylation. Thus p21 induction serves as a potential molecular link between PP2A-induced proliferation arrest and terminal myeloid differentiation.
PP2A degrades c-Myc to induce p21, cell differentiation, and death
Various transcription factors including p53 and c-Myc58 regulate p21 levels. OSU-2S–induced upregulation of p21 is independent of p53, as evidenced by p21 induction in p53-null HL-60 cells. Further, we observed a strong decrease in c-Myc target signature in response to PP2A activation in our RNA-seq data analysis (Figure 2C), which includes p21 induction, suggesting a PP2A dependent c-Myc downregulation associated with p21 upregulation. Consistent with this hypothesis, we observed a reduction in c-Myc protein levels in HL-60, MV4-11, and primary AML cells with OSU-2S treatment (Figure 5H-J; supplemental Figure 6E) which was partly rescued by PP2Ac (Figure 5K-L) and B56α knockdown (Figure 5M-N), consistent with known c-Myc substrate specificity for B56α.59,60 We also observed reduced phospho-Ser62 c-Myc (p-c-Myc) with OSU-2S before downmodulation of total Myc (supplemental Figure 6F), consistent with previous reports that PP2A-mediated Ser62 dephosphorylation controls c-Myc stability in solid tumors.28,61
Overexpression of c-Myc in HL-60 cells using a pcDNA3-Myc overexpression construct62 increased leukemic cell viability while decreasing differentiation as evidenced by decrease in CD11b+ cells (supplemental Figure 6G). Importantly, c-Myc overexpression reversed OSU-2S–mediated cell death and differentiation (Figure 5O-P), establishing a role for c-Myc downmodulation in PP2A activation–dependent differentiation and death. Further, c-Myc overexpression prevented OSU-2S–mediated c-Myc downregulation and p21 upregulation (Figure 5Q-S), indicating that PP2A-mediated p21 upregulation is dependent on Myc downregulation.
OSU-2S drives cell maturation and therapeutic benefit in an immunocompetent Tet2−/−Flt3ITD/WT murine AML model
c-Myc is hyperactivated downstream of both Tet2 and Flt3 mutations in AML.63-66 We first evaluated the in vivo antileukemic effects of PP2A activation by OSU-2S in a cell line–derived xenograft (CDX) model using the Flt3ITD human AML cell line MV4-11. Treatment with OSU-2S, via both the IP and oral routes (60 mg/kg, 5 times per week), modestly improved survival and decreased tumor burden (supplemental Figure 7A-C). Dose-finding experiments showed that lower oral doses (10-60 mg/kg, 3 times per week, or 10-30 mg/kg, 7 times week; P = .089 at 30 mg/kg) were not efficacious (supplemental Methods). Further, comparatively limited differentiation potential of MV4-11 cells (supplemental Figure 4G) precluded in-depth assessment of the effect of PP2A on in vivo leukemic maturation and its therapeutic benefit. In addition, this model limits studies on the effect on leukemic stem cells (LSCs) in a normal immune microenvironment. Mutations in Tet2 and Flt3 together lead to poor prognosis and cooperatively induce spontaneous AML in mice with expansion of stem and progenitor cells,42 making the CD45.2+Vav-CrePOSTet2fl/flFlt3ITD/WT (Tet2−/−Flt3ITD) mouse model an optimal system to study changes in stem cell fate and maturation in an immunocompetent background.42 Adoptive transfer of lethally irradiated congenic CD45.1 mice recipients with CD45.2 leukemic cells from Tet2−/−Flt3ITD mice, along with CD45.1 BM established leukemia and reconstituted normal hematopoietic cells (Figure 6A). A few mice received CD45.1 BM transplants only (BMT only control). Consistent with previous reports,42 the Tet2−/−Flt3ITD leukemic cells expressed CD45.2, with a higher lineage negative (Lin−) population (supplemental Figure 8A) indicative of higher stem and progenitor cell counts. Both CD45.2 AML and CD45.1 support marrow had LSK (Lin−Sca+cKit+) stem cells. Analysis of the progenitor marker cKit and maturation marker Mac1, revealed 2.8-fold higher cKit+/Mac1− immature and 0.6-fold lower cKit−/Mac1+ mature populations in CD45.2 AML (supplemental Figure 8B).
![OSU-2S induces maturation and prolongs survival in a Tet2−/−Flt3ITD mutated murine AML model. (A) Workflow diagram depicting coinjection of CD45.2 expressing AML cells from Tet2−/−Flt3ITD donor and normal support marrow from CD45.1 donor in lethally irradiated CD45.1 mice to generate an immunocompetent AML model. BMT-only control mice received normal support marrow only. (B) OSU-2S (10 mg/kg, thrice a week, until the end of the study) treatment (IP) significantly prolonged survival of leukemic mice (n = 10 [Veh] and 11 [OSU-2S]; P = .022). (C) Mac1 (Mac1-APC) median fluorescence intensity (MFI) in CD45.2 BM of Veh (n = 3) and OSU-2S–treated mice (n = 5). OSU-2S treatment in vivo induced Mac1 expression (P = .0326). (D) Expression of maturation markers Mac1 and Ly6G (Ly6G-AF700) in BM and spleen of Veh and OSU-2S–treated mice, representative flow cytometry plots and graphs (E) showing quantification. OSU-2S treatment significantly increased the Mac1+ and Ly6G+ mature population in vivo. Representative flow cytometric plots (F) and quantification of progenitor marker cKit (cKit-PE Cy7) (G), and maturation marker Mac1 (Mac1-APC) in BM of Veh- and OSU-2S–treated mice (n = 3). OSU-2S treatment significantly lowered the immature cKit+/Mac1− (P = .021) and increased the mature cKit−/Mac1+ population (P = .0002) in the BM. Representative flow cytometric plots (I) and quantification of progenitor marker cKit (cKit-PE Cy7) and maturation marker Mac1 (Mac1-APC) (J) in the spleen of Veh- and OSU-2S–treated mice (n = 3). OSU-2S treatment significantly lowered the immature cKit+/Mac1− and increased the mature cKit−/Mac1+ population in the spleen. *P < .05; **P < .01; ***P < .001.](https://ash.silverchair-cdn.com/ash/content_public/journal/blood/139/9/10.1182_blood.2020010344/6/m_bloodbld2020010344f6a.png?Expires=1769172022&Signature=sQOQ7tPA2qZddWi3XYSHa3cvCua1Czhejp5f7a-7dsyjj1oXvzLOvF2n5cJv-wT6B~Q0Y38V8Fgv2jgt2rYyAXn7n25~4uYRqVVYCMyUyvXeWjo9OtijFGrpYJs6e4FthwUTUz1bAFijyifdg-MU4Jce5ILgLoYMLGqMbi8HjiGKlO0xEpXAAKyt35Yf8R6kT15J11Y4O16fD4JY8h7wJb6UwdYhDNuOBABFa2YjD8LKRuhqczFQh3~hM~q-4kUPUgV9cpWj7-x6PUwD4jHuYv72QG5GpGcdMOHPsYW~enVxP2rq6Ekr8M1~N3~Zz3KFUMp-pqRVKTUJo61yI96pbg__&Key-Pair-Id=APKAIE5G5CRDK6RD3PGA)
![OSU-2S induces maturation and prolongs survival in a Tet2−/−Flt3ITD mutated murine AML model. (A) Workflow diagram depicting coinjection of CD45.2 expressing AML cells from Tet2−/−Flt3ITD donor and normal support marrow from CD45.1 donor in lethally irradiated CD45.1 mice to generate an immunocompetent AML model. BMT-only control mice received normal support marrow only. (B) OSU-2S (10 mg/kg, thrice a week, until the end of the study) treatment (IP) significantly prolonged survival of leukemic mice (n = 10 [Veh] and 11 [OSU-2S]; P = .022). (C) Mac1 (Mac1-APC) median fluorescence intensity (MFI) in CD45.2 BM of Veh (n = 3) and OSU-2S–treated mice (n = 5). OSU-2S treatment in vivo induced Mac1 expression (P = .0326). (D) Expression of maturation markers Mac1 and Ly6G (Ly6G-AF700) in BM and spleen of Veh and OSU-2S–treated mice, representative flow cytometry plots and graphs (E) showing quantification. OSU-2S treatment significantly increased the Mac1+ and Ly6G+ mature population in vivo. Representative flow cytometric plots (F) and quantification of progenitor marker cKit (cKit-PE Cy7) (G), and maturation marker Mac1 (Mac1-APC) in BM of Veh- and OSU-2S–treated mice (n = 3). OSU-2S treatment significantly lowered the immature cKit+/Mac1− (P = .021) and increased the mature cKit−/Mac1+ population (P = .0002) in the BM. Representative flow cytometric plots (I) and quantification of progenitor marker cKit (cKit-PE Cy7) and maturation marker Mac1 (Mac1-APC) (J) in the spleen of Veh- and OSU-2S–treated mice (n = 3). OSU-2S treatment significantly lowered the immature cKit+/Mac1− and increased the mature cKit−/Mac1+ population in the spleen. *P < .05; **P < .01; ***P < .001.](https://ash.silverchair-cdn.com/ash/content_public/journal/blood/139/9/10.1182_blood.2020010344/6/m_bloodbld2020010344f6b.png?Expires=1769172022&Signature=pE3voDLJmLNf6rnRoHJkoKWaZpmRyadxIGObw-IxEJicIzhc6EH0Vn-gKjKsW4BAXASpmrxZ3BvJmeCbA1ug6Yf6emL4nLTGWD8z4p~N6XqUOxml-3vYpLyxHKeApk1J4RwzWaq6wiFMZuAMl6hdmIRbblLajx4iulDRxtN1CId2gApdYzR6yoM7xOJ6MsthyPwAe90rLN9Sjg3GbnHFrs6zvU6-oMD9NRY0TAW1HsTAfQ6wCNjLLpan-3W8goNzVKu-Vtf9OCPbwBd2p2jzAoPtIyaJOOuTrnjOZPL4sulp2C6XS4WG1NDfzRE92XV3G8m1A4me3bY5nADrr-DxTw__&Key-Pair-Id=APKAIE5G5CRDK6RD3PGA)
OSU-2S induces maturation and prolongs survival in a Tet2−/−Flt3ITD mutated murine AML model. (A) Workflow diagram depicting coinjection of CD45.2 expressing AML cells from Tet2−/−Flt3ITD donor and normal support marrow from CD45.1 donor in lethally irradiated CD45.1 mice to generate an immunocompetent AML model. BMT-only control mice received normal support marrow only. (B) OSU-2S (10 mg/kg, thrice a week, until the end of the study) treatment (IP) significantly prolonged survival of leukemic mice (n = 10 [Veh] and 11 [OSU-2S]; P = .022). (C) Mac1 (Mac1-APC) median fluorescence intensity (MFI) in CD45.2 BM of Veh (n = 3) and OSU-2S–treated mice (n = 5). OSU-2S treatment in vivo induced Mac1 expression (P = .0326). (D) Expression of maturation markers Mac1 and Ly6G (Ly6G-AF700) in BM and spleen of Veh and OSU-2S–treated mice, representative flow cytometry plots and graphs (E) showing quantification. OSU-2S treatment significantly increased the Mac1+ and Ly6G+ mature population in vivo. Representative flow cytometric plots (F) and quantification of progenitor marker cKit (cKit-PE Cy7) (G), and maturation marker Mac1 (Mac1-APC) in BM of Veh- and OSU-2S–treated mice (n = 3). OSU-2S treatment significantly lowered the immature cKit+/Mac1− (P = .021) and increased the mature cKit−/Mac1+ population (P = .0002) in the BM. Representative flow cytometric plots (I) and quantification of progenitor marker cKit (cKit-PE Cy7) and maturation marker Mac1 (Mac1-APC) (J) in the spleen of Veh- and OSU-2S–treated mice (n = 3). OSU-2S treatment significantly lowered the immature cKit+/Mac1− and increased the mature cKit−/Mac1+ population in the spleen. *P < .05; **P < .01; ***P < .001.
OSU-2S induces maturation and prolongs survival in a Tet2−/−Flt3ITD mutated murine AML model. (A) Workflow diagram depicting coinjection of CD45.2 expressing AML cells from Tet2−/−Flt3ITD donor and normal support marrow from CD45.1 donor in lethally irradiated CD45.1 mice to generate an immunocompetent AML model. BMT-only control mice received normal support marrow only. (B) OSU-2S (10 mg/kg, thrice a week, until the end of the study) treatment (IP) significantly prolonged survival of leukemic mice (n = 10 [Veh] and 11 [OSU-2S]; P = .022). (C) Mac1 (Mac1-APC) median fluorescence intensity (MFI) in CD45.2 BM of Veh (n = 3) and OSU-2S–treated mice (n = 5). OSU-2S treatment in vivo induced Mac1 expression (P = .0326). (D) Expression of maturation markers Mac1 and Ly6G (Ly6G-AF700) in BM and spleen of Veh and OSU-2S–treated mice, representative flow cytometry plots and graphs (E) showing quantification. OSU-2S treatment significantly increased the Mac1+ and Ly6G+ mature population in vivo. Representative flow cytometric plots (F) and quantification of progenitor marker cKit (cKit-PE Cy7) (G), and maturation marker Mac1 (Mac1-APC) in BM of Veh- and OSU-2S–treated mice (n = 3). OSU-2S treatment significantly lowered the immature cKit+/Mac1− (P = .021) and increased the mature cKit−/Mac1+ population (P = .0002) in the BM. Representative flow cytometric plots (I) and quantification of progenitor marker cKit (cKit-PE Cy7) and maturation marker Mac1 (Mac1-APC) (J) in the spleen of Veh- and OSU-2S–treated mice (n = 3). OSU-2S treatment significantly lowered the immature cKit+/Mac1− and increased the mature cKit−/Mac1+ population in the spleen. *P < .05; **P < .01; ***P < .001.
OSU-2S treatment (IP, 10 mg/kg, 3 times per week) led to a significant survival benefit (Figure 6B, mean survival 288 days [OSU-2S)] vs 181 days (Veh]). OSU-2S did not compromise the reconstitution or growth of normal healthy CD45.1 immune cell compartment in the irradiated mice as all cohorts recovered comparable to normal levels of CD45.1 cells by weeks 7 through 10 (supplemental Figure 8C). Interestingly, although OSU-2S treatment did not significantly reduce the percentage of circulating CD45.2 cells initially (supplemental Figure 8D), end point analysis revealed a sevenfold increased expression of the maturation marker Mac1 and an increased proportion of Mac1+/Ly6G+ mature cells in the CD45.2 leukemic population in BM and spleen of leukemic mice (Figure 6C-E), indicating that OSU-2S drives maturation of leukemic cells in vivo.
PP2A activation decreases stemness in vivo and ex vivo
OSU-2S–driven maturation ex vivo and in vivo prompted us to study the effect of PP2A activation on leukemia-initiating stem cells. End point analysis of BM cells and splenocytes from Tet2−/−Flt3ITD murine AML model showed reduced cKit+/Mac1− immature cells (0.4-fold) and increased cKit−/Mac1+ mature cells (2.4-fold) in the BM and spleen of leukemic mice (Figure 6F-I).
OSU-2S treatment also resulted in a significant decrease in the proportion of Lin− cells in the OSU-2S cohort (mean decrease, 32.86%; Figure 7A; supplemental Figure 9A), reducing it close to levels in CD45.1-engrafted BMT-only mice. A decrease in LSK cells, the leukemia-initiating population,42 was observed in BM of OSU-2S–treated mice (supplemental Figure 9B). Reduction in the leukemia initiating population was further confirmed by significantly reduced CFUs from BM cells from OSU-2S–treated mice compared with vehicle (Figure 7B) which persisted after secondary replating (supplemental Figure 9C). These observations indicate that OSU-2S reduced the leukemic stem and progenitor compartments, reversing the predominantly immature phenotype characteristic of Tet2−/−Flt3ITD murine leukemia.
![PP2A activation decreases stemness in vivo and ex vivo. (A) Proportion of lineage negative (Lin−) cells in the CD45.2 AML cell population on Veh (n = 3) or OSU-2S (n = 5), in BM of treated mice or BMT only control mice. OSU-2S–treated mice have significant lower proportion of CD45.2 (AML) Lin− cells as detected in the BM (P = .0011), indicating lower leukemic stem and progenitors. (B) Number of colonies (colony forming units [CFU]) formed by cells isolated from BM of Veh- or OSU-2S–treated mice (n = 7). OSU-2S–treated mice BM have significantly lower colony forming units vs that of Veh-treated mice (P = .0022). *P < .05; **P < .01; ***P < .001; ****P < .0001. (C) Mass cytometric analysis of primary AML cells treated with Veh or OSU-2S (3.5 μM, 48 hours) reveals decreased surface progenitor marker CD34, decreased CD34+/CD38− LSCs and increased more mature CD34−/CD38+ or CD34−/CD38− cells. (D) Representative SPADE analysis run on primary AML cells (n = 3) treated with Veh or OSU-2S, clustering on 23 CD markers revealed a decrease in CD34+/CD38− LSCs and CD34+/CD38+ and progenitor population. The T-cell population was unchanged. The patient-derived samples had minimum to no B cells. The number of cells is denoted by node size. Color scheme denotes intensity of pRb which also decreases with OSU-2S. (E) Percentage of relative colony forming units (CFUs) in primary AML cells (IC50, 0.147 µM) vs nonleukemic CD34+ cells (IC50, 1.107 µM) treated with OSU-2S, plated on methylcellulose and counted 2 weeks after. Primary AMLs have sevenfold higher sensitivity to OSU-2S. (F) Schematic of the limiting dilution assay (LDA) and bulk LTC-IC assay performed on primary AML samples and normal donor cord blood and BM cells. (G) Fold LTC-IC frequency of Veh- and OSU-2S (0.5 µM)–treated primary AML and normal donor samples (n = 6, AML 1, 15, 22, 26, 35, and 36). OSU-2S treatment significantly decreased the frequency of LTC-IC in primary AML samples. No significant difference was observed in nonleukemic samples (n = 4). (H) The PP2A-mediated model of growth arrest and differentiation in AML. OSU-2S disrupts SET-PP2A interaction, reactivating PP2A in leukemic cells. PP2A dephosphorylates Myc, leading to Myc degradation and relieving Myc-mediated suppression of p21. Induction of p21 results in hypophosphorylation of Rb, arresting cells at S phase entry, and arrested cells undergo differentiation, possibly via CEBP factors activated by Rb or other differentiation factors induced by p21 or Rb, resulting in upregulation of differentiation markers and downregulation of stemness markers. *P < .05; **P < .01; ***P < .001.](https://ash.silverchair-cdn.com/ash/content_public/journal/blood/139/9/10.1182_blood.2020010344/6/m_bloodbld2020010344f7a.png?Expires=1769172022&Signature=YoI-eF7WoYObwMCWeCW4IusIZezHgXU55c3Ul2nw~ADWz1MaJkFjvLZbyIoFNFESk4PUamg7AN6UUxhpoB-Uq0jbnbsqPbEC5uGei6fA9MlyBuTXtWpLwjdpWKp0C517N0wSxR6K9V6QDsmvRAZTnak1GvVcFchjZpTrX0Y1iqAGE7oOLjvrCs-Ryn0jlA3xhvS6O-CBjKs7eiWMsaba~NT81AxNLjVOVNgDU6efCWYYXun-urPghwp53qSgRAwHzv7LrTFlo6idLgJxzJjsYfggInEEZQLrYu4CuWiZ08dmFfahYr1Jfu~XkoSB7ldMonwBSb3qfWbbg9fH2is6aQ__&Key-Pair-Id=APKAIE5G5CRDK6RD3PGA)
![PP2A activation decreases stemness in vivo and ex vivo. (A) Proportion of lineage negative (Lin−) cells in the CD45.2 AML cell population on Veh (n = 3) or OSU-2S (n = 5), in BM of treated mice or BMT only control mice. OSU-2S–treated mice have significant lower proportion of CD45.2 (AML) Lin− cells as detected in the BM (P = .0011), indicating lower leukemic stem and progenitors. (B) Number of colonies (colony forming units [CFU]) formed by cells isolated from BM of Veh- or OSU-2S–treated mice (n = 7). OSU-2S–treated mice BM have significantly lower colony forming units vs that of Veh-treated mice (P = .0022). *P < .05; **P < .01; ***P < .001; ****P < .0001. (C) Mass cytometric analysis of primary AML cells treated with Veh or OSU-2S (3.5 μM, 48 hours) reveals decreased surface progenitor marker CD34, decreased CD34+/CD38− LSCs and increased more mature CD34−/CD38+ or CD34−/CD38− cells. (D) Representative SPADE analysis run on primary AML cells (n = 3) treated with Veh or OSU-2S, clustering on 23 CD markers revealed a decrease in CD34+/CD38− LSCs and CD34+/CD38+ and progenitor population. The T-cell population was unchanged. The patient-derived samples had minimum to no B cells. The number of cells is denoted by node size. Color scheme denotes intensity of pRb which also decreases with OSU-2S. (E) Percentage of relative colony forming units (CFUs) in primary AML cells (IC50, 0.147 µM) vs nonleukemic CD34+ cells (IC50, 1.107 µM) treated with OSU-2S, plated on methylcellulose and counted 2 weeks after. Primary AMLs have sevenfold higher sensitivity to OSU-2S. (F) Schematic of the limiting dilution assay (LDA) and bulk LTC-IC assay performed on primary AML samples and normal donor cord blood and BM cells. (G) Fold LTC-IC frequency of Veh- and OSU-2S (0.5 µM)–treated primary AML and normal donor samples (n = 6, AML 1, 15, 22, 26, 35, and 36). OSU-2S treatment significantly decreased the frequency of LTC-IC in primary AML samples. No significant difference was observed in nonleukemic samples (n = 4). (H) The PP2A-mediated model of growth arrest and differentiation in AML. OSU-2S disrupts SET-PP2A interaction, reactivating PP2A in leukemic cells. PP2A dephosphorylates Myc, leading to Myc degradation and relieving Myc-mediated suppression of p21. Induction of p21 results in hypophosphorylation of Rb, arresting cells at S phase entry, and arrested cells undergo differentiation, possibly via CEBP factors activated by Rb or other differentiation factors induced by p21 or Rb, resulting in upregulation of differentiation markers and downregulation of stemness markers. *P < .05; **P < .01; ***P < .001.](https://ash.silverchair-cdn.com/ash/content_public/journal/blood/139/9/10.1182_blood.2020010344/6/m_bloodbld2020010344f7b.png?Expires=1769172022&Signature=SRosPAo5NokGjaLBZbuQMt18b8kOHi76Wi8~pW1avGT7jjauEc6CDalhSZu90vkGdtibut~yorwHHvCMi8ChBUOOOFhh8IEst6GyrhMFv8g8Eep0WWDfgMeZvXUWwUkR7-9GyJGan1XQD0KQN50uBWXD2SbUf9bNcFqAYoBLWokUfqF8d3i1W~2Jww6LpNTTgDwj35Cyqvs51QnJVGWalbdheq1tUsya6MyOPlBX8i2iTnxvDQLJvXXX0Uj4Zh1Cppumktord2SzH897hQMm8RokhzDMWw3v1JIg795ErB7g-DtSLcQMWHhAlr8WFRCFJ8OOZSoRtj5Bws6arUGaEA__&Key-Pair-Id=APKAIE5G5CRDK6RD3PGA)
PP2A activation decreases stemness in vivo and ex vivo. (A) Proportion of lineage negative (Lin−) cells in the CD45.2 AML cell population on Veh (n = 3) or OSU-2S (n = 5), in BM of treated mice or BMT only control mice. OSU-2S–treated mice have significant lower proportion of CD45.2 (AML) Lin− cells as detected in the BM (P = .0011), indicating lower leukemic stem and progenitors. (B) Number of colonies (colony forming units [CFU]) formed by cells isolated from BM of Veh- or OSU-2S–treated mice (n = 7). OSU-2S–treated mice BM have significantly lower colony forming units vs that of Veh-treated mice (P = .0022). *P < .05; **P < .01; ***P < .001; ****P < .0001. (C) Mass cytometric analysis of primary AML cells treated with Veh or OSU-2S (3.5 μM, 48 hours) reveals decreased surface progenitor marker CD34, decreased CD34+/CD38− LSCs and increased more mature CD34−/CD38+ or CD34−/CD38− cells. (D) Representative SPADE analysis run on primary AML cells (n = 3) treated with Veh or OSU-2S, clustering on 23 CD markers revealed a decrease in CD34+/CD38− LSCs and CD34+/CD38+ and progenitor population. The T-cell population was unchanged. The patient-derived samples had minimum to no B cells. The number of cells is denoted by node size. Color scheme denotes intensity of pRb which also decreases with OSU-2S. (E) Percentage of relative colony forming units (CFUs) in primary AML cells (IC50, 0.147 µM) vs nonleukemic CD34+ cells (IC50, 1.107 µM) treated with OSU-2S, plated on methylcellulose and counted 2 weeks after. Primary AMLs have sevenfold higher sensitivity to OSU-2S. (F) Schematic of the limiting dilution assay (LDA) and bulk LTC-IC assay performed on primary AML samples and normal donor cord blood and BM cells. (G) Fold LTC-IC frequency of Veh- and OSU-2S (0.5 µM)–treated primary AML and normal donor samples (n = 6, AML 1, 15, 22, 26, 35, and 36). OSU-2S treatment significantly decreased the frequency of LTC-IC in primary AML samples. No significant difference was observed in nonleukemic samples (n = 4). (H) The PP2A-mediated model of growth arrest and differentiation in AML. OSU-2S disrupts SET-PP2A interaction, reactivating PP2A in leukemic cells. PP2A dephosphorylates Myc, leading to Myc degradation and relieving Myc-mediated suppression of p21. Induction of p21 results in hypophosphorylation of Rb, arresting cells at S phase entry, and arrested cells undergo differentiation, possibly via CEBP factors activated by Rb or other differentiation factors induced by p21 or Rb, resulting in upregulation of differentiation markers and downregulation of stemness markers. *P < .05; **P < .01; ***P < .001.
PP2A activation decreases stemness in vivo and ex vivo. (A) Proportion of lineage negative (Lin−) cells in the CD45.2 AML cell population on Veh (n = 3) or OSU-2S (n = 5), in BM of treated mice or BMT only control mice. OSU-2S–treated mice have significant lower proportion of CD45.2 (AML) Lin− cells as detected in the BM (P = .0011), indicating lower leukemic stem and progenitors. (B) Number of colonies (colony forming units [CFU]) formed by cells isolated from BM of Veh- or OSU-2S–treated mice (n = 7). OSU-2S–treated mice BM have significantly lower colony forming units vs that of Veh-treated mice (P = .0022). *P < .05; **P < .01; ***P < .001; ****P < .0001. (C) Mass cytometric analysis of primary AML cells treated with Veh or OSU-2S (3.5 μM, 48 hours) reveals decreased surface progenitor marker CD34, decreased CD34+/CD38− LSCs and increased more mature CD34−/CD38+ or CD34−/CD38− cells. (D) Representative SPADE analysis run on primary AML cells (n = 3) treated with Veh or OSU-2S, clustering on 23 CD markers revealed a decrease in CD34+/CD38− LSCs and CD34+/CD38+ and progenitor population. The T-cell population was unchanged. The patient-derived samples had minimum to no B cells. The number of cells is denoted by node size. Color scheme denotes intensity of pRb which also decreases with OSU-2S. (E) Percentage of relative colony forming units (CFUs) in primary AML cells (IC50, 0.147 µM) vs nonleukemic CD34+ cells (IC50, 1.107 µM) treated with OSU-2S, plated on methylcellulose and counted 2 weeks after. Primary AMLs have sevenfold higher sensitivity to OSU-2S. (F) Schematic of the limiting dilution assay (LDA) and bulk LTC-IC assay performed on primary AML samples and normal donor cord blood and BM cells. (G) Fold LTC-IC frequency of Veh- and OSU-2S (0.5 µM)–treated primary AML and normal donor samples (n = 6, AML 1, 15, 22, 26, 35, and 36). OSU-2S treatment significantly decreased the frequency of LTC-IC in primary AML samples. No significant difference was observed in nonleukemic samples (n = 4). (H) The PP2A-mediated model of growth arrest and differentiation in AML. OSU-2S disrupts SET-PP2A interaction, reactivating PP2A in leukemic cells. PP2A dephosphorylates Myc, leading to Myc degradation and relieving Myc-mediated suppression of p21. Induction of p21 results in hypophosphorylation of Rb, arresting cells at S phase entry, and arrested cells undergo differentiation, possibly via CEBP factors activated by Rb or other differentiation factors induced by p21 or Rb, resulting in upregulation of differentiation markers and downregulation of stemness markers. *P < .05; **P < .01; ***P < .001.
To confirm that the OSU-2S-induced cKit−/Mac1+ population stems from maturation of undifferentiated cKit+/Mac1− cells, we sorted progenitor-like cKit+/Mac1− cells from untreated mice (supplemental Figure 9D) by fluorescence–activated cell sorting (FACS) and treated them in vitro with vehicle or OSU-2S for 3 to 6 days. OSU-2S treatment induced increased differentiation of FACS-sorted cKit+/Mac1− cells into mature cKit−/Mac1+ cells (supplemental Figure 9E).
Our observations in murine LSCs prompted us to evaluate the effect of PP2A activation on human LSCs,67 identified as predominantly CD34+/CD38− cells. Mass cytometry of primary human AMLs treated with OSU-2S showed a decrease (0.66-fold) in the progenitor marker CD34 (Figure 7C; supplemental Figure 5A) and decreased CD34+/CD38− LSCs and CD34+/CD38+ progenitor cells, with increased mature CD34−/CD38+ and CD34−/CD38− cells (Figure 7C). Spanning-tree Progression Analysis of Density-normalized Events (SPADE)68 analysis of OSU-2S-treated primary AML cells using 23 lineage markers, including CD34 and CD38, as well as B-, T-, and myeloid cell markers (supplemental Table 4), also confirmed a decrease in CD34+/CD38− and CD34+/CD38+ populations (Figure 7D). A decrease in the LSC population was also indicated by decreased colony forming with OSU-2S in methylcellulose-based CFU assays (Figure 7E; supplemental Figure 9F). To test the effect of OSU-2S on nonleukemic hematopoietic stem and progenitors (HSPCs), we enriched CD34+ cells from cord blood or stem cell–mobilized samples. Although a trend toward CFU reduction was seen at higher OSU-2S concentrations (supplemental Figure 9G), normal HSPCs showed nearly 7.5-fold decreased sensitivity to OSU-2S (Figure 7E; IC50 [AML]: 0.147 µM vs IC50 [nonleukemic]: 1.107 µM). To further assess long-term culture-initiating cells (LTC-ICs), limiting dilution assays (LDA) and bulk LTC-IC assays69 were performed with primary AML cells and normal donor cord blood and BM. OSU-2S significantly reduced the frequency of LTC-IC and LTC-IC–derived CFUs in AML, but not that of normal donor samples (Figure 7F-G; supplemental Figure 9H-I).
Discussion
The tumor suppressor PP2A is reported as oncogenic in some leukemias,70,71 whereas it is widely suppressed in AML. Indeed, the precise contribution of PP2A to leukemic cell fate and oncogenesis remains elusive. Our study identified a pivotal role for PP2A in the control of cell proliferation vs differentiation decisions in AML through a PP2A/c-Myc/p21 axis (Figure 7H). Importantly, we demonstrated that PP2A activation decreases leukemia-initiating cells, induces leukemic blast maturation, and improves overall survival in murine AML models. These findings indicate a clear role for PP2A suppression in disrupted hematopoietic differentiation and growth in AML pathogenesis which can be therapeutically targeted through PP2A activation.
Our finding that PP2A-driven maturation of AML depends on c-Myc downmodulation implicates a critical decision point in the malignant hematopoiesis. c-Myc is tightly regulated in normal hematopoiesis,72,73 and failure to turn off Myc impedes terminal myeloid differentiation and causes AML in mice.74 We show that PP2A activation reverses c-Myc–mediated maturation block and promotes terminal differentiation in AML. Considering that c-Myc is overexpressed in ∼90% of AML75 and is activated downstream of various driver mutations,63-6574 PP2A-mediated Myc degradation can induce differentiation across diverse AML subsets. Consistent with this, OSU-2S has shown potent activity across primary AMLs with diverse mutational/cytogenetic features (supplemental Table 1). Myc-mediated blockage of differentiation and dedifferentiation are also important in the pathogenesis of multiple other cancers, including breast cancer,76 Burkitt lymphoma,77 and pancreatic tumors.78 Despite its broad dysregulation in cancers, Myc targeting remains challenging. Hence, PP2A-mediated control of Myc by OSU-2S has potential as a therapeutic driver of terminal differentiation across multiple cancers.
Development of PP2A activators has been more challenging than development of kinase inhibitors. However, recent advances have significantly improved our understanding of targeting specific PP2A heterotrimers and have characterized 2 promising classes of phenothiazine derivatives: iHAPs, which activate B56ε, and SMAPs, which activate B56α containing PP2A heterotrimers.59,79 Targeting specific heterotrimers provide substrate selectivity, however, can be limited in cancers that rely on inactivation of several B-subunit isoforms such as AML. Targeting broad PP2A inhibitors such as SET can be useful in targeting a wider range of PP2A holoenzymes. However, although OSU-2S can activate multiple PP2A isoforms (Figure 1; supplemental Figure 1A), its antileukemic activity may depend on specific PP2A subunits. Although our knockdown studies indicate a specific involvement of PP2A-B56α and PP2Acα subunits in mediating cytotoxicity and differentiation in AML, a detailed assessment of involvement of different subunits remains to be evaluated.
Terminal myeloid differentiation markers in arrested leukemic cells indicate that PP2A-mediated cell cycle arrest and differentiation are molecularly linked, possibly by p21-mediated regulation of pRb. We showed that PP2A-mediated p21 induction is p53 independent and is at least in part related to c-Myc downregulation; however, the possible recruitment of p21 transcriptional activators, such as the KLF factors upregulated in our experiments, remains to be tested.80,81 p21 mediates Rb hypophosphorylation and decreased E2F signatures. Further, Rb has been known to activate CEBP factors, which are the master regulators of myeloid differentiation and the factors often mutated in patients with AML.82,83 Interestingly, our findings of increased CEBPβ expression support our proposed PP2A-Myc-p21-Rb-CEBP pathway (Figure 7H) in myeloid differentiation and cell cycle arrest, pending further confirmatory studies on the role of Rb and CEBPβ.
AML is a heterogeneous disease with varying oncogenic drivers; however, PP2A is inactivated across most cases of AML.11 Despite the variability in response, PP2A reactivation by OSU-2S showed antitumor activity across diverse AML subtypes (Figure 1D; supplemental Figure 1F). Although the observed variabilities, such as the lack of differentiation in AML16 or difference in cytotoxicity across samples as seen in AML 20, 26, and 36 (supplemental Figures 1F and 4F), can be attributed to differences in the levels and/or activity of PP2A, our limited analysis did not support this possibility (supplemental Figure 1L-M). This finding raises the question of additional contributors, including but not limited to differences in levels and/or regulation of additional oncogenic events or PP2A downstream targets. Consistent with this possibility, we also observed dephosphorylation of additional PP2A targets, such as phospho-ERK30 with OSU-2S (supplemental Figures 5A and 10A). In addition, the FAB subtype may play a role, as some M1 samples such as AML16 and AML36 are less sensitive than the M4 and M5 subtypes such as AML1-4 and AML35. Interestingly, OSU-2S–mediated ERK dephosphorylation may have potential as ERK inhibition is anticipated to be more effective in targeting oncogenic MAPK signaling and is overall underexploited in leukemias.84 OSU-2S also synergized85 in vitro with the conventional therapy cytarabine (Ara-C) (supplemental Figure 10B), which can be promising in designing therapeutic combination strategies for less sensitive patients.
OSU-2S has been shown to mediate protein kinase C (PKC)–related apoptosis in hepatocellular carcinoma86; however siRNA knockdown of PKC failed to abrogate OSU-2S–mediated activity in AML (supplemental Figure 10C), indicating that PKC is not involved in OSU-2S–mediated antileukemic effects in AML. Consistent with this finding, as a part of comprehensive analysis on OSU-2S specificity, a site-directed, competition-binding kinome screening87 failed to significantly affect nontarget kinases (supplemental Figure 10D).
Immunosuppression is not only a side effect of many of the chemotherapeutic drugs used for standard AML induction therapy, it also hinders the clinical translation of traditional nonspecific PP2A activators such as FTY720. However, we found that although PP2A activation by OSU-2S decreases human and murine LSCs in vitro and in vivo, it has a more than sevenfold decreased effect on normal HSPCs (Figure 7E), which is of translational relevance. Importantly, OSU-2S did not affect normal immune cell reconstitution in mice. Our recent pharmacoanalytical and tolerability experiments, demonstrating favorable pharmacokinetic properties of OSU-2S in dogs, support establishing trials of OSU-2S efficacy in dogs with spontaneous tumors to guide its clinical development for canine and human patients.43 Collectively, these data provide compelling evidence that OSU-2S can specifically target broad maturation and proliferation defects across multiple AML subtypes while preserving normal immune microenvironment by reactivating PP2A. Our studies identify the tumor suppressive role of phosphatases in cancer cell fate and provide a framework for therapeutic targeting in AML and other malignancies with suppressed phosphatase activity.
Acknowledgments
The authors thank the patients who contributed to these studies; David Lucas, Lapo Alinari, Donna Bucci, and Christopher Mannings of the OSU Comprehensive Cancer Center Leukemia Tissue Bank Shared Resource and the Genomics Shared Resource (National Institutes of Health, National Cancer Institute grant P30CA016058); and Ross Levine, Memorial Sloan-Kettering Cancer Center, for the kind donation of CD45.2+Vav-CrePOSTet2fl/flFlt3ITD/WT mice.
This work was supported by NIH, National Cancer Institute (NCI) grants R01CA197844-01, P50CA140158, and R35CA198183, Antony Leukemia Lauber Funds and Robert J. Anthony 388 Leukemia Fund. S.G. is funded by NIH, NCI grant 1F99CA245813-01 and previously by a Pelotonia Graduate Fellowship.
Authorship
Contribution: S.G. planned and designed the experiments, analyzed the data, and wrote the drafts of the article; R.M., J.N., C.-L.C., E.H., F.F., R.D., A.V., Z.X., M.C., L.A.W., and Y.-T.T. assisted with the experiments; R.M. designed and analyzed the data for the murine AML model; K.Z. and L.B. assisted with the animal experiments; X.M. performed the statistical analysis; P.Y., R.B., G.B., J.C.B., C.B., M.P., R.L., and E.H. provided the necessary expertise and supported components of the research; J.C.B., A.W., A.M., K.L., N.G., and S.V. contributed to the AML/MDS patient care and/or translation insight; and N.M. conceived the idea, designed the experiments, supervised the study, sought funding, reviewed drafts, and approved the final version for submission.
Conflict-of-interest disclosure: N.M. and J.C.B. are coinventors of OSU-2S, for which The Ohio State University owns the patent. The remaining authors declare no competing financial interests.
Correspondence: Natarajan Muthusamy, Department of Internal Medicine, The Ohio State University Comprehensive Cancer Center, 455E OSUCCC Building, 410 West 12th Avenue, Columbus, OH 43210; e-mail: raj.muthusamy@osumc.edu.
Raw sequencing data are available from the National Center for Biotechnology Information Gene expression Omnibus (NCBI GEO) (accession number GSE148018).
Requests for data sharing may be submitted to Natarajan Muthusamy (raj.muthusamy@osumc.edu)
The online version of this article contains a data supplement.
There is a Blood Commentary on this article in this issue.
The publication costs of this article were defrayed in part by page charge payment. Therefore, and solely to indicate this fact, this article is hereby marked "advertisement" in accordance with 18 USC section 1734.

This feature is available to Subscribers Only
Sign In or Create an Account Close Modal