

Key Points
The RNA binding protein SRSF3 is essential for megakaryocyte maturation and platelet production.
SRSF3-deficient megakaryocytes fail to reprogram their transcriptome during maturation and sort functionally important RNAs into platelets.

Abstract
RNA processing is increasingly recognized as a critical control point in the regulation of different hematopoietic lineages including megakaryocytes responsible for the production of platelets. Platelets are anucleate cytoplasts that contain a rich repertoire of RNAs encoding proteins with essential platelet functions derived from the parent megakaryocyte. It is largely unknown how RNA binding proteins contribute to the development and functions of megakaryocytes and platelets. We show that serine-arginine–rich splicing factor 3 (SRSF3) is essential for megakaryocyte maturation and generation of functional platelets. Megakaryocyte-specific deletion of Srsf3 in mice led to macrothrombocytopenia characterized by megakaryocyte maturation arrest, dramatically reduced platelet counts, and abnormally large functionally compromised platelets. SRSF3 deficient megakaryocytes failed to reprogram their transcriptome during maturation and to load platelets with RNAs required for normal platelet function. SRSF3 depletion led to nuclear accumulation of megakaryocyte mRNAs, demonstrating that SRSF3 deploys similar RNA regulatory mechanisms in megakaryocytes as in other cell types. Our study further suggests that SRSF3 plays a role in sorting cytoplasmic megakaryocyte RNAs into platelets and demonstrates how SRSF3-mediated RNA processing forms a central part of megakaryocyte gene regulation. Understanding SRSF3 functions in megakaryocytes and platelets provides key insights into normal thrombopoiesis and platelet pathologies as SRSF3 RNA targets in megakaryocytes are associated with platelet diseases.
Introduction
Platelets produced by bone marrow megakaryocytes (MKs) are anucleate cytoplasts that play a critical role in normal hemostasis, including vascular integrity, wound healing, and activation of inflammatory and immune responses.1 MK maturation culminating in platelet release involves polyploidisation through endomitosis, establishment of complex membrane system, cytoplasmic expansion, and generation of platelet granules.2,3 The complexity of platelet biogenesis is reflected in a range of platelet disorders characterized by abnormal platelet numbers and/or function.4,5
Although transcription factors guide lineage decisions,2,6-11 the discovery of frequent mutations in splicing factor genes such as SF3B1, U2AF1, and SRSF2 in myelodysplastic syndrome patients first demonstrated the critical role of posttranscriptional gene regulation during normal hematopoiesis.12-18 The identification of a widespread intron retention in MK progenitors and in vitro differentiated fetal liver CD41+ MKs suggests that RNA processing plays a central role in tuning MK gene expression.15 Furthermore, mutations in the RNA binding protein encoding gene RBM8A cause thrombocytopenia-absent radius syndrome.19 Although platelets do not have a nucleus, they contain RNA derived from the parent MK. RNA processing and translation machineries are present in platelets, and alterations in platelet RNA content reflect changes in platelet function.20-23 Both RNA deposition by MKs and RNA degradation in platelets are regulated, but the factors controlling these processes are largely unknown.24,25
RNA binding proteins are required at every step of RNA biogenesis and, thereby, modify the RNA repertoire of cells. Serine-arginine–rich splicing factor 3 (SRSF3) belongs to the family of SR proteins originally identified as essential pre–messenger RNA (mRNA) splicing factors but their functions now expand to most steps of RNA metabolism.26-33 SRSF3 regulates distinct sets of RNAs in a cell type–specific manner through multiple RNA processing pathways.27,32-34 Although some SRSF3 target RNAs are shared between different cells types, many are cell type specific, suggesting distinct SRSF3 functions in each cell type.27,34 The physiological role of SRSF3 has not been extensively explored because the systemic deletion of Srsf3 in mice is embryonically lethal.33,35,36 The hepatocyte-specific deletion of Srsf3 in mice led to impaired hepatocyte differentiation, whereas in the B-cell lineage it resulted in a reduction of immature and mature B cells.37,38 At the cellular level, SRSF3 has been shown to regulate cell proliferation, cell cycle progression, and apoptosis in both normal and tumor cells.33,39-41
Our phenotypic analysis of the systemic heterozygous Srsf3 knockout (KO) mice revealed reduced platelet counts, suggesting a role for SRSF3 in platelet production. MK-specific deletion of Srsf3 (Pf4-Srsf3Δ/Δ) demonstrated a hitherto unknown and critical role for SRSF3 in MK maturation and platelet biogenesis. SRSF3 depletion led to a MK maturation defect and drastically reduced platelet counts. RNA-sequencing of subpopulations of MKs demonstrated that Pf4-Srsf3Δ/Δ MKs failed to reprogram their transcriptome during maturation. Similar to other cell types, SRSF3 regulated functionally related sets of MK RNAs. SRSF3 acted as mRNA export factor in MKs, its depletion leading to the nuclear accumulation of key MK mRNAs. The RNA content of Pf4-Srsf3Δ/Δ platelets was abnormal, with ∼6000 dysregulated RNAs, suggesting SRSF3 plays a cytoplasmic role in sorting MK RNAs into platelets. The failure of SRSF3-deficient MKs to reprogram their transcriptome and load platelets with RNAs required for normal platelet function demonstrates that SRSF3-mediated RNA processing forms a central part of MK gene regulation and platelet biogenesis.
Methods
Experimental animals
Srsf3 KO mouse model was generated from Srsf3tm1a(KOMP)Mbp KO-first embryonic stem cells (UC Davis Mouse Biology Program). C57/Bl6 Pf4-Srsf3Δ/Δ mouse strain was established by crossing C57Bl/6xCBA Srsf3fl/fl,33 x C57/Bl6 Pf4-Cre42 and backcrossing to C57/Bl6. The experiments were approved by the Monash University Animal Ethics Committee and performed according to the Australian code for the care and use of animals for scientific purposes by the National Health and Medical Research Council. Male and female mice 6 to 10 weeks of age were used.
Isolation of mouse bone marrow MKs
Iliac crests, femurs and tibiae were collected, cleaned and flushed with 2% fetal bovine serum–phosphate-buffered saline. The flushed cells were filtered (100 µm) and spun 300 g for 5 minutes to harvest the total bone marrow cells. To analyze/isolate bone marrow MKs, lineage-depleted cells were labeled with 10 µM Hoechst 33342, washed, and labeled with AF700-conjugated rat anti-mouse CD41 (Biolegend), hamster anti-mouse CD61-PE (BD Biosciences) or goat anti-mouse Mpl-Biotin (R&D), and SAV-AF647 (Biolegend). The cells were sorted using Influx cell sorter or analyzed using LSRII cell analyzer (Becton Dickinson).
Platelet activation assays
Blood was obtained by cardiac puncture into 0.1vol of Aster-Jandl anticoagulant followed by centrifugation of the supernatant buffy coat. Platelets were washed and platelet counts determined by flow cytometry. Platelets were treated with single agonists adenosine 5′-diphosphate (12.5-50 µM), Convulxin (12.5-50 ng/mL), PAR4-AP (0.125-0.25 mM), or thrombin (0.0625-0.25 U/mL) in the presence of 1 mM CaCl2, and activation of the αIIbβ3 integrin (JON/A) or P-selectin (Emfret Analytics) exposure was assessed by flow cytometry. Diluted whole blood was recalcified, rested, treated with PAR4-AP, and platelet activation was analyzed as above.
Platelet surface receptor analysis
Whole blood collected in ethylenediaminetetraacetic acid was diluted and platelets stained with fluorescently conjugated CD41 (BD Biosciences), GPVI, GPIX, and GP1bα (Emfret Analytics) antibodies. Samples were diluted with phosphate-buffered saline and directly acquired by flow cytometry.
Transmission electron microscopy
Femurs were perfusion fixed with 2.5% glutaraldehyde/2% paraformaldehyde in Sorensen’s phosphate buffer and decalcified as above. The fixed femurs and isolated platelets were processed for TEM, sectioned, and imaged.
RNA-sequencing and bioinformatics
CD41+ 8N and ≥ 16N MKs were collected (23 ± 3k and 81 ± 5k, respectively) for RNA isolation (RNeasy Mini kit, Qiagen) followed by library preparation using SMARTer Stranded Total RNA Low Input Sample Prep kit (Clontech) and RNA-sequencing by Illumina HiSeq1500. The reads were aligned with STAR43 to Ensembl mm10. Differential gene expression analyzed with EdgeR.44,45
Platelet RNA was isolated using TriReagent (Sigma-Aldrich). Libraries were prepared using an Ion AmpliSeq Transcriptome Mouse Gene Expression Kit and sequenced on Ion Proton Sequencer (Thermo Fisher).46 The data were analyzed using Torrent Suite Software v5.6 (Thermo Fisher) and differential gene expression analyzed using DESeq2.47 Gene ontology enrichment analysis were conducted with DAVID.48
RNA immunoprecipitation in MEG-01 cells
MEG-01 megakaryoblasts were transduced with pCCL-SRSF3-GFP or pCCL-GFP vector and GFP+cells were lysed. The lysate was incubated with GFP-Trap magnetic beads (Chromotek). The beads were washed, RNA isolated using TriReagent (Sigma-Aldrich), and RNA was DNaseI treated (Promega) and reverse transcribed with SuperScript III (Thermo Fisher). Quantitative polymerase chain reaction (qPCR) was performed in QuantStudio6 using Luminaris HiGreen qPCR Master Mix-low ROX (Thermo Fisher) and 0.3 µM primers (supplemental Table 1). The cycle threshold values were calculated and immunoprecipitation normalized to input.
Nucleo-cytoplasmic fractionation of MEG-01 SRSF3 KO cells
MEG-01 cells were transduced with a lentiviral clustered regularly interspaced short palindromic repeats (CRISPR)-associated protein 9 (Cas9)–mCherry reporter vector.49 Cas9-mCherry+ cells were transduced with a lentiviral vector carrying a single-guide RNA targeting SRSF3 or scrambled control (hSRSF3[gRNA#326] or Scramble[gRNA#1], Vector Builder). Forty-eight hours posttransduction, the cells were harvested and total, nuclear, and cytoplasmic fractions isolated.33 RNA from each fraction was used for reverse transcription (RT)-qPCR performed as above. 18S ribosomal RNA and U6 small nuclear RNA were used to determine the purity of the fractions (Applied Biosystems TaqMan MicroRNA Reverse Transcription Kit, [Thermo Fisher Scientific], SensiFAST Probe Hi-ROX Kit [Bioline] and U6 probe [Assay ID 001973, Thermo Fisher]). Caspase3/7 activity was measured from transduced cells with the Caspase Glo-3/7 assay (Promega).
Results
SRSF3 ablation in MKs results in severe thrombocytopenia without a change in MK numbers
Systemic depletion of Srsf3 is lethal at the morula stage,35 hampering the investigation of SRSF3 functions in adult cell types. Although heterozygous Srsf3 KO mice were born in expected numbers, ∼50% died before weaning (supplemental Figure 1A).35 The surviving Srsf3KO/+ mice were anatomically and morphologically normal and had close to normal levels of SRSF3 protein and mRNA in the examined tissues, demonstrating that the autoregulatory feedback control observed in cell lines also operated in mouse tissues to maintain SRSF3 levels (supplemental Figure 1B-C).32,50 However, Srsf3KO/+ mice presented reduced platelet counts without a decrease in bone marrow MK numbers (Figure 1A; supplemental Figure 1D-E). To specifically investigate SRSF3 in MKs and platelets, we generated a MK-specific Srsf3 KO mouse model (hereafter Pf4-Srsf3Δ/Δ or Δ/Δ) (Figure 1B).33,42 Immunohistochemistry of bone marrow sections indicated successful SRSF3 ablation in MKs (Figure 1B). The Pf4-Srsf3Δ/Δ mice were viable and fertile with the expected number of offspring (supplemental Figure 1A). The mice had >90% reduction in their peripheral blood platelet counts, whereas red blood cells originating from the same progenitors were not affected, and white blood cells were slightly increased (Figure 1C; supplemental Figure 1F). The total number and incidence of bone marrow MKs were unchanged in Pf4-Srsf3Δ/Δ mice (Figure 1D), whereas the total number and incidence of myeloid cells was increased, B cells decreased, and T cells unchanged (supplemental Figure 1G-H).

SRSF3 depletion in MKs leads to severe thrombocytopenia without a change in MK numbers. (A) Platelet counts of heterozygous mice (KO/+) with a systemic Srsf3 deletion compared with wild-type mice (+/+) (n = 6). (B) Top: Generation of a mouse model where Srsf3 is deleted in MKs (Pf4-Srsf3Δ/Δ). Bottom: Anti-SRSF3 immunohistochemistry in Pf4-Srsf3Δ/Δ and control bone marrow sections. (C) Platelet and red blood cell (RBC) counts of control and Pf4-Srsf3Δ/Δ mice. (D) The total number and incidence of bone marrow MKs in control and Pf4-Srsf3Δ/Δ mice. (E) The number of MKs of individual ploidy in control and Pf4-Srsf3Δ/Δ bone marrow. (F) CD41, (G) CD61, and (H) c-MPL cell surface receptor expression of control and Pf4-Srsf3Δ/Δ MKs. A histogram of a representative mouse is shown (n = 4). The proportion of events in the gate marked in the histogram (CD41/CD61/c-MPLhigh) is quantified on the right. The data are presented as mean plus or minus standard error of the mean (SEM). Two-tailed unpaired Student t test in panels A and C through D; 2-way analysis of variance (ANOVA) in panels E through H. ****P ≤ .0001; ***P ≤ .001; **P ≤ .01; *P ≤ .05. Δ/Δ, Pf4-Srsf3Δ/Δ mice; Ctrl, control.
SRSF3 depletion in MKs leads to severe thrombocytopenia without a change in MK numbers. (A) Platelet counts of heterozygous mice (KO/+) with a systemic Srsf3 deletion compared with wild-type mice (+/+) (n = 6). (B) Top: Generation of a mouse model where Srsf3 is deleted in MKs (Pf4-Srsf3Δ/Δ). Bottom: Anti-SRSF3 immunohistochemistry in Pf4-Srsf3Δ/Δ and control bone marrow sections. (C) Platelet and red blood cell (RBC) counts of control and Pf4-Srsf3Δ/Δ mice. (D) The total number and incidence of bone marrow MKs in control and Pf4-Srsf3Δ/Δ mice. (E) The number of MKs of individual ploidy in control and Pf4-Srsf3Δ/Δ bone marrow. (F) CD41, (G) CD61, and (H) c-MPL cell surface receptor expression of control and Pf4-Srsf3Δ/Δ MKs. A histogram of a representative mouse is shown (n = 4). The proportion of events in the gate marked in the histogram (CD41/CD61/c-MPLhigh) is quantified on the right. The data are presented as mean plus or minus standard error of the mean (SEM). Two-tailed unpaired Student t test in panels A and C through D; 2-way analysis of variance (ANOVA) in panels E through H. ****P ≤ .0001; ***P ≤ .001; **P ≤ .01; *P ≤ .05. Δ/Δ, Pf4-Srsf3Δ/Δ mice; Ctrl, control.
MKs are marked by the expression of cell surface glycoproteins including CD41 (integrin αIIb), CD61 (integrin β3), and c-MPL, and MK ploidy correlates with their maturation stage.2,51-54 Flow cytometric analysis of Pf4-Srsf3Δ/Δ MKs showed no reduction in MKs within individual ploidies (Figure 1E; supplemental Figure 1I), suggesting that endomitosis was not affected. Srsf3-null MKs expressed CD41, CD61, and c-MPL at a lower level than the control MKs across ploidies as demonstrated by the significant reduction in the high intensity population (CD41/CD61/c-MPLhigh) of the bimodal distributions across ploidies (Figure 1F-H). Immunohistochemistry of bone marrow sections supported these findings (supplemental Figure 1J).
SRSF3 depletion leads to MK maturation arrest and macrothrombocytopenia
We next assessed MK maturation in Pf4-Srsf3Δ/Δ bone marrow using transmission electron microscopy (TEM). MKs can be divided into 3 distinct maturation stages based on morphological features such as the presence of α-granules, dense granules, and demarcation membrane system.55 Analysis of control and Pf4-Srsf3Δ/Δ bone marrow sections demonstrated a MK maturation arrest following Srsf3 ablation (Figure 2A-B; supplemental Figure 2A-C). The stage III MKs characterized by a multilobulated nucleus, well-developed demarcation membrane system, and abundant platelet granules were missing (Figure 2A-B; supplemental Figure 2C), whereas the number of stage I megakaryoblasts (1-50 µm in diameter, a kidney-shaped nucleus, and high nuclear-to-cytoplasm ratio) was unchanged (Figure 2A-B; supplemental Figure 2B), and the stage II MKs (20-80 µm in diameter with an irregularly shaped nucleus) were increased in numbers (Figure 2A-B; supplemental Figure 2A). The TEM analysis also revealed substantial emperipolesis (engulfment of intact cells) in Srsf3-null MKs, particularly at stage II and III (Figure 2C-D).
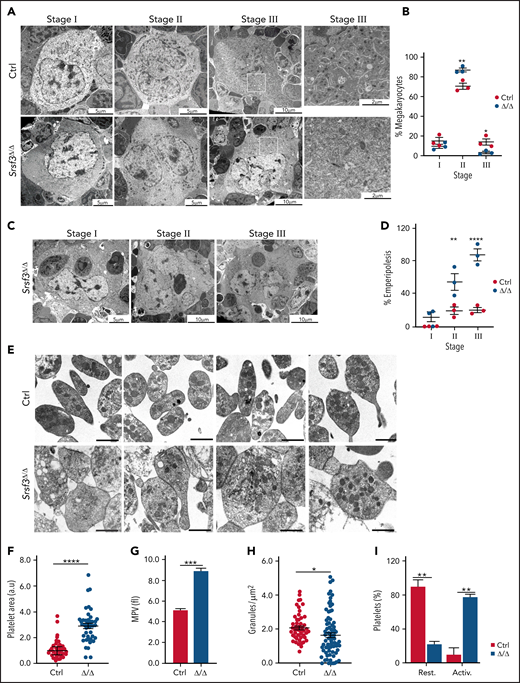
SRSF3 depletion leads to MK maturation arrest and macrothrombocytopenia. (A) Representative TEM images depicting the ultrastructure of control and Pf4-Srsf3Δ/Δ MKs at stage I, II, and III of maturation. Scale bars represent 5, 10, and 10 µm, respectively. On the right, a higher magnification of the boxed areas in stage III MKs. Scale bars represent µm. (B) Quantification of control and Pf4-Srsf3Δ/Δ MKs at each stage of maturation. (C) Representative TEM images of Pf4-Srsf3Δ/Δ MKs at stage I, II, and III of maturation displaying emperipolesis. Scale bars represent 5, 10, and 10 µm, respectively. (D) Quantification of the fraction of Pf4-Srsf3Δ/Δ MKs at each maturation stage displaying emperipolesis. (E) Representative TEM images of control and Pf4-Srsf3Δ/Δ platelets. Scale bars are 1 μm. (F) Quantification of control and Pf4-Srsf3Δ/Δ platelet area. (G) Mean platelet volume of control and Pf4-Srsf3Δ/Δ platelets. (H) Quantification of the number of granules in control and Pf4-Srsf3Δ/Δ platelets. (I) Quantification of the fraction of resting and activated control and Pf4-Srsf3Δ/Δ platelets. Platelets with filopodia, rounded shape, and/or centralised granules were classified as activated. The data are presented as mean plus or minus SEM. Two-way ANOVA in panels B and D and 2-tailed unpaired Student t test in panels F through I. ****P ≤ .0001; ***P ≤ .001; **P ≤ .01; *P ≤ .05. Activ, activated; rest, resting.
SRSF3 depletion leads to MK maturation arrest and macrothrombocytopenia. (A) Representative TEM images depicting the ultrastructure of control and Pf4-Srsf3Δ/Δ MKs at stage I, II, and III of maturation. Scale bars represent 5, 10, and 10 µm, respectively. On the right, a higher magnification of the boxed areas in stage III MKs. Scale bars represent µm. (B) Quantification of control and Pf4-Srsf3Δ/Δ MKs at each stage of maturation. (C) Representative TEM images of Pf4-Srsf3Δ/Δ MKs at stage I, II, and III of maturation displaying emperipolesis. Scale bars represent 5, 10, and 10 µm, respectively. (D) Quantification of the fraction of Pf4-Srsf3Δ/Δ MKs at each maturation stage displaying emperipolesis. (E) Representative TEM images of control and Pf4-Srsf3Δ/Δ platelets. Scale bars are 1 μm. (F) Quantification of control and Pf4-Srsf3Δ/Δ platelet area. (G) Mean platelet volume of control and Pf4-Srsf3Δ/Δ platelets. (H) Quantification of the number of granules in control and Pf4-Srsf3Δ/Δ platelets. (I) Quantification of the fraction of resting and activated control and Pf4-Srsf3Δ/Δ platelets. Platelets with filopodia, rounded shape, and/or centralised granules were classified as activated. The data are presented as mean plus or minus SEM. Two-way ANOVA in panels B and D and 2-tailed unpaired Student t test in panels F through I. ****P ≤ .0001; ***P ≤ .001; **P ≤ .01; *P ≤ .05. Activ, activated; rest, resting.
Ultrastructural analysis of platelets demonstrated that the remaining 5% to 10% of platelets in Pf4-Srsf3Δ/Δ mice were approximately twofold larger in size than controls (Figure 2E-F; supplemental Figure 2D), supported by increased mean platelet volume and flow cytometric analysis (Figure 2G; supplemental Figure 2E). Mature platelets contain abundant secretory granules including dense granules, α-granules, and lysosomes that arise from the MK trans-Golgi network.56 Quantification of granules per platelet surface area showed a significant reduction in the granule density following SRSF3 depletion (Figure 2H). The Srsf3-null platelets also contained dilated vacuoles that previous studies have proposed to represent empty α-granules (Figure 2E).57 Morphological features such as shape and granule localization can be indicative of platelet activation status. Resting platelets are typically discoid in shape, whereas activated platelets are rounded with centralized granules and filopodia. Based on these morphological criteria, the majority of Srsf3-null platelets appeared activated compared with the controls that appeared largely resting (Figure 2I), in agreement with the reduced granularity of Srsf3-null platelets (Figure 2H). Taken together, the ultrastructural analysis of MKs and platelets revealed that following a maturation arrest, SRSF3-deficient MKs released abnormally large platelets presenting morphological features typical for activated platelets.
Srsf3-null platelets are primed for activation
Unlike MKs, CD41 cell surface expression was not altered in Srsf3-null platelets, suggesting that the remaining CD41 receptor pool in the MKs, albeit reduced, may be sufficient for the small number of Srsf3-null platelets produced. GPIbα (CD42b) and GPIX (CD42a) levels were increased, potentially due to the larger size (Figure 3A). In contrast, GPVI (GP6) expression was reduced in Srsf3-null platelets (Figure 3A; supplemental Figure 3A-B). To assess the functionality of the Srsf3-null platelets, we purified control and Pf4-Srsf3Δ/Δ platelets, stimulated them in vitro with platelet agonists, and measured platelet degranulation by cell surface P-selectin and integrin receptor conformational change by JON/A-detecting activated Integrin-αIIb-β3 receptor. Control platelets displayed a dose-dependent response to agonist stimulation, whereas the Srsf3-null platelets were close to maximally preactivated in vitro without agonist stimulation (Figure 3B-C; supplemental Figure 3C). To exclude that platelet purification affected the degranulation process, we assessed platelet activation status in diluted whole blood. Untreated Pf4-Srsf3Δ/Δ platelets were preactivated in whole blood when measured by P-selectin but not JON/A (Figure 3D-E; supplemental Figure 3D), suggesting that integrin receptor conformational change (JON/A) was less affected in vivo compared with P-selectin surface exposure involving degranulation. The magnitude of Srsf3-null platelet response to agonist stimulation in whole blood was significantly reduced compared with control platelets when measured by both P-selectin and JON/A (Figure 3D-E; supplemental Figure 3D); thus, platelet function was compromised, although some activation potential was retained.

Srsf3-null platelets are preactivated. (A) The mean fluorescence intensity (MFI) of CD41, GPIX, GPIbα, and GPVI cell surface receptors in control and Pf4-Srsf3Δ/Δ platelets assessed in diluted whole blood. (B-C) The expression of activated Integrin-αIIb-β3 receptor (JON/A) and P-selectin on the surface of washed control and Pf4-Srsf3Δ/Δ platelets following agonist stimulation. (D-E) The expression of activated Integrin-αIIb-β3 receptor (JON/A) and P-selectin on the surface of control and Pf4-Srsf3Δ/Δ platelets from diluted whole blood. The data are presented as mean plus or minus SEM. Two-tailed unpaired Student t test. ***P ≤ .001; **P ≤ .01; *P ≤ .05.
Srsf3-null platelets are preactivated. (A) The mean fluorescence intensity (MFI) of CD41, GPIX, GPIbα, and GPVI cell surface receptors in control and Pf4-Srsf3Δ/Δ platelets assessed in diluted whole blood. (B-C) The expression of activated Integrin-αIIb-β3 receptor (JON/A) and P-selectin on the surface of washed control and Pf4-Srsf3Δ/Δ platelets following agonist stimulation. (D-E) The expression of activated Integrin-αIIb-β3 receptor (JON/A) and P-selectin on the surface of control and Pf4-Srsf3Δ/Δ platelets from diluted whole blood. The data are presented as mean plus or minus SEM. Two-tailed unpaired Student t test. ***P ≤ .001; **P ≤ .01; *P ≤ .05.
SRSF3 deficient platelets are rapidly cleared from circulation
Reduced platelet counts and abnormally large platelets are a characteristic of human macrothrombocytopenias, where large platelets are released and rapidly consumed or destroyed in the spleen.58,59 We assessed platelet clearance rate by transfusing isolated fluorescently labeled Srsf3-null and wild-type platelets into wild-type mice. The half-lives of Srsf3-null–CellTrace™ Violet and wild-type–carboxyfluorescein succinimidyl ester platelets were 10.9 hours and 20.8 hours, respectively (Figure 4A), confirming that Pf4-Srsf3Δ/Δ platelets are functionally different to wild-type platelets. We also labeled circulating platelets in vivo by injecting anti-CD42c-Dylight-488 antibody into control and Pf4-Srsf3Δ/Δ mice and assessed platelet retention postinjection. The Srsf3-null platelets were cleared 9.3 times faster than control platelets in vivo (Figure 4B).
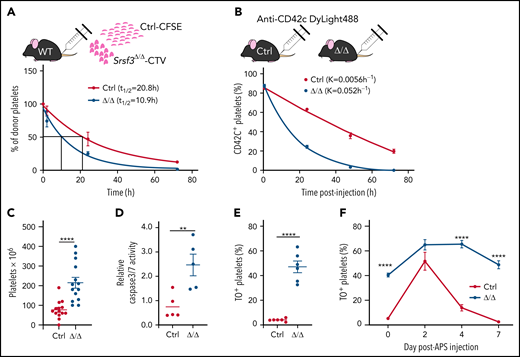
Srsf3-null platelets are rapidly cleared from circulation. (A) The half-life of control and Pf4-Srsf3Δ/Δ platelets as measured by the transplantation of CFSE- and CTV-labeled platelets, respectively, into wild-type mice. The data were fitted to a 1-phase exponential decay curve, and the half-life (t1/2) for control (R2 = 0.932) and Srsf3Δ/Δ (R2 = 0.937) platelets is depicted in the inset. (B) The clearance rate of control and Pf4-Srsf3Δ/Δ platelets as measured by in vivo labeling of platelets by anti-CD42c DyLight488 antibody in control and Pf4-Srsf3Δ/Δ mice. The data were fitted to a 1-phase exponential decay curve, and the rate constant K for control (R2 = 0.991) and Srsf3Δ/Δ (R2 = 0.996) platelets is depicted in the inset. (C) The number of platelets in the spleen of control and Pf4-Srsf3Δ/Δ mice. (D) Relative Caspase 3/7 activity in control and Pf4-Srsf3Δ/Δ platelets. (E) Fraction of reticulated TO+ platelets in control and Pf4-Srsf3Δ/Δ mice in the steady-state. (F) The fraction of TO+ platelets in control and Pf4-Srsf3Δ/Δ mice following antiplatelet serum (APS) administration. The data are presented as mean plus or minus SEM. Two-tailed unpaired Student t test in panels C through E; 2-way ANOVA in panel F. ****P ≤ .0001; **P ≤ .01. CFSE, carboxyfluorescein succinimidyl ester; CTV, CellTrace™ Violet.
Srsf3-null platelets are rapidly cleared from circulation. (A) The half-life of control and Pf4-Srsf3Δ/Δ platelets as measured by the transplantation of CFSE- and CTV-labeled platelets, respectively, into wild-type mice. The data were fitted to a 1-phase exponential decay curve, and the half-life (t1/2) for control (R2 = 0.932) and Srsf3Δ/Δ (R2 = 0.937) platelets is depicted in the inset. (B) The clearance rate of control and Pf4-Srsf3Δ/Δ platelets as measured by in vivo labeling of platelets by anti-CD42c DyLight488 antibody in control and Pf4-Srsf3Δ/Δ mice. The data were fitted to a 1-phase exponential decay curve, and the rate constant K for control (R2 = 0.991) and Srsf3Δ/Δ (R2 = 0.996) platelets is depicted in the inset. (C) The number of platelets in the spleen of control and Pf4-Srsf3Δ/Δ mice. (D) Relative Caspase 3/7 activity in control and Pf4-Srsf3Δ/Δ platelets. (E) Fraction of reticulated TO+ platelets in control and Pf4-Srsf3Δ/Δ mice in the steady-state. (F) The fraction of TO+ platelets in control and Pf4-Srsf3Δ/Δ mice following antiplatelet serum (APS) administration. The data are presented as mean plus or minus SEM. Two-tailed unpaired Student t test in panels C through E; 2-way ANOVA in panel F. ****P ≤ .0001; **P ≤ .01. CFSE, carboxyfluorescein succinimidyl ester; CTV, CellTrace™ Violet.
Pf4-Srsf3Δ/Δ mice displayed splenomegaly and increased spleen platelet content (Figure 4C; supplemental Figure 4A), suggesting that the large platelets may be targeted for destruction in the spleen. Accordingly, the analysis of Caspase 3/7 activity demonstrated a significant increase in apoptotic platelets in Pf4-Srsf3Δ/Δ mice (Figure 4D). This was supported by an increase in phosphatidylserine exposure measured by AnnexinV binding (supplemental Figure 4B). Phosphatidylserine exposure can also be indicative of procoagulation pathway activation, although we did not observe platelet ballooning by TEM. Thiazole orange (TO) labeling of newly generated reticulated platelets60 showed that the proportion of nascent platelets was increased in Pf4-Srsf3Δ/Δ mice in steady-state (<5% in control vs >40% in Pf4-Srsf3Δ/Δ), indicative of constant platelet production (Figure 4E). To further assess the dynamics of platelet production capacity and destruction, APS was used to transiently remove circulating platelets. Following APS administration, the number of control platelets plummeted within 24 hours and returned to baseline within 4 days, followed by a further increase above steady-state levels before reaching homeostasis (supplemental Figure 4C). Srsf3-null platelet counts rapidly decreased within 24 hours following APS administration and recovered back to steady-state levels by day 4 but never peaked above steady-state levels, unlike in controls (supplemental Figure 4D). The proportion of nascent TO+ platelets in Pf4-Srsf3Δ/Δ mice was pronounced following the APS challenge (Figure 4F). Taken together, the rapid clearance of platelets in Pf4-Srsf3Δ/Δ mice reflected both an increased platelet demand due to reduced platelet counts and a rapid destruction of the abnormal platelets. The flattened APS response demonstrated a limited platelet production following physiological challenge.
SRSF3 is critical for a transcriptome shift during MK maturation
Given SRSF3′s role in RNA biogenesis, we next investigated how SRSF3 depletion affects the MK RNA repertoire during maturation. Low- (8N) and high-ploidy (≥16N) control and Srsf3-null MKs were subjected to RNA-sequencing (supplemental Figure 5A-B). From 8N to higher ploidies, the control MKs underwent a significant transcriptome shift characterized by an upregulation of RNAs encoding MK- and platelet-specific functions (Figure 5A; supplemental Figure 5C; Table 1; supplemental Table 2). This shift was largely absent in Srsf3-null MKs (Table 1; Figure 5B-C), reflecting their maturation defect. SRSF3 depletion led to broader gene expression changes in the high-ploidy than the low-ploidy transcriptome (Table 1; Figure 5D; supplemental Figure 5D; supplemental Table 2), further emphasizing the failure of Srsf3-null MKs to switch on the mature MK gene expression program. The majority of the dysregulated genes were intron-containing and encoded more than 1 transcript isoform (supplemental Table 2). SRSF3 depletion affected functionally related genes encoding proteins of the cytoskeleton, surface glycoproteins and their receptors, and transcription factors essential for MK maturation (Figure 5E-F; supplemental Figure 5E-F). The human homologs of dysregulated genes such as Nbeal2 and Slfn14 are associated with human platelet diseases, and their loss-of-function mutations display phenotypic similarities with the loss of SRSF3 in MKs (Figure 5E-F; Table 2).61-63
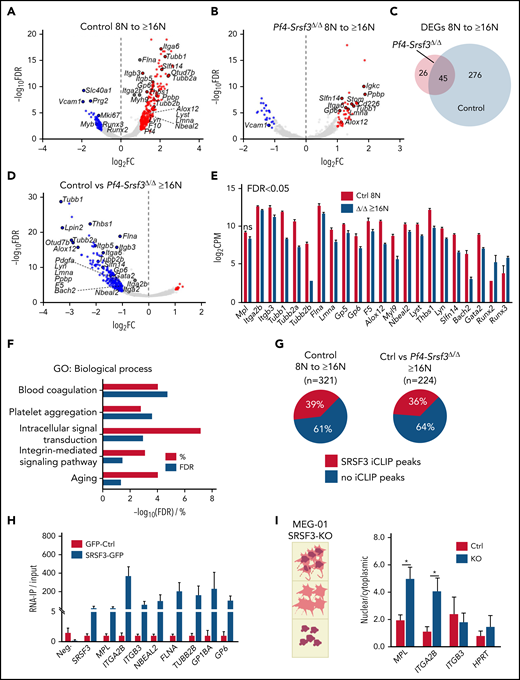
The RNA repertoire of Srsf3-null MKs reflects the failure in activating the maturation program. (A) Volcano plots depicting differentially expressed genes (DEGs) between control 8N and ≥16N MKs. The data points marked with blue and red denote significantly down- and upregulated genes (FDR <0.05 and FC >2), respectively. (B) Volcano plots depicting DEGs between Pf4-Srsf3Δ/Δ 8N and ≥16N MKs as in panel A. (C) Venn diagram comparing DEGs in control and Pf4-Srsf3Δ/Δ MKs upon 8N to ≥16N transition. (D) Volcano plot depicting DEGs between control and Pf4-Srsf3Δ/Δ ≥16N MKs as in panel A. (E) Expression of genes encoding proteins central for MK structure and function in control and Pf4-Srsf3Δ/Δ ≥6N MKs. FDR <0.05 unless otherwise noted. (F) Significantly enriched GO terms (Biological Process) among DEGs between control and Pf4-Srsf3Δ/Δ ≥16N MKs (FDR <0.05, FC >2). The x-axis depicts percent genes and -log10 (FDR) of each category. (G) Percentage of RNAs with SRSF3 RNA binding sites (iCLIP peaks) as identified in mouse pluripotent stem cells33 within RNAs induced during MK maturation (left) or differentially expressed between control and Pf4-Srsf3Δ/Δ ≥16N MKs (right). (H) RNA immunoprecipitation (IP) using anti-GFP antibody in MEG-01 megakaryoblast cell lines expressing SRSF3-GFP or only GFP. The y-axis denotes the enrichment of SRSF3 RNA binding over input as measured by RT-qPCR (n = 3). Neg. is a nontarget and SRSF3 a known-target control to demonstrate the specificity of the RNA-IP. (I) Quantification of RNAs in the nuclear and cytoplasmic fractions of MEG-01 cells following SRSF3 deletion by CRISPR/Cas9 gene editing. The data are presented as a ratio of nuclear and cytoplasmic mRNA abundance (n = 3). *P ≤ .05. Ctrl, MEG-01 cells targeted with scrambled control guide RNA; FC, fold change; FDR, false discovery rate; KO, MEG-01 cells targeted with SRSF3 guide RNA; ns, not significant.
The RNA repertoire of Srsf3-null MKs reflects the failure in activating the maturation program. (A) Volcano plots depicting differentially expressed genes (DEGs) between control 8N and ≥16N MKs. The data points marked with blue and red denote significantly down- and upregulated genes (FDR <0.05 and FC >2), respectively. (B) Volcano plots depicting DEGs between Pf4-Srsf3Δ/Δ 8N and ≥16N MKs as in panel A. (C) Venn diagram comparing DEGs in control and Pf4-Srsf3Δ/Δ MKs upon 8N to ≥16N transition. (D) Volcano plot depicting DEGs between control and Pf4-Srsf3Δ/Δ ≥16N MKs as in panel A. (E) Expression of genes encoding proteins central for MK structure and function in control and Pf4-Srsf3Δ/Δ ≥6N MKs. FDR <0.05 unless otherwise noted. (F) Significantly enriched GO terms (Biological Process) among DEGs between control and Pf4-Srsf3Δ/Δ ≥16N MKs (FDR <0.05, FC >2). The x-axis depicts percent genes and -log10 (FDR) of each category. (G) Percentage of RNAs with SRSF3 RNA binding sites (iCLIP peaks) as identified in mouse pluripotent stem cells33 within RNAs induced during MK maturation (left) or differentially expressed between control and Pf4-Srsf3Δ/Δ ≥16N MKs (right). (H) RNA immunoprecipitation (IP) using anti-GFP antibody in MEG-01 megakaryoblast cell lines expressing SRSF3-GFP or only GFP. The y-axis denotes the enrichment of SRSF3 RNA binding over input as measured by RT-qPCR (n = 3). Neg. is a nontarget and SRSF3 a known-target control to demonstrate the specificity of the RNA-IP. (I) Quantification of RNAs in the nuclear and cytoplasmic fractions of MEG-01 cells following SRSF3 deletion by CRISPR/Cas9 gene editing. The data are presented as a ratio of nuclear and cytoplasmic mRNA abundance (n = 3). *P ≤ .05. Ctrl, MEG-01 cells targeted with scrambled control guide RNA; FC, fold change; FDR, false discovery rate; KO, MEG-01 cells targeted with SRSF3 guide RNA; ns, not significant.
Summary of DEGs following SRSF3 depletion in MK and platelets. Abs(Log2FC) = 1 and FDR <0.05
| Total | Upregulated | Downregulated | |
|---|---|---|---|
| Ctrl: 8N vs ≥16N | 321 | 258 | 63 |
| Δ/Δ: 8N vs ≥16N | 71 | 46 | 25 |
| 8N: Ctrl vs Δ/Δ | 42 | 11 | 31 |
| ≥16N: Ctrl vs Δ/Δ | 224 | 11 | 213 |
| Platelets: Ctrl vs Δ/Δ | 5827 | 3120 | 2707 |
| Total | Upregulated | Downregulated | |
|---|---|---|---|
| Ctrl: 8N vs ≥16N | 321 | 258 | 63 |
| Δ/Δ: 8N vs ≥16N | 71 | 46 | 25 |
| 8N: Ctrl vs Δ/Δ | 42 | 11 | 31 |
| ≥16N: Ctrl vs Δ/Δ | 224 | 11 | 213 |
| Platelets: Ctrl vs Δ/Δ | 5827 | 3120 | 2707 |
DEGs in ≥16N Srsf3-null MKs associated with human platelet disorders and key MK functions
| DEG | logFC | FDR | Protein function | Human disease manifestation |
|---|---|---|---|---|
| Tubb1 | −3.32 | 1.6 × 10⁻²⁷ | Part of microtubules driving proplatelet elongation | (Macro)thrombocytopenia |
| Tubb2a | −2.93 | 1.3×10⁻¹⁶ | ||
| Tubb2b | −1.91 | 1.5×10⁻¹⁰ | ||
| Lyn | −1.20 | 2.1×10⁻³ | Lyn−/− mice thrombocytopenic | Thrombocytopenia |
| Lyst | −1.39 | 2.0×10⁻⁴ | Platelet secretion | Chediak-Higashi syndrome |
| Alox12 | −2.67 | 1.4×10⁻¹⁴ | Arachidonate 12-lipoxygenase predominantly found in platelets | Potentially thrombocytopenia |
| P2ry12 | −1.72 | 3.3×10⁻⁵ | Platelet aggregation | Impaired platelet aggregation |
| Slfn14 | −1.73 | 6.5×10⁻⁹ | Unknown | Thrombocytopenia and platelet release defects; enlarged platelets |
| Nbeal2 | −0.90 | 5.0×10⁻² | α-granule formation and secretion | Gray platelet syndrome (GPS) |
| Rasgrp2 | −1.03 | 1.0×10⁻² | Platelet inside out signaling | Reduced ability to perform integrin inside-out signaling |
| Itga2b | −0.52 | 3.3×10⁻⁵ | Essential receptors for MK and PLT integrin signaling | ITGA2B/ITGB3-related thrombocytopenia |
| Itgb3 | −1.21 | 1.4×10⁻¹⁴ | ||
| Itgb5 | −2.02 | 5.2×10⁻¹⁵ | ||
| Gp6 | −1.33 | 9.7×10⁻⁷ | Collagen receptor | Impaired platelet aggregation |
| F5 | −1.29 | 8.1×10⁻⁵ | Clotting factor | Factor V Leiden blood clotting disorder |
| Vwf | −0.97 | 9.15×10⁻¹³ | Platelet aggregation | Platelet-type or type 2B von Willebrand disease |
| Myh9 | −0.71 | 5.0×10⁻⁵ | Cell motility and structure | eg, MYH9-RD inherited thrombocytopenia |
| Flna | −1.09 | 1.1×10⁻¹⁷ | Integrin-receptor anchoring protein | FLNA-related thrombocytopenia |
In vivo MKs are not amenable to UV crosslinking and immunoprecipitation (CLIP) due to their low numbers and unavailability of immunopurification-grade SRSF3 antibodies.33 To identify direct SRSF3 RNA targets in MKs, we compared the RNA-sequencing data with our previous CLIP data from mouse pluripotent stem cells.33 Although MKs express many lineage specific genes, one-third of RNAs differently expressed during MK maturation and following SRSF3 depletion were identified as direct SRSF3 RNA targets in mouse pluripotent cells (Figure 5G), suggesting that alterations in MK RNA repertoire were directly mediated by SRSF3. To study MK-specific RNAs, we established a human MEG-01 megakaryoblast cell line expressing a GFP-tagged SRSF3 or GFP as a control (supplemental Figure 5G).28,33 RNA immunoprecipitation followed by RT-qPCR analysis demonstrated that SRSF3 directly bound to RNAs encoding hallmark proteins in MKs and platelets such as MPL, ITGA2B (encoding CD41), and ITGB3 (CD61) (Figure 5H). SRSF3 is a known mRNA export adaptor facilitating the nucleo-cytoplasmic export of selected mRNAs.28,64,65 CD41, CD61, and c-MPL protein levels on the cell surface were greatly reduced (Figure 1F-H), but their corresponding mRNA levels were affected to much lesser extent in Srsf3-null MKs (Figure 5E), suggestive of an mRNA export defect. We analyzed the subcellular distribution of MPL, ITGA2B, and ITGB3 mRNAs in MEG-01 cells where SRSF3 was deleted by CRISPR/Cas9-mediated gene editing (supplemental Figure 5H). SRSF3-depleted MEG-01 cells were separated into total, nuclear, and cytoplasmic fractions, and mRNA levels were assessed in the fractions (Figure 5I; supplemental Figure 5I). Similar to bone marrow MKs, the total MPL, ITGA2B, and ITGB3 mRNA levels were minimally affected, and there was no change in cell numbers or increase in apoptosis following SRSF3 depletion in MEG-01 cells (supplemental Figure 5J-L). However, MPL and ITGA2B mRNAs significantly accumulated in the nucleus in SRSF3-depleted MEG-01 cells with a corresponding decrease in the cytoplasm (Figure 5I; supplemental Figure 5M). This mechanistically may explain why a small change in Mpl and Itga2b total mRNA levels could lead to a large reduction in their respective protein levels. Taken together, these data demonstrate that SRSF3 regulates functionally related sets of MK RNAs through RNA regulatory mechanisms it deploys in other cell types, suggesting a conserved and critical role for SRSF3 in RNA regulation during MK maturation.
The RNA repertoire of Srsf3-null platelets is drastically altered
Although platelets are anucleate, they contain a broad repertoire of RNAs.23 Platelet RNAs are largely deposited by MKs that also transfer cellular machineries such as ribosomes and RNA degradation machinery into platelets.20,22,25,66-68 The platelet RNA repertoire reflects platelet-specific functions with recent evidence of selective loading of distinct MK RNAs into platelets.24,69 In accordance with the larger fraction of TO+ platelets in Pf4-Srsf3Δ/Δ mice, we detected ∼20 times more RNA per Srsf3-null platelet compared with control but no difference in the respective MK RNA content (Figure 6A). RNA-sequencing of purified control and Srsf3-null platelets demonstrated that SRSF3 depletion in MKs led to a drastically altered platelet RNA profile (Table 1; Figure 6B; supplemental Figure 6A; supplemental Table 2). Functionally important RNAs such as those encoding tubulins, integrin receptors, and their ligands and signaling molecules were either downregulated or absent in the Srsf3-null platelets (Figure 6B; supplemental Figure 6B; supplemental Table 2). Instead, a large pool of RNAs not detected in control platelets was present in Srsf3-null platelets. We detected 17/40 of the previously listed nonubiquitous top mouse platelet RNAs within the 40 most highly expressed RNAs in the control platelets, whereas only 8/40 in the Srsf3-null platelets (supplemental Table 3).22 The control platelet RNA repertoire, but not the Srsf3-null platelet RNA pool, was enriched with RNAs induced during MK maturation (Figure 6C). If platelet RNA content directly reflected MK RNA content, PLT/MK enrichment distribution would be centered at 0. However, similar to previous findings, the platelet/MK RNA abundance ratio was left-skewed in the control, indicating an enrichment of distinct MK RNAs in platelets (Figure 6D; median −1.056 and mean −1.157; supplemental Figure 6C-D).25 In Pf4-Srsf3Δ/Δ, the platelet/MK RNA ratio distribution was narrow, bimodal, and further left-shifted (Figure 6E; median −1.900 and mean −1.556; supplemental Figure 6D). The abnormal platelet RNA content was also evident at the level of specific RNAs (Figure 6F; supplemental Figure 6E). Because SRSF3 protein levels in platelets were low (supplemental Figure 6F), the discordance of Pf4-Srsf3Δ/Δ MK and platelet RNAs likely reflected a failure to restrict or facilitate the deposition of distinct MK RNAs into platelets during MK maturation and platelet release (Figure 6G), the abnormal RNA content contributing to the functional defects observed in Pf4-Srsf3Δ/Δ platelets.
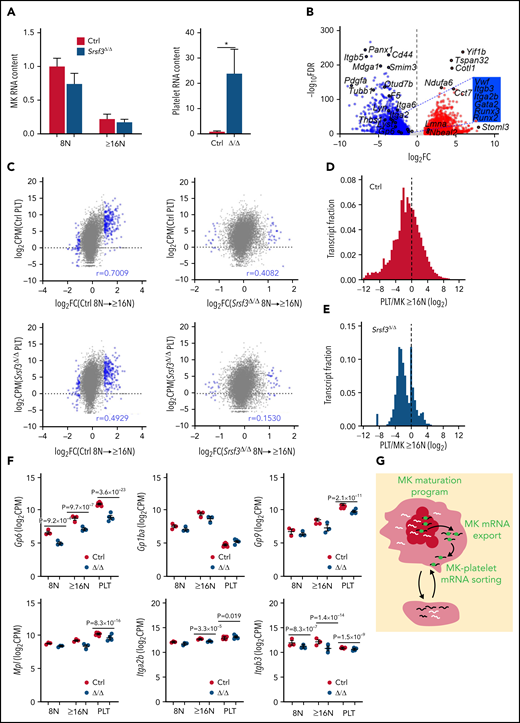
SRSF3 depletion in MKs results in aberrant loading of RNA into platelets. (A) Relative RNA content of control and Pf4-Srsf3Δ/Δ MKs and platelets (n = 3-6). (B) Volcano plot depicting differential RNA repertoire between control and Pf4-Srsf3Δ/Δ platelets. The data points marked with blue were significantly less abundant in Pf4-Srsf3Δ/Δ platelets, and the points marked in red were more abundant when compared with control (FDR <0.05, FC >2). (C) Pearson correlation between DEGs during MK maturation (FDR <0.05, FC = 2) and platelet RNA levels. (D-E) Frequency distribution histograms of platelet/MK RNA abundance ratio (platelet CPM/MK ≥16N CPM) in control and Pf4-Srsf3Δ/Δ. The dotted line marks 0. (F) Levels of RNAs encoding proteins central for platelet function in control and Pf4-Srsf3Δ/Δ 8N and ≥16N MKs and platelets. (G) A schematic depicting how SRSF3 governs a MK maturation program through RNA regulatory mechanisms such as mRNA export and guides the deposition of RNA into platelets. In the schematic, the black lines represent SRSF3 target RNAs in MKs, white lines, other MK RNAs and green balls are SRSF3. The data in panels A and F is presented as mean plus or minus SEM. Two-tailed unpaired Student t test; *P ≤ .05. CPM; counts per million; PLT, platelet.
SRSF3 depletion in MKs results in aberrant loading of RNA into platelets. (A) Relative RNA content of control and Pf4-Srsf3Δ/Δ MKs and platelets (n = 3-6). (B) Volcano plot depicting differential RNA repertoire between control and Pf4-Srsf3Δ/Δ platelets. The data points marked with blue were significantly less abundant in Pf4-Srsf3Δ/Δ platelets, and the points marked in red were more abundant when compared with control (FDR <0.05, FC >2). (C) Pearson correlation between DEGs during MK maturation (FDR <0.05, FC = 2) and platelet RNA levels. (D-E) Frequency distribution histograms of platelet/MK RNA abundance ratio (platelet CPM/MK ≥16N CPM) in control and Pf4-Srsf3Δ/Δ. The dotted line marks 0. (F) Levels of RNAs encoding proteins central for platelet function in control and Pf4-Srsf3Δ/Δ 8N and ≥16N MKs and platelets. (G) A schematic depicting how SRSF3 governs a MK maturation program through RNA regulatory mechanisms such as mRNA export and guides the deposition of RNA into platelets. In the schematic, the black lines represent SRSF3 target RNAs in MKs, white lines, other MK RNAs and green balls are SRSF3. The data in panels A and F is presented as mean plus or minus SEM. Two-tailed unpaired Student t test; *P ≤ .05. CPM; counts per million; PLT, platelet.
Discussion
Here, we identify the RNA binding protein SRSF3 as a previously unknown regulator of MK maturation and platelet biogenesis. Firstly, we demonstrate that SRSF3 deletion in MKs leads to severely reduced platelet counts without affecting MK numbers. In the absence of SRSF3, MKs fail to reprogram their transcriptome and develop to MKs capable of efficient platelet production. SRSF3 controls MK maturation through RNA regulatory mechanisms that it deploys in other cell types including the regulation of the nucleo-cytoplasmic mRNA export. Secondly, the Srsf3-null platelets display multiple deficits including abnormally large size, reduced granule content, and activation in the absence of agonists. The RNA repertoire of Srsf3-null platelets is drastically altered, suggesting SRSF3 plays a role in sorting of MK RNAs for deposition into platelets. RNAs encoding proteins with roles in platelet activation were missing in Srsf3-null platelets, indicating a functional link between selective RNA loading and platelet function.
The identification of splicing factor mutations as a major cause of myelodysplastic syndrome first proposed that blood lineages may be particularly vulnerable to RNA processing defects.12-18 RNA expression profiles play a key role in understanding megakaryopoiesis and platelet function.70,71 To better understand how thrombopoiesis is controlled, it is important to form a comprehensive picture of RNA signatures associated with MK maturation steps and the relationship between MK and platelet RNA. Published RNA-sequencing studies are largely limited to in vitro cultured murine fetal liver MKs, in vitro differentiated human MKs, and cell line models.15,70 Our native low- and high-ploidy bone marrow MK and matching platelet RNA-sequencing data sets revealing a large transcriptome shift from 8N to higher ploidies (Figure 5A) and deposition of distinct RNAs into platelets (Figure 6D-E) are unique in shedding light into the RNA dynamics during thrombopoiesis.
Posttranscriptional processes involved in MK gene regulation are poorly understood, although critical.70,72,73 We show that SRSF3 is not essential for MK cell survival or endomitosis but controls a specific gene expression program vital for MK maturation and platelet release. Although in the control, MK RNAs encoding proteins with key MK and platelet functions were induced from 8N to ≥16N, in Srsf3-null MKs there was little difference between the 8N and ≥16N transcriptomes (Figure 5B-C). Comparisons of the dysregulated RNAs to our CLIP data in mouse pluripotent cells as well as experimental validation using an in vitro cell line model demonstrated that many functionally relevant MK RNAs were bound by SRSF3, thus placing SRSF3 as a direct regulator of MK RNA profile during maturation. Mechanistically, SRSF3 governed MK RNAs through processes it regulates in other cells types, such as nucleo-cytoplasmic mRNA export. As a nucleo-cytoplasmic mRNA export adaptor, SRSF3 depletion can cause a nuclear accumulation of its target RNAs.28,64,65 In line with this, SRSF3 depletion compromised the export of key MK mRNAs encoding the cell surface receptors c-MPL and CD41. The nuclear accumulation of Mpl and Itga2b in SRSF3-depleted cells may explain the reduced level of c-MPL and CD41 in Pf4-Srsf3Δ/Δ MKs.
Because platelets are cytoplasmic fragments of MKs lacking genomic DNA, their RNA is produced by the parent cells. Recent studies have proposed an active sorting of functionally significant RNAs into platelets,24,69-71 but no regulators of the sorting process are known. The abnormal RNA repertoire in platelets produced by Srsf3-null MKs suggests that SRSF3 could restrict and/or facilitate the deposition of distinct MK RNAs into platelets (Figure 6G) and thus serve as an mRNA adaptor also in the cytoplasm. Although the platelet RNA content reflected the MK RNA levels (supplemental Figure 6C), it was not a direct cross-section of MK RNAs as evidenced by the left-shift in platelet/MK RNA ratio distribution similar to previous observations (Figure 6C-D).25 In Pf4-Srsf3Δ/Δ mice, the platelet/MK RNA ratio distribution was bimodal with a left-shift, further suggesting a failure in sorting distinct MK RNAs into platelets (Figure 6E). SRSF3 depletion in MKs led to a decrease in MK RNAs such as Gp6 that aligned with a reduced level of Gp6 mRNA in platelets (Figure 6F). The GPVI protein on platelet surface was also reduced, and purified Pf4-Srsf3Δ/Δ platelets displayed reduced response to GPVI agonist (convulxin) stimulation (Figure 3A-B). Although the cytoplasmic Mpl and Itga2b mRNA levels were reduced in Pf4-Srsf3Δ/Δ MKs (Figure 5I; supplemental Figure 5M), the Mpl and Itga2b mRNA abundance in platelets was only moderately affected (Figure 6F). SRSF3 depletion in MKs led to reduced Nbeal2 mRNA levels in MKs but increased levels in platelets, further exemplifying how not all MK RNAs are equal, and some MK RNAs are preferentially deposited into platelets. Because platelet RNAs are actively translated and degraded, and play a role in platelet responses to cellular cues,20,21,68,71 determining how platelets get their RNA contributes to understanding of basic hemostasis and advances the knowledge of platelet response during cellular stress, infection, and disease.
The phenotype of the Pf4-Srsf3Δ/Δ mice resembles human macrothrombocytopenias (Table 2).58 For example, we identified Nbeal2, causative of Gray platelet syndrome, as a direct SRSF3 RNA target.74Nbeal2 was among the RNAs that were not properly induced from 8N to ≥16N MK following SRSF3 depletion. The Pf4-Srsf3Δ/Δ mice shared some features with Nbeal2 loss-of-function models, including macrothrombocytopenia, reduction in platelet granule density, and increased emperipolesis associated with platelet pathologies and hematopoietic stress.74-76 Thus, the Pf4-Srsf3Δ/Δ mouse model may provide a tool to understand platelet disorders, in particular the role of posttranscriptional gene regulation in platelet diseases. Albeit the SRSF3 depletion was limited to MKs, Pf4-Srsf3Δ/Δ mice displayed changes in peripheral blood and bone marrow hematopoietic cell counts, suggesting that the MK maturation defect in Pf4-Srsf3Δ/Δ mice may affect hematopoiesis more broadly in line with the previously identified functional relationship between MKs and hematopoietic stem cells.77-79
In conclusion, our study demonstrates how the RNA binding protein SRSF3 governs a MK maturation program that further guides the deposition of RNA into platelets, thus providing key insights into the role of posttranscriptional gene regulation during thrombopoiesis.
Acknowledgments
The authors thank Tyra Fraser, Marie Lee, Jessica Hatwell-Humble, and Daniela Cardozo for technical assistance; Benjamin Kile for helpful discussions on platelet biology; Richard Allcock for technical advice for platelet RNA sequencing; the support from MHTP Medical Genomics Platform in next-generation sequencing; and staff from FlowCore, Monash Histology Platform, and Monash Animal Research Platform (Monash University, Australia).
This work was supported by the Victorian Government Operational Infrastructure Support Scheme and Monash University Strategic Grant (M.-L.Ä.); a CSIRO OCE Science Leader Fellowship (S.K.N).; Independent Research Institutes Infrastructure Support Scheme Grant (9000220) from the Australian National Health and Medical Research Council (E.C.J.); a fellowship from the Lorenzo and Pamela Galli Charitable Trust; a Victorian State Government Operational Infrastructure Support Grant (E.C.J.); and a Gunn Family National Career Development Fellowship for Women in Haematology from the Snowdome Foundation and Maddie Riewoldt’s Vision (B.B.G.). The Australian Regenerative Medicine Institute is supported by grants from the State Government of Victoria and the Australian Government. The funders had no part in the design, conduct, outcomes, decision to publish, or the drafting of this manuscript.
Authorship
Contribution: S.Y.H., S.K.N., and M.-L.Ä. designed the project; S.Y.H., T.A., B.B.G., P.G., E.C.J., S.L.E., M.R., H.C., B.C., C.K.H., B.W., J.F.W., M.F., M.R., S.K.N., and M.-L.Ä. performed the experiments; M.M., M.R., B.B.G., and M.-L.Ä., performed the bioinformatics analysis; S.Y.H., T.A., E.C.J., P.G., S.K.N., and M.-L.Ä. analyzed the data and made the figures; M.-L.Ä. wrote the manuscript; and all authors provided comments and approved the final manuscript.
Conflict-of-interest disclosure: The authors declare no competing financial interests.
Correspondence: Minna-Liisa Änkö, Hudson Institute of Medical Research, 27-31 Wright Street Clayton, VIC 3168, Australia; e-mail: minni.anko@hudson.org.au.
RNA-sequencing data are deposited in Gene Expression Omnibus at National Center for Biotechnology Information with accession number GSE155620. See also supplemental Methods.
Requests for data sharing may be submitted to Minna-Liisa Änkö (minni.anko@hudson.org.au)
The online version of this article contains a data supplement
The publication costs of this article were defrayed in part by page charge payment. Therefore, and solely to indicate this fact, this article is hereby marked "advertisement" in accordance with 18 USC section 1734.

This feature is available to Subscribers Only
Sign In or Create an Account Close Modal