Key Points
We performed WGS of 150 ATL patients to reveal the overarching landscape of genomic changes including noncoding regions.
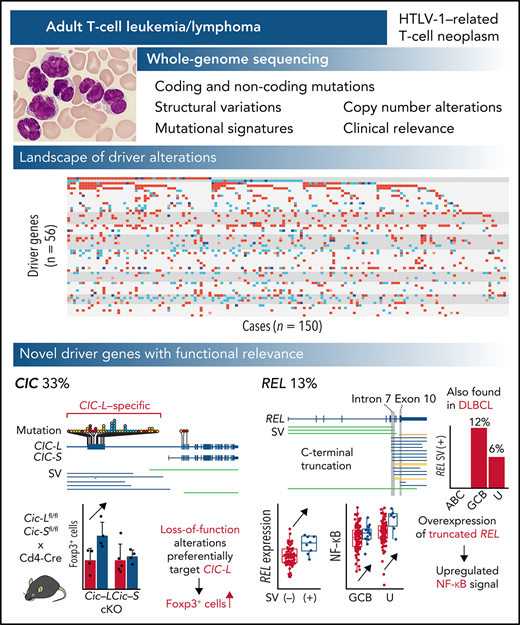
We discovered novel drivers of ATL such as loss-of-function alterations of CIC long isoform and C-terminal REL truncations.
Abstract
Adult T-cell leukemia/lymphoma (ATL) is an aggressive neoplasm immunophenotypically resembling regulatory T cells, associated with human T-cell leukemia virus type-1. Here, we performed whole-genome sequencing (WGS) of 150 ATL cases to reveal the overarching landscape of genetic alterations in ATL. We discovered frequent (33%) loss-of-function alterations preferentially targeting the CIC long isoform, which were overlooked by previous exome-centric studies of various cancer types. Long but not short isoform–specific inactivation of Cic selectively increased CD4+CD25+Foxp3+ T cells in vivo. We also found recurrent (13%) 3′-truncations of REL, which induce transcriptional upregulation and generate gain-of-function proteins. More importantly, REL truncations are also common in diffuse large B-cell lymphoma, especially in germinal center B-cell–like subtype (12%). In the non-coding genome, we identified recurrent mutations in regulatory elements, particularly splice sites, of several driver genes. In addition, we characterized the different mutational processes operative in clustered hypermutation sites within and outside immunoglobulin/T-cell receptor genes and identified the mutational enrichment at the binding sites of host and viral transcription factors, suggesting their activities in ATL. By combining the analyses for coding and noncoding mutations, structural variations, and copy number alterations, we discovered 56 recurrently altered driver genes, including 11 novel ones. Finally, ATL cases were classified into 2 molecular groups with distinct clinical and genetic characteristics based on the driver alteration profile. Our findings not only help to improve diagnostic and therapeutic strategies in ATL, but also provide insights into T-cell biology and have implications for genome-wide cancer driver discovery.
Introduction
In recent years, large-scale cancer consortia, including the Pan-Cancer Analysis of Whole Genomes (PCAWG) Consortium of the International Cancer Genome Consortium and The Cancer Genome Atlas, have provided unparalleled whole-genome sequencing (WGS) data of various cancer types, which have broadened the catalog of driver alterations underlying cancer development and progression and have highlighted the promise of genome-driven oncology care.1,2 However, such efforts have not been adequately devoted to rare cancers, which may hinder novel driver discovery and refinement of their treatment strategies.
Adult T-cell leukemia/lymphoma (ATL) is a rare but deadly form of peripheral T-cell neoplasm that immunophenotypically resembles regulatory T cells. ATL is associated with human T-cell leukemia virus type-1 (HTLV-1), which infects approximately 10 million people worldwide, particularly in endemic regions, such as southwestern Japan, the Caribbean Basin, South America, the Middle East, Australia, and Romania.3-5 Together with HTLV-1-derived products, such as Tax and HBZ, somatic alterations play critical roles in ATL pathogenesis, as revealed by several genetic studies mainly using targeted and whole-exome sequencing (WES) and low-depth WGS.6-10 However, a comprehensive overview of their genetic alterations, including structural variations (SVs) and noncoding mutations, remains elusive. To this end, we performed high-depth WGS analysis for 150 Japanese and North American ATL patients to delineate their driver landscape, including noncoding mutations, and identified several new driver alterations, especially loss-of-function mutations predominantly involving the long isoform of CIC. We also discovered recurrent SVs truncating the 3′ exons of REL, which were also frequently observed in germinal center B-cell–like (GCB) diffuse large B-cell lymphoma (DLBCL).
Methods
Patients and materials
A total of 150 patients with ATL were enrolled in this study, of which 11 had been analyzed by high-depth WGS (with HiSeq 2500) previously.7 Patients were subclassified into acute (n = 86), lymphoma (n = 18), chronic (n = 35), and smoldering (n = 11) subtypes based on the World Health Organization classification and the International Consensus Meeting proposal11,12 (supplemental Table 1). All patients had documented HTLV-1 infection examined by Southern blotting. Peripheral blood, lymph node, or other infiltrated tissue and matched control samples (buccal swab or saliva) were collected from patients with informed consent. For smoldering, chronic, and acute ATL cases with atypical lymphocytes <20% in peripheral blood, we performed targeted sequencing prior to WGS analysis to confirm clonal HTLV-1 integration as previously described.7,13 This study was approved by the institutional ethics committees of National Cancer Center and other participating institutes.
WGS library preparation and sequencing
Tumor and buccal DNA and saliva DNA were extracted using the QIAamp DNA Mini Kit (Qiagen) and the Oragene DISCOVER kit (DNA Genotek), respectively. Sequencing libraries were prepared using the TruSeq Nano DNA sample preparation kit (Illumina) and sequenced using HiSeq X Ten or NovaSeq6000 (Illumina), generating standard 150 bp paired-end data at Takara Bio or Macrogen Japan. Sequence analysis methods are described in detail in supplemental Methods (available on the Blood Web site).
Animal experiment
All mouse experiments were approved by the Animals Committee for Animal Experimentation of the National Cancer Center Japan and met the Guidelines for Proper Conduct of Animal Experiments established by the Science Council of Japan. Female C57BL/6 mice (6-10 weeks old) were obtained from CLEA Japan and maintained under pathogen-free conditions. Cd4-Cre (B6.Cg-Tg(Cd4-cre)1Cwi/BfluJ) mice were purchased from Jackson Laboratory. Conditional knockout (cKO) mice of both long isoform of Cic (Cic-L) (ENSMUST00000169266) and short isoform of Cic (Cic-S) (ENSMUST00000163320) were generated by TransGenic Inc. Methods for Cic cKO mice generation and mouse experiments are described in detail in supplemental Methods.
Results
Overview of the entire ATL genome
We performed WGS analysis of paired tumor-normal samples from 150 ATL cases, including 11 previously described,7 with a median depth of 95.5× and 33.7× in tumor and normal samples, respectively (supplemental Figure 1A; supplemental Table 1). Among them, 66 tumors were also analyzed by RNA sequencing (RNA-seq). WGS identified 2 110 948 mutations (4.5 [range 0.018-22] mutations per Mb on average), including 17 421 coding mutations (supplemental Figure 1B; supplemental Table 2). Only 86% of the coding mutations were located in regions covered by WES, of which 99% were validated (supplemental Figure 1C). Moreover, 10 145 SVs (range 5-336 per sample) and 3970 copy number (CN)-altered segments (range 0-165 per sample) were detected (supplemental Figure 1B,D; supplemental Table 3). Although intergenic regions carried the highest mutational burden, SVs were more common in transcribed regions, including coding sequences (CDSs) and untranslated regions (UTRs) (supplemental Figure 1E), reflecting distinct generation mechanisms between mutations and SVs. Single or multiple clonal HTLV-1 integrations were confirmed in all cases (supplemental Figure 1F; supplemental Table 4).
Frequent inactivation of CIC-ATXN1 complex
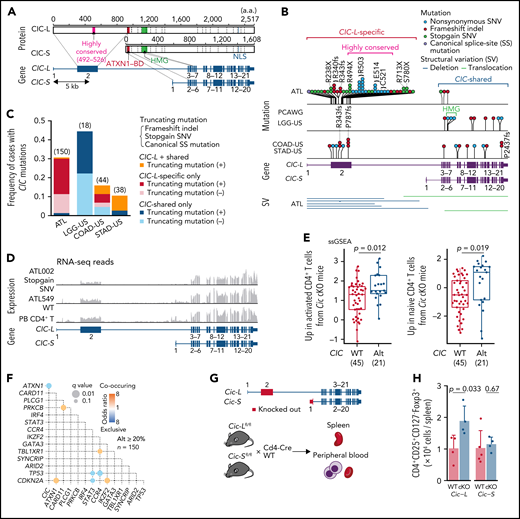
In total, 47 genes, including 10 novel ones, were found to be significantly mutated (q < 0.01) using MutSig2CV,14 DriverPower,15 and dNdScv16 algorithms (supplemental Table 5). Remarkably, frequent mutations (31% of cases) were observed in CIC, which has long and short isoforms (CIC-L and CIC-S, respectively) encoding a high mobility group box transcriptional repressor17 (Figure 1A). Almost all (95%) the mutations affected the CIC-L–specific exon (Figure 1B), which was recently discovered18 and not covered by WES capture baits used in previous studies.7-9,19,20 More than half of CIC mutations were loss-of-function mutations, whereas missense mutations formed prominent hotspots at Arg503 and Glu514, which were located in a highly conserved region from lower organisms to humans (Figure 1A-B; supplemental Figure 2A). Although CIC mutations have been described in lower-grade glioma (LGG) and several types of adenocarcinomas,19,20 their type and distribution in ATL were clearly contrasted to those in other cancers (Figure 1B-C). In LGG, mutations mainly resided in shared exons of both isoforms, whereas in gastrointestinal adenocarcinomas they were distributed throughout the gene, including CIC-L–specific exons, leading to substantially increased mutation frequency. Combined with SVs mainly involving CIC-L, 49 cases (33%) harbored CIC alterations, which were predominantly (78%) biallelic (supplemental Figure 2B). RNA-seq revealed that CIC-altered cases showed decreased CIC-L expression and upregulation of gene signatures that characterize murine Cic-deficient CD4+ T cells showing enhanced T-cell activation21 (Figure 1D-E; supplemental Figure 2C).
Long isoform–specific disruption of CIC. (A) Isoform-specific protein and gene structures of CIC. mRNA and protein reference sequences are shown in supplemental Table 23. (B) Type and position of SVs and mutations within CIC region detected by WGS for 150 ATL cases, together with CIC mutations in other cancer types in the PCAWG project. (C) Frequency of CIC mutations in ATL and other cancer types from the PCAWG project1 (with CIC mutation frequency ≥10%) according to mutation type (with or without truncating mutations) and location (CIC-L–specific vs –shared). Number of cases in each cohort is shown in parenthesis. Truncating mutations include stopgain single nucleotide variants (SNVs), frameshift indels, and canonical splice-site (SS) mutations. (D) RNA-seq read coverages of CIC region from CIC wild-type (WT) and -altered ATL cases and healthy CD4+ T cells. (E) Single-sample gene set enrichment analysis (ssGSEA) scores in CIC WT (n = 45) and -altered (n = 21) ATL cases, using gene signatures upregulated in activated (left) or naive (right) CD4+ T cells from Cic KO mice.21 Box plots show medians (lines), interquartile ranges (IQRs; boxes), and ± 1.5 × IQR (whiskers). Numbers of cases are shown in parentheses. Two-sided Brunner-Munzel test. (F) Pairwise associations among 15 driver alterations found in ≥20% of cases. Significant correlations (q < 0.1) colored according to their odds ratios are shown. Two-sided Fisher's exact test with Benjamini-Hochberg correction. (G) Schematic representation of Cic-L and Cic-S cKO mouse experiments. (H) Number of CD4+CD25+CD127-Foxp3+ cells per spleen from CD4+ T-cell–specific homozygous Cic-L and Cic-S cKO mice (n = 4-5). Data represent means + standard deviation. Two-sided Welch's t test. BD, binding domain; COAD-US, colon adenocarcinoma from the US; HMG, high mobility group box; LGG-US, brain lower grade glioma from the United States (US); NLS, nuclear localization signal; STAD-US, gastric adenocarcinoma from the US.
Long isoform–specific disruption of CIC. (A) Isoform-specific protein and gene structures of CIC. mRNA and protein reference sequences are shown in supplemental Table 23. (B) Type and position of SVs and mutations within CIC region detected by WGS for 150 ATL cases, together with CIC mutations in other cancer types in the PCAWG project. (C) Frequency of CIC mutations in ATL and other cancer types from the PCAWG project1 (with CIC mutation frequency ≥10%) according to mutation type (with or without truncating mutations) and location (CIC-L–specific vs –shared). Number of cases in each cohort is shown in parenthesis. Truncating mutations include stopgain single nucleotide variants (SNVs), frameshift indels, and canonical splice-site (SS) mutations. (D) RNA-seq read coverages of CIC region from CIC wild-type (WT) and -altered ATL cases and healthy CD4+ T cells. (E) Single-sample gene set enrichment analysis (ssGSEA) scores in CIC WT (n = 45) and -altered (n = 21) ATL cases, using gene signatures upregulated in activated (left) or naive (right) CD4+ T cells from Cic KO mice.21 Box plots show medians (lines), interquartile ranges (IQRs; boxes), and ± 1.5 × IQR (whiskers). Numbers of cases are shown in parentheses. Two-sided Brunner-Munzel test. (F) Pairwise associations among 15 driver alterations found in ≥20% of cases. Significant correlations (q < 0.1) colored according to their odds ratios are shown. Two-sided Fisher's exact test with Benjamini-Hochberg correction. (G) Schematic representation of Cic-L and Cic-S cKO mouse experiments. (H) Number of CD4+CD25+CD127-Foxp3+ cells per spleen from CD4+ T-cell–specific homozygous Cic-L and Cic-S cKO mice (n = 4-5). Data represent means + standard deviation. Two-sided Welch's t test. BD, binding domain; COAD-US, colon adenocarcinoma from the US; HMG, high mobility group box; LGG-US, brain lower grade glioma from the United States (US); NLS, nuclear localization signal; STAD-US, gastric adenocarcinoma from the US.
CIC forms a transcriptional repressor complex with ATXN1.18 Expansion of the ATXN1 polyglutamine stretch is reported to cause gain of function of the CIC-ATXN1 complex, leading to neurodegeneration in spinocerebellar ataxia type 1.22 Interestingly, when cooccurrence and exclusion relationships between somatic alterations (as described below in detail) were assessed,one of the most significant relationships was the mutual exclusion between CIC and ATXN1 alterations (Figure 1F), likely reflecting a functional association between them. Along with previously reported loss-of-function mutations and deletions, WGS analysis revealed frequent disrupting SVs of ATXN1 in 20% of the cases, of which 12 cases harbored multiple ATXN1 SVs (n = 2–8) (supplemental Figure 2C-D). In combination, CIC-ATXN1 alterations were detected in 53% of cases, suggesting a critical role in ATL leukemogenesis.
To elucidate the functional consequence of CIC-L disruption, we generated conditional knockout mouse models for either Cic-S or Cic-L and crossed them with Cd4-Cre transgenic mice (Figure 1G). We validated recombination of the isoform-specific exons and selective loss of either isoform expression in CD4+ T cells (supplemental Figure 2E-F). Remarkably, whereas Cic-S cKO had negligible effect, Cic-L knockout caused a nearly twofold increase in numbers of CD4+CD25+CD127-Foxp3+ T cells, suggesting that CIC-L loss may induce T-cell activation or increase regulatory T-cell numbers. Peripheral blood counts and other splenic T-cell subsets were comparable between cKO and WT mice irrespective of the deficient isoform (Figure 1H; supplemental Figure 2G-I). These results demonstrate a selective and crucial role of CIC-L in regulating T-cell homeostasis.
Other novel mutational targets were frequently affected by loss-of-function mutations and SVs (supplemental Figure 3). They included the switch-sucrose nonfermentable complex components (SMARCB1 and DPF2)23 and membrane proteins associated with immune response (WDFY4 and ITGB1)24,25 and cell polarization (FRMPD2).26 In addition, transcription factors (TFs) (ZNF292 and KLF2),27,28 a translational regulator (EEF1A1),29 and a nuclear export receptor (XPO1)30 were also commonly altered, which have been recurrently described in mature lymphoid neoplasms.
REL-truncating SVs in ATL and DLBCL
In addition to significant arm-level gains (n = 9) and an arm-level loss (n = 1), GISTIC analysis identified significant focal amplifications (n = 6) and focal deletions (n = 20) (q < 0.01 and with ≤5 Mb in size), of which 4 and 9 contained previously reported drivers and/or mutational targets, respectively (supplemental Figure 4A-B; supplemental Tables 6 and 7). Breakpoint enrichment analysis in each gene identified 28 genes recurrently affected by SVs (q < 0.01) (supplemental Figure 4C; supplemental Table 8). For most of the recurrent SV targets, several SV types were observed, and the breakpoints were distributed throughout the genes, probably leading to their inactivation. Although there were many copy number alterations (CNAs) and/or SVs in putative fragile sites,7 such as LRRN3/IMMP2L, ANKRD11/SPG7, and HDHD1/STS, these targets included many tumor suppressors also affected by mutations (supplemental Figure 4D-E). Particularly, ARID2 (encoding a member of the switch-sucrose nonfermentable complex)23 and SYNCRIP (encoding heterogeneous nuclear ribonucleoprotein Q implicated in mRNA processing)31 were frequently affected by SVs, together with other alterations, accounting for 31% and 23% of cases, respectively. As reported,6,7 activating SVs (CARD11 and CD274), dominant-negative SVs (TP73 and IKZF2), and fusion-generating SVs (CD28) preferentially involved specific introns, suggesting that specific gain-of-function forms of mutant proteins were selected, similar to those resulting from oncogenic hotspot mutations (supplemental Figure 4D).
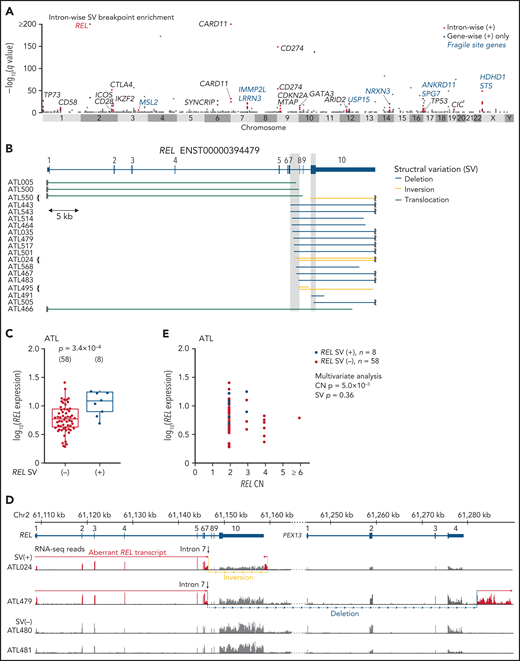
To identify gain-of-function SVs and discriminate them from passengers in putative fragile sites, we evaluated breakpoint enrichment in each intron and revealed the second most significant breakpoint clustering in intron 7 of REL (Figure 2A; supplemental Table 9). REL encodes c-Rel, a member of the Rel/NF-κB family of transcription factors involved in T- and B-cell function.32 Although REL alterations, especially focal amplification, are found in several subtypes of B-cell lymphomas, such as GCB-DLBCL,33-35REL rearrangements have not been well characterized. In ATL, 19 (13%) cases harbored breakpoints in REL, which were mainly located in intron 7 but also present in exon 10 (Figure 2B; supplemental Table 10). Although REL SVs included various SV types, an aberrant REL allele was created in all cases, where the authentic 3′ exons (exons 8-10) were lost and/or replaced by an ectopic sequence derived from the rearranged regions. These SVs not only elevated REL expression but also generated aberrant REL transcripts, where exons 1-7 and the adjacent part of intron 7 were transcribed and fused into intronic or intergenic sequence containing a putative polyadenylation (poly-A) signal in most cases (Figure 2C-E; supplemental Figure 5A-B). In the remaining case (ATL466), only a partial sequence of the 3′-UTR was lost, whereas the entire CDS was retained.
REL-truncating SVs in ATL. (A) Introns with significantly enriched SV breakpoints. Introns with q < 0.01, whose breakpoints are found in ≥3 cases, and of gene-wise significant gene, are considered intron-wise significant. Introns with breakpoints in ≥2 cases (n = 888) are shown. (B) REL-truncating SVs in 150 ATL cases. Breakpoint clustered regions (intron 7 and coding sequence in exon 10) are shaded. (C) Expression of REL exon 1-7 in 66 ATL cases analyzed by RNA-seq, according to REL SV status. Numbers of cases are shown in parentheses. Two-sided Brunner-Munzel test. Box plots show the medians (lines), IQRs (boxes), and ± 1.5 × IQR (whiskers). (D) Genomic structure of the rearranged REL locus and transcription in representative ATL cases. In these SV (+) cases, REL open reading frame is terminated within intron 7 and merged into intergenic sequences. Aberrant REL transcripts are shown in red. (E) Effect of REL CN and SV on REL exon 1-7 expression for ATL. Multivariate analysis using linear model. (B,D) mRNA reference sequences are shown in supplemental Table 23.
REL-truncating SVs in ATL. (A) Introns with significantly enriched SV breakpoints. Introns with q < 0.01, whose breakpoints are found in ≥3 cases, and of gene-wise significant gene, are considered intron-wise significant. Introns with breakpoints in ≥2 cases (n = 888) are shown. (B) REL-truncating SVs in 150 ATL cases. Breakpoint clustered regions (intron 7 and coding sequence in exon 10) are shaded. (C) Expression of REL exon 1-7 in 66 ATL cases analyzed by RNA-seq, according to REL SV status. Numbers of cases are shown in parentheses. Two-sided Brunner-Munzel test. Box plots show the medians (lines), IQRs (boxes), and ± 1.5 × IQR (whiskers). (D) Genomic structure of the rearranged REL locus and transcription in representative ATL cases. In these SV (+) cases, REL open reading frame is terminated within intron 7 and merged into intergenic sequences. Aberrant REL transcripts are shown in red. (E) Effect of REL CN and SV on REL exon 1-7 expression for ATL. Multivariate analysis using linear model. (B,D) mRNA reference sequences are shown in supplemental Table 23.
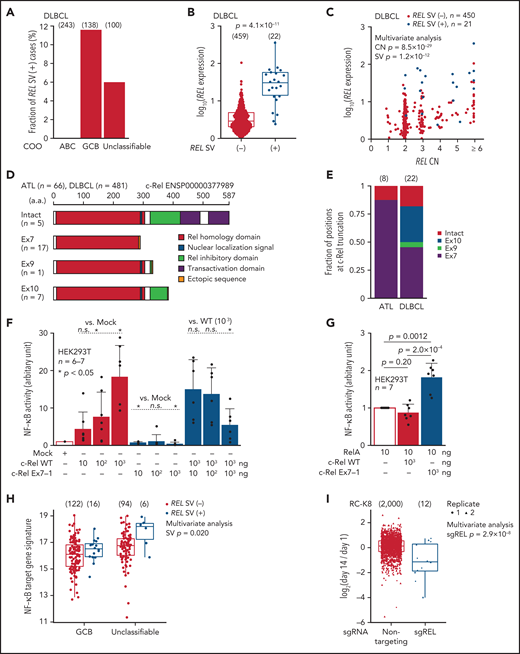
As REL amplifications are frequently found in GCB-DLBCL,35 we searched for aberrant REL transcripts using RNA-seq data of 481 DLBCL samples from the National Cancer Institute Center for Cancer Research.35 In this cohort, whereas no abnormal REL transcripts were observed in activated B-cell–like subtype, 16 (12%) GCB and 6 (6%) unclassifiable cases expressed abnormal REL transcripts associated with elevated expression (Figure 3A-B; supplemental Figure 5C-D; supplemental Table 11). As reported, REL CN was correlated with its expression in DLBCL, whereas such correlation was not observed in ATL (Figures 2E and 3C). Importantly, irrespective of its CN status, REL SVs were significantly and independently associated with elevated REL expression (Figures 2E and 3C). When ATL and DLBCL cases were combined, the entire REL CDS was fully preserved in only 5 SV (+) cases, whereas in most of the remaining cases, the CDS was interrupted at the end of exon 7 (n = 17) or within exon 10 (n = 7), generating a premature truncation of the protein (Figure 3D; supplemental Figure 5E). All of the predicted proteins from the abnormal REL transcripts lacked the transactivation domain while retaining almost the entire Rel homology domain. Whereas most ATL cases expressed truncated REL transcripts at exon 7, its product was intact or more 3′-truncated in DLBCL (Figure 3E). Overexpression of truncated c-Rel protein was confirmed using clinical samples of ATL (supplemental Figure 5F).
REL-truncating SVs in DLBCL and its oncogenic function. (A) Frequency of aberrant REL transcripts in DLBCL according to cell-of-origin (COO). Numbers of cases are shown in parentheses. (B) Expression of REL exon 1-7 in 481 DLBCL cases from the National Cancer Institute Center for Cancer Research cohort35 analyzed by RNA-seq according to REL SV status. Numbers of cases are shown in parentheses. Two-sided Brunner-Munzel test. (C) Effect of REL CN and SV on REL exon 1-7 expression for DLBCL with available CN data (n = 471). Multivariate analysis using linear model. (D) Predicted structures of intact and representative truncated c-Rel proteins according to the truncation position. (E) Comparison of the truncation position of c-Rel proteins between ATL and DLBCL cases. Numbers of cases are shown in parentheses. (F-G) Luciferase assays of NF-κB transcriptional activity in HEK293T cells transduced to express WT and/or Ex7-1 c-Rel (F) and together with RelA (G) at indicated amount. (H) ssGSEA scores in GCB and unclassifiable DLBCL stratified by REL SV using a gene signature of NF-κB activation.46 Numbers of cases are shown in parentheses. Multivariate analysis using linear model. (I) Growth change of a REL SV-harboring DLBCL cell line (RC-K8) by clustered regularly interspaced short palindromic repeat (CRISPR)-mediated REL KO.36 Dot represents ratio of normalized abundance of each sgRNA in genome-scale CRISPR knockout library. Numbers of sgRNAs are shown in parentheses. Multivariate analysis using linear model. (B,H,I) Box plots show the medians (lines), IQRs (boxes), and ± 1.5 × IQR (whiskers). (F-G) Data represent means + standard deviation. Two-sided Welch's t test. Ex, exon; n.s., not significant.
REL-truncating SVs in DLBCL and its oncogenic function. (A) Frequency of aberrant REL transcripts in DLBCL according to cell-of-origin (COO). Numbers of cases are shown in parentheses. (B) Expression of REL exon 1-7 in 481 DLBCL cases from the National Cancer Institute Center for Cancer Research cohort35 analyzed by RNA-seq according to REL SV status. Numbers of cases are shown in parentheses. Two-sided Brunner-Munzel test. (C) Effect of REL CN and SV on REL exon 1-7 expression for DLBCL with available CN data (n = 471). Multivariate analysis using linear model. (D) Predicted structures of intact and representative truncated c-Rel proteins according to the truncation position. (E) Comparison of the truncation position of c-Rel proteins between ATL and DLBCL cases. Numbers of cases are shown in parentheses. (F-G) Luciferase assays of NF-κB transcriptional activity in HEK293T cells transduced to express WT and/or Ex7-1 c-Rel (F) and together with RelA (G) at indicated amount. (H) ssGSEA scores in GCB and unclassifiable DLBCL stratified by REL SV using a gene signature of NF-κB activation.46 Numbers of cases are shown in parentheses. Multivariate analysis using linear model. (I) Growth change of a REL SV-harboring DLBCL cell line (RC-K8) by clustered regularly interspaced short palindromic repeat (CRISPR)-mediated REL KO.36 Dot represents ratio of normalized abundance of each sgRNA in genome-scale CRISPR knockout library. Numbers of sgRNAs are shown in parentheses. Multivariate analysis using linear model. (B,H,I) Box plots show the medians (lines), IQRs (boxes), and ± 1.5 × IQR (whiskers). (F-G) Data represent means + standard deviation. Two-sided Welch's t test. Ex, exon; n.s., not significant.
As recurrent truncations at specific regions in REL suggest a gain of function of the resultant proteins, we investigated the biological function of the C-terminal truncated forms of c-Rel. Luciferase reporter assay showed that truncated c-Rel proteins did not upregulate NF-κB transcription, unlike WT c-Rel, and exhibited a dominant-negative effect against WT c-Rel (Figure 3F; supplemental Figure 5G). Unexpectedly, when coexpressed with another NF-κB subunit RelA, truncated c-Rel, but not WT c-Rel, enhanced NF-κB activation compared with RelA alone (Figure 3G), suggesting synergy between RelA and truncated c-Rel. These results were supported by RNA-seq data showing increased NF-κB gene signature in REL SV-harboring DLBCL cases (Figure 3H). Furthermore, CRISPR-mediated REL knockout36 suppressed proliferation of a REL SV-harboring DLBCL cell line (Figure 3I). Therefore, recurrent REL SVs not only increase its mRNA level but also generate gain-of-function c-Rel proteins, thereby functioning as an oncogenic driver in ATL and DLBCL.
Recurrent alterations in noncoding genome
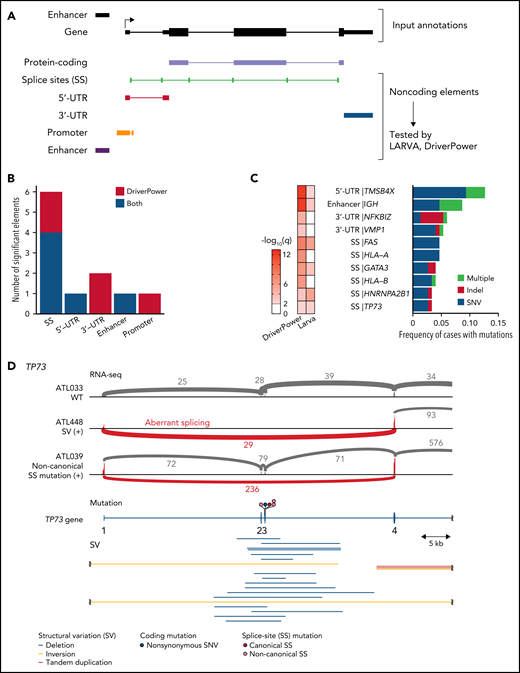
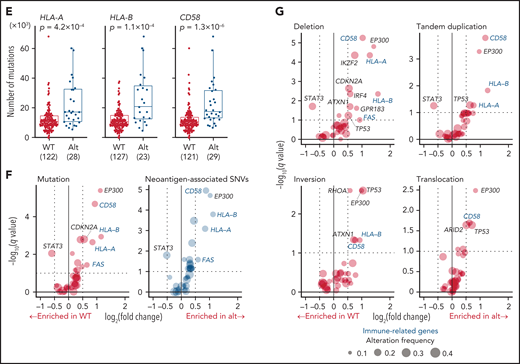
Recurrent noncoding mutations were examined by DriverPower15 and LARVA37 algorithms, which identified 11 significant noncoding elements (Figure 4A-C; supplemental Tables 12 and 13). The most significant was the 5′-UTR of TMSB4X (11%), followed by IGH enhancer (9%), both of which were frequently affected by multiple mutations. Other significant elements included the 3′-UTRs of NFKBIZ and VMP1 (supplemental Figure 6A). Although NFKBIZ 3′-UTR mutations have been reported to cause its transcriptional upregulation in DLBCL,38 no expression change was observed in cases with these UTR mutations. Notably, SS mutations were observed in 6 genes despite their low individual frequencies. These included mutations in TP73 exon 3 SSs, which caused exon skipping of exons 2 and 3, like intragenic deletions7 (Figure 4D). Moreover, SS mutations were frequent in HLA-A and HLA-B, leading to aberrant splicing (supplemental Figure 6B-C). Interestingly, when the associations of somatic alterations with mutation and SV frequencies were examined, immune-related molecules, such as HLA-A, HLA-B, CD58, and FAS, correlated with increased mutations and neoantigen-associated mutations (Figure 4E-F; supplemental Figure 6D-E). These alterations were also associated with increased SVs, particularly deletions and tandem duplications (Figure 4G; supplemental Figure 6F-G), suggesting that immune evasion enables the accumulation of somatic alterations. As described in other cancer types,39 inversions and translocations were more frequent in TP53-altered cases (Figure 4G). Surprisingly, EP300 aberrations showed strong associations with both mutation and SV frequencies (Figure 3F-G; supplemental Figure 6E-G), demonstrating the relevance of EP300-mediated epigenetic deregulation in promoting genomic instability. Together, several types of alterations were linked to distinct drivers, shedding light on their etiology.
Characteristics of noncoding alterations in ATL. (A) Schematic representation for the definition of noncoding elements according to the functional annotations of the PCAWG project.47 (B) Number of significant noncoding elements detected in DriverPower15 and LARVA.37 (C) Frequency and type of cases with mutations within significant noncoding elements and their q values. (D) Sashimi plot for TP73 transcripts within exons 1-4 of WT, SV (+), and noncanonical SS mutation (+) cases, visualized by Integrative Genomics Viewer (top). Distribution and type of coding and SS mutations and SVs in TP73 (bottom). Arcs represent splicing reads split across exons with their numbers. Only arcs with ≥10 split-reads are shown. mRNA reference sequence is shown in supplemental Table 23. (E) Number of mutations according to the alteration status of HLA-A, HLA-B, and CD58. Numbers of cases are shown in parentheses. Two-sided Brunner-Munzel test. (F) Association of driver alterations and number of mutations (left) and neoantigen-associated SNVs (right). (G) Association of driver alterations and number of SVs. (F-G) Thirty-two genes altered in ≥10% of cases are considered. Fold changes of mean alteration numbers between cases with and without the indicated alterations and their significance are shown. Circle size represents their alteration frequency. Immune-related genes are colored in blue. Two-sided Brunner-Munzel test with Benjamini-Hochberg correction.
Characteristics of noncoding alterations in ATL. (A) Schematic representation for the definition of noncoding elements according to the functional annotations of the PCAWG project.47 (B) Number of significant noncoding elements detected in DriverPower15 and LARVA.37 (C) Frequency and type of cases with mutations within significant noncoding elements and their q values. (D) Sashimi plot for TP73 transcripts within exons 1-4 of WT, SV (+), and noncanonical SS mutation (+) cases, visualized by Integrative Genomics Viewer (top). Distribution and type of coding and SS mutations and SVs in TP73 (bottom). Arcs represent splicing reads split across exons with their numbers. Only arcs with ≥10 split-reads are shown. mRNA reference sequence is shown in supplemental Table 23. (E) Number of mutations according to the alteration status of HLA-A, HLA-B, and CD58. Numbers of cases are shown in parentheses. Two-sided Brunner-Munzel test. (F) Association of driver alterations and number of mutations (left) and neoantigen-associated SNVs (right). (G) Association of driver alterations and number of SVs. (F-G) Thirty-two genes altered in ≥10% of cases are considered. Fold changes of mean alteration numbers between cases with and without the indicated alterations and their significance are shown. Circle size represents their alteration frequency. Immune-related genes are colored in blue. Two-sided Brunner-Munzel test with Benjamini-Hochberg correction.
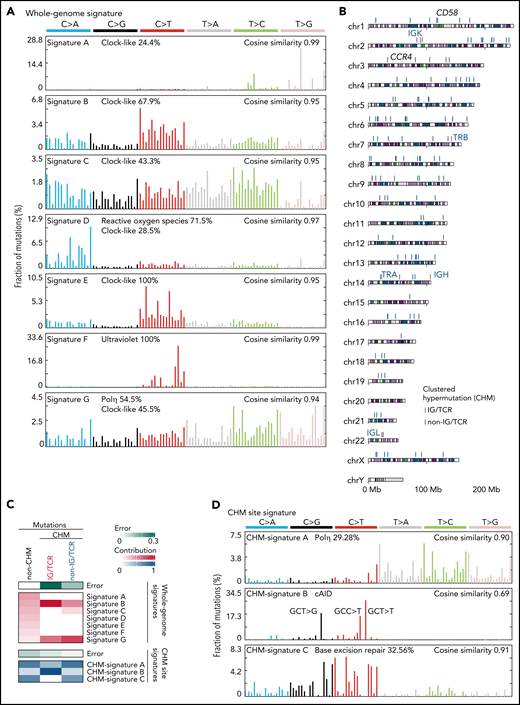
We next characterized mutational processes in ATL genome by de novo extraction of mutational signatures and identified 7 signatures attributed to aging (clock-like), reactive oxygen species, UV exposure, polymerase η activity, and unknown etiology40 (Figure 5A; supplemental Figure 7A-C; supplemental Tables 14 and 15). Clustered hypermutation (CHM) was found in 166 sites, particularly in immunoglobulin (IG) or T-cell receptor (TCR) genes, in 49 cases (Figure 5B; supplemental Figure 7D; supplemental Table 16). As the whole-genome signatures did not well explain the CHMs (Figure 5C), mutational signatures were also explored in these sites, which identified 3 signatures associated with polymerase η (Polη), canonical activation-induced cytidine deaminase (cAID) activity,41 and base excision repair deficiency (Figure 5D; supplemental Figure 7A-B; supplemental Tables 14 and 15). Interestingly, IG/TCR regions showed predominant cAID signature, whereas base excision repair signature more contributed to non-IG/TCR regions (Figure 5C,E), suggesting different mutational processes operate in different hypermutation clusters.
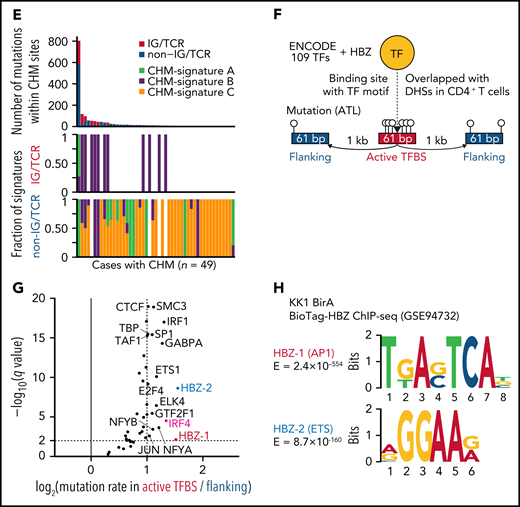
Mutational processes operative in ATL. (A) Seven de novo mutational signatures extracted from the whole-genome mutations. Known related etiologies are noted. Cosine similarities between de novo signatures and reconstructed signatures using the COSMIC database40are shown. (B) Distribution of CHM sites detected by SeqKat. Driver, IG, and TCR genes are noted. (C) Heatmap showing the relative contribution of whole-genome (Signature A-G), and CHM-specific signatures (CHM-signature A-C) across the CHMs within and outside the IG/TCR regions (CHM IG/TCR and CHM non-IG/TCR, respectively) and the remaining mutations (non-CHM). (D) Three de novo mutational signatures extracted from the CHM sites found in 49 ATL cases. (E) Number of mutations (top) and fraction of CHM signatures (bottom), stratified with the membership of the IG/TCR regions within CHM sites for each case. (F) Schematic representation for the analysis of mutation enrichment within active TF binding. (G) Volcano plot displaying differential mutation rate between active binding sites and its flanking regions for 40 TFs from ENCODE database48 and HBZ (with 2 motifs) in 150 ATL cases. Two-sided Fisher test with Benjamini-Hochberg correction. (H) Two HBZ motifs (AP1 and ETS) identified using MEME-ChIP (E < 1 × 10−150). DHSs, DNase I hypersensitive sites.
Mutational processes operative in ATL. (A) Seven de novo mutational signatures extracted from the whole-genome mutations. Known related etiologies are noted. Cosine similarities between de novo signatures and reconstructed signatures using the COSMIC database40are shown. (B) Distribution of CHM sites detected by SeqKat. Driver, IG, and TCR genes are noted. (C) Heatmap showing the relative contribution of whole-genome (Signature A-G), and CHM-specific signatures (CHM-signature A-C) across the CHMs within and outside the IG/TCR regions (CHM IG/TCR and CHM non-IG/TCR, respectively) and the remaining mutations (non-CHM). (D) Three de novo mutational signatures extracted from the CHM sites found in 49 ATL cases. (E) Number of mutations (top) and fraction of CHM signatures (bottom), stratified with the membership of the IG/TCR regions within CHM sites for each case. (F) Schematic representation for the analysis of mutation enrichment within active TF binding. (G) Volcano plot displaying differential mutation rate between active binding sites and its flanking regions for 40 TFs from ENCODE database48 and HBZ (with 2 motifs) in 150 ATL cases. Two-sided Fisher test with Benjamini-Hochberg correction. (H) Two HBZ motifs (AP1 and ETS) identified using MEME-ChIP (E < 1 × 10−150). DHSs, DNase I hypersensitive sites.
Then, we analyzed mutation burden at binding sites of host and viral TFs in ATL. As reported in melanoma,42 mutation rates were elevated at active binding sites of several host TFs, with IRF4, a critical regulator in ATL,43 being the highest (Figure 5F-G), suggesting that mutation burden may reflect transcriptional activity. Remarkably, HBZ binding sites with AP-1 and ETS recognition sequences, which were identified using available chromatin immunoprecipitation-sequencing (ChIP-seq) data of ATL cell lines,43 showed the highest enrichment (Figure 5G-H; supplemental Table 17), reinforcing a pivotal role of HBZ in ATL pathogenesis. Combined ChIP-seq data analysis of IRF4 and its binding partner BATF343 revealed that these 2 TFs colocalized with HBZ in the genome, suggesting the importance of their coordinated TF activity (supplemental Figure 7E).
Other cancer-related genomic features were also analyzed in ATL. Telomere length was neither different among subtypes nor correlated with any driver alterations (supplemental Figure 8A-C). Microsatellite instability was rarely observed in ATL (supplemental Figure 8D). Regardless of subtype, most cases possessed 1-10 mobile element insertions, mainly consisting of long interspersed nuclear element-1 retrotranspositions (supplemental Figure 8E-G; supplemental Table 18), which were more common than other hematologic malignancies analyzed in the PCAWG project.44 In total, 23% of cases had chromothripsis, which was more frequent in acute than chronic and smoldering subtypes (supplemental Figure 8H-I; supplemental Table 19). Consistent with their associations with SV frequency, EP300 and CD58 alterations were significantly associated with increased frequency of chromothripsis, whereas chromothripsis was uncommon in STAT3-altered cases (supplemental Figure 8J).
Driver landscape of ATL
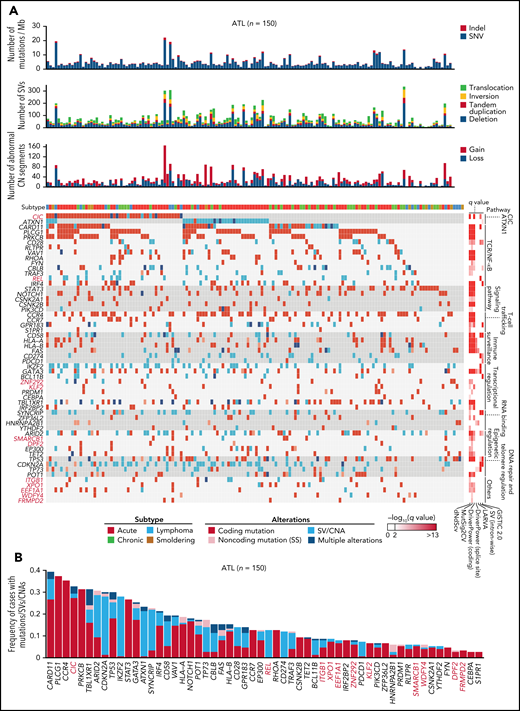
Altogether, 56 significantly altered genes were identified, including 47, 13, 13, and 6 genes affected by coding mutations, CNAs, SVs, and noncoding (SS) mutations, respectively (Figure 6A-B; supplemental Figure 9A; supplemental Table 20). When all types of alterations were considered, 32 genes were altered in more than 10% of cases. The median number of driver alterations was 9 per case, and at least 1 driver alteration was found in 149 cases (>99%). Although 65% and 11% of total driver alterations were coding mutations and CNAs, SVs and noncoding mutations accounted for 27% and 4% of them. Four drivers, including ATXN1 and REL, were affected almost exclusively (>85%) by SVs while showing quite high alteration frequencies (12% to 28%). Moreover, putative gain-of-function SVs were detected in driver genes detected by mutation and/or CNA analyses, including C-terminal truncating SVs in VAV1 (n = 7) and NOTCH1 (n = 2) (supplemental Figure 9B). Particularly, 4 cases harbored intragenic deletions affecting exon 3 of BCL11B, which induced exon skipping of the deleted exon. The numbers of total mutations, SVs, abnormal CN segments, and driver alterations were higher in aggressive (acute and lymphoma) than indolent (chronic and smoldering) subtypes. However, no driver genes were characteristic of either subtype except for STAT3 mutations, which were enriched in indolent subtypes7 (supplemental Figure 9C-D). Therefore, the WGS analysis presents a substantially different driver landscape from the previous studies, showing a higher frequency of driver alterations in a larger number of patients.7-9
Whole-genome landscape of driver alterations in ATL. (A) Significant somatic mutations, SVs, and focal CNAs in 56 commonly affected genes across ATL cases (n = 150). Number of somatic mutations, SVs, CNA segments, clinical subtypes (top), and q values from driver-calling algorithms and related functional pathways (right) are also shown. (B) Frequency and type of somatic mutations, SVs, and focal CNAs in 56 driver genes for 150 ATL cases. (A-B) Newly detected driver genes in ATL are highlighted in red (n = 11).
Whole-genome landscape of driver alterations in ATL. (A) Significant somatic mutations, SVs, and focal CNAs in 56 commonly affected genes across ATL cases (n = 150). Number of somatic mutations, SVs, CNA segments, clinical subtypes (top), and q values from driver-calling algorithms and related functional pathways (right) are also shown. (B) Frequency and type of somatic mutations, SVs, and focal CNAs in 56 driver genes for 150 ATL cases. (A-B) Newly detected driver genes in ATL are highlighted in red (n = 11).
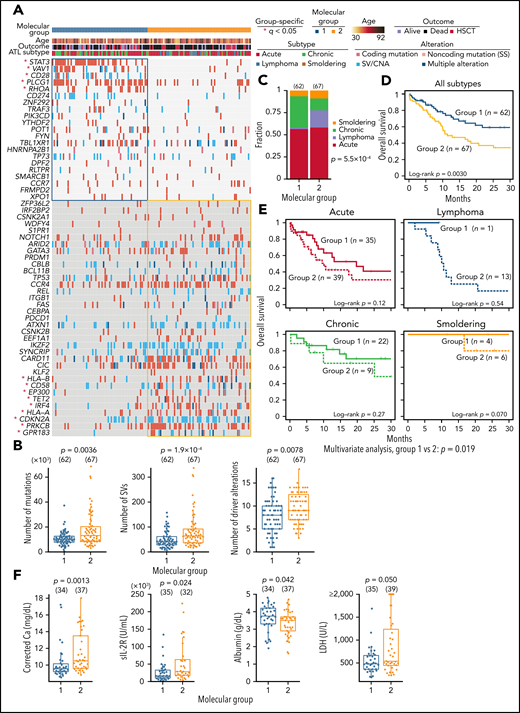
Finally, we integrated 56 drivers using consensus clustering based on nonnegative matrix factorization and identified 2 molecular groups (Figure 7A; supplemental Figure 10A-B; supplemental Tables 21 and 22). Group 1 showed fewer mutations, SVs, and driver alterations and was enriched with alterations affecting proximal TCR-signaling molecules45 (including PLCG1, VAV1, CD28, and RHOA) and STAT3, whereas distal TCR/NF-κB pathway components (PRKCB and IRF4), immune-related molecules (HLA-A, HLA-B, and CD58), and epigenetic regulators (EP300 and TET2) were more frequently altered in group 2 (Figure 7A-B). Clinically, most lymphoma cases were classified into group 2, whereas group 1 mainly consisted of leukemic cases (Figure 7C). Moreover, group 2 showed a worse prognosis than group 1, independently of clinical subtype, which was validated in another cohort previously analyzed by targeted sequencing (Figure 7D-E; supplemental Figure 10C; supplemental Table 22). In acute subtype, group 2 showed or tended to show higher calcium, soluble interleukin-2 receptor, and lactate dehydrogenase levels and a lower albumin level (Figure 7F). These results underscore the biological and clinical relevance of the molecular classification of ATL.
Association between somatic alterations and clinical features in ATL. (A) Nonnegative matrix factorization–based consensus clustering of ATL samples using 56 driver alterations. Group 1 (n = 62) and group 2 (n = 67) cases with a silhouette score ≥0.5 are shown. *Significant group-specific genes (2-sided Fisher's exact test with Benjamini-Hochberg correction q < 0.05). (B) Comparison of number of mutations, SVs, and driver alterations between molecular groups. (C) Fraction of clinical subtypes within each molecular group. Number of cases in each group is shown in parenthesis. Two-sided Fisher's exact test. (D) Overall survival according to the molecular groups. Kaplan-Meier method with log-rank test. (E) Overall survival in each clinical subtype according to the molecular groups using Kaplan-Meier method. Log-rank test and Cox proportional hazards model (using clinical subtype as a covariate) for univariate and multivariate analysis, respectively. (F) Comparison of laboratory data in ATL cases between molecular groups 1 and 2. Two-sided Brunner-Munzel test. Calcium concentration was corrected using Payne’s formula. (A-F) Samples with silhouette score ≥0.5 were analyzed. (B,F) Two-sided Brunner-Munzel test. Box plots show medians (lines), IQRs (boxes), and ± 1.5 × IQR (whiskers). Ca, calcium; HSCT, hematopoietic stem cell transplantation; LDH, lactate dehydrogenase; sIL-2R, soluble interleukin-2 receptor.
Association between somatic alterations and clinical features in ATL. (A) Nonnegative matrix factorization–based consensus clustering of ATL samples using 56 driver alterations. Group 1 (n = 62) and group 2 (n = 67) cases with a silhouette score ≥0.5 are shown. *Significant group-specific genes (2-sided Fisher's exact test with Benjamini-Hochberg correction q < 0.05). (B) Comparison of number of mutations, SVs, and driver alterations between molecular groups. (C) Fraction of clinical subtypes within each molecular group. Number of cases in each group is shown in parenthesis. Two-sided Fisher's exact test. (D) Overall survival according to the molecular groups. Kaplan-Meier method with log-rank test. (E) Overall survival in each clinical subtype according to the molecular groups using Kaplan-Meier method. Log-rank test and Cox proportional hazards model (using clinical subtype as a covariate) for univariate and multivariate analysis, respectively. (F) Comparison of laboratory data in ATL cases between molecular groups 1 and 2. Two-sided Brunner-Munzel test. Calcium concentration was corrected using Payne’s formula. (A-F) Samples with silhouette score ≥0.5 were analyzed. (B,F) Two-sided Brunner-Munzel test. Box plots show medians (lines), IQRs (boxes), and ± 1.5 × IQR (whiskers). Ca, calcium; HSCT, hematopoietic stem cell transplantation; LDH, lactate dehydrogenase; sIL-2R, soluble interleukin-2 receptor.
Discussion
Our WGS analysis has generated the systematic overview of ATL genome, identifying many novel alterations that have not been well characterized in ATL or other cancers. Particularly, CIC-L is preferentially targeted by loss-of-function alterations that eluded previous exome-centric genomic studies. CIC-L inclusion doubles CIC mutational frequency in gastrointestinal adenocarcinomas, suggesting possible existence of unidentified alterations and/or drivers in human cancers. Combined with ATXN1 SVs, alterations in the CIC-ATXN1 complex affect most ATL patients. Despite the rarity of ATL, findings from our genetic and functional studies help to uncover novel mechanisms regulating the originating cell types.
Conventional approaches for identifying recurrent SVs usually calculate SV breakpoint frequency per gene or per bin of fixed size. However, we have elaborated the analytical approach for identifying gain-of-function SVs by focusing on the breakpoint frequency per intron, which can offer implications for cancer genome studies. This enabled us to discover frequent REL SVs both in ATL and GCB-DLBCL, highlighting shared mechanisms driving T- and B-cell lymphomagenesis. We also disclosed pleiotropic features of the ATL genome, resolved the topography of mutational processes, and derived insights into the etiology of mutations and SVs, associating immune-related molecules and EP300 with increased burden of various alterations.
Finally, we unraveled the landscape of driver alterations, including noncoding mutations, which permit molecular classification of ATL associated with discrete clinical and genetic characteristics, such as differential roles of proximal and distal components of TCR/NF-κB pathway. Taken together, our study demonstrates the potential of WGS analysis as illustrated by multiple discoveries in the coding and noncoding genome. Our WGS data will also serve as a repository for continued exploration of the biological and clinical significance of genetic alterations, providing a fundamental basis for refining diagnostic and therapeutic strategies in ATL.
Acknowledgments
The authors thank Shizue Ichimura, Fumie Ueki, Miki Sagou, Yoko Hokama, and Yoshiko Ito for technical assistance. The supercomputing resources were provided by the Human Genome Center, the Institute of Medical Science, The University of Tokyo. The Genomic Variation in Diffuse Large B Cell Lymphomas Study (phs001444.v2.p1) was supported by the Intramural Research Program of the National Cancer Institute, National Institutes of Health (NIH), US Department of Health and Human Services. The datasets have been accessed through the NIH database for Genotypes and Phenotypes (dbGaP). A full list of acknowledgments can be found in the supplemental note of reference 35.
This work was supported by the Japan Society for the Promotion of Science KAKENHI (JP21H04809 [K.K.] and JP21H05051 [K.K.]), Japan Agency for Medical Research and Development (JP21ck0106538 [K. Shimoda and K.K.], JP19ck0106254 [K. Shimoda and K.K.], JP19ak0101064 [K.K.]), Japan Society for the Promotion of Science Grant-in-Aid for Scientific Research on Innovative Areas (JP18H04907 [K.K.]), Japan Science and Technology Agency Moonshot R&D Program (JPMJMS2022 [K.K.]), Daiichi Sankyo Foundation of Life Science (K.K.), Takeda Science Foundation (K.K.), The Japanese Society of Hematology Research Grant (K.K.), a pilot grant from the Albert Einstein Cancer Center (B.H.Y), and the National Institutes of Health National Cancer Institute Cancer Center Support Grant (P30 CA008748 [U.S.]).
Authorship
Contribution: Y. Kogure, Y. Saito, Y. Ito, and K.K. performed sequencing data analyses; M.B.M., M.T., N.K., Y.N., T.S., and S.O. assisted sequencing data analyses; K.C., A.O., Y. Shiraishi, and S.M. developed sequence data processing pipelines; T.K., M.Y., K.N., J.Y., Y. Imaizumi, M.W., A. Kamiunten, Y.T., K.A., M.S., K. Shide, T.H., Y. Kubuki, A. Kitanaka, M.H., N.N., A.U., R.A.S., A.A.-V., M.J., U.S. J.C.R., A.T.-K., Y.M., M.M., K.I., B.H.Y., K. Shimoda managed patients and prepared samples; K.T. assisted pathological assessment; Y. Kogure and J.K. performed functional assays; S.S. and K.Y. supported functional assays; Y. Kogure and K.K. generated figures and tables and wrote the manuscript; K.K. led the entire project; and all authors participated in discussions and interpretation of the data and results.
Conflict-of-interest disclosure: Y. Kogure has received honoraria from Takeda Pharmaceutical. J.K. has received honoraria from 10X genomics. M.Y. has received honoraria from Novartis, Takeda Pharmaceutical, and Sanofi. K.N. has received consultancy fee from Kyowa Kirin; has received research funding from Kyowa Kirin and Chugai pharmaceutical; has received honoraria from Meiji Seika Pharma, Janssen Pharmaceutical, Celgene, and Bristol Myers Squibb. Y. Imaizumi has received honoraria from Kyowa Kirin, Celgene, Bristol Myers Squibb, Eisai, Sanofi, and Sumitomo Dainippon Pharma. Y.N. has received consultancy fee from Otsuka Pharmaceutical; has received lecturers fee from Astellas and Otsuka Pharmaceutical. M.H. has received research funding from Chugai pharmaceutical. N.N. has received consultancy fee from JIMRO; has received honoraria from Novartis, Takeda pharmaceutical, Chugai Pharmaceutical, Celgene, Otsuka Pharmaceutical, Nippon Shinyaku, Kyowa Kirin, and Asahi Kasei Pharma. A.U. has received honoraria from Novartis, Kyowa Kirin, Daiichi Sankyo, Bristol Myers Squibb, Celgene, Pfizer, Minophagen Pharmaceutical, Janssen Pharmaceutical, and Chugai pharmaceutical; has received consulting fees from HUYA Japan, JIMRO, Meiji Seika Pharma, and Otsuka Medical Devices. R.A.S. has received honoraria from PER, Miragen, Morphosys, and Curio. M.J. has received research funding from FATE and Nektar therapeutics; has received honoraria from Bristol Myers Squibb and Kyowa Kirin. U.S. has received research funding from Celgene, Bristol Myers Squibb and Janssen Pharmaceutical; has received honoraria from the Physicians Education Resource. K.T. has received research funding from Kyowa Kirin; has received personal fees from Chugai pharmaceutical, Kyowa Kirin, MSD, Takeda Pharmaceutical, Janssen Pharmaceutical, Eisai, Celgene, Yakult, and Taiho Pharmaceutical. A.T.-K. has received research funding from Celgene and Ono Pharmaceutical; has received honoraria from Bristol Myers Squibb. Y.M. has received research funding from Sumitomo Dainippon Pharma; has received honoraria from Astellas, Sumitomo Dainippon Pharma, Chugai pharmaceutical, Kyowa Kirin, AbbVie, Novartis, Bristol Myers Squibb, Pfizer, Janssen, Eisai, Daiichi Sankyo, Takeda Pharmaceutical, Sanofi, Janssen, and Nippon Shinyaku. K.I. has received consultancy fee from Daiichi Sankyo; has received research funding from Ono Pharmaceutical, and Kyowa Kirin; has received honoraria from Celgene, Chugai pharmaceutical, and Kyowa Kirin. S.M. is an advisor for Fujitsu and Liquid Mine. S.O. has received consultancy fee from Chordia Therapeutics and Kan Research Laboratory; holds stock in RegCell, Asahi Genomics and Chordia Therapeutics; has received research funding from Chordia Therapeutics, Kan Research Laboratory, Otsuka Pharmaceutical, Eisai, and Sumitomo Dainippon Pharma; has a patent for genetic alterations as a biomarker in T-cell lymphomas and a patent for PD-L1 abnormalities as a predictive biomarker for immune checkpoint blockade therapy. B.H.Y. has received a research grant from Rapt Therapeutics; has received honorarium from Daiichi Sankyo. K. Shimoda has received consultancy fee from Sierra and PharmaEssentia Japan; has received research funding from Chugai Pharmaceutical, AbbVie, Kyowa Kirin, Daiichi Sankyo, Shionogi, Otsuka Pharmaceutical, Eisai, Nippon Kayaku, Takeda Pharmaceutical, Sumitomo Dainippon Pharma, Mochida Pharmaceutical, Taisho Pharmaceutical, and PharmaEssentia Japan; has received honoraria from Novartis and Takeda Pharmaceutical; is a member of advisory committee for AbbVie. K.K. holds individual stocks in Asahi Genomics; has received research funding from Astellas Pharma, Eisai, Otsuka Pharmaceutical, Ono Pharmaceutical, Kyowa Kirin, Shionogi, Takeda Pharmaceutical, Sumitomo Dainippon Pharma, Chugai pharmaceutical, Teijin Pharma, Japan Blood Products Organization, Novartis, Bristol Myers Squibb, Mochida Pharmaceutical, JCR Pharmaceuticals, MSD, and Chordia Therapeutics; has received honoraria from Ono Pharmaceutical, Celgene, Eisai, Astellas Pharma, Novartis, Chugai pharmaceutical, AstraZeneca, Sumitomo Dainippon Pharma, Kyowa Kirin, Janssen Pharmaceutical, Takeda Pharmaceutical, and Otsuka Pharmaceutical; has a patent for genetic alterations as a biomarker in T-cell lymphomas and a patent for PD-L1 abnormalities as a predictive biomarker for immune checkpoint blockade therapy. T.K., J.Y., M.W., Y. Saito, Yuta Ito, M.B.M., M.T., S.S., K.Y., K.C., A.O., N.K., A. Kamiunten, Y.T., K.A., M.S., K. Shide, T.H., Y. Kubuki, A. Kitanaka, A.A.-V., J.C.R., T.S., M.M., and Y. Shiraishi declare no competing financial interests.
Correspondence: Keisuke Kataoka, 5-1-1 Tsukiji, Chuo-ku, Tokyo 104-0045, Japan; e-mail: kkataoka-tky@umin.ac.jp; Kazuya Shimoda, 5200 Kihara, Kiyotake, Miyazaki 889-1692, Japan; e-mail: kshimoda@med.miyazaki-u.ac.jp; and B. Hilda Ye, Albert Einstein College of Medicine, 1300, Morris Park Avenue, Bronx, NY 10461; e-mail: hilda.ye@einsteinmed.org.
WGS and RNA-seq data have been deposited in the European Genome-phenome Archive (EGA) under accession EGAS00001005237. All other datasets analyzed in this study are previously published. Custom code used in TF binding sites analysis is available at https://github.com/nccmo/ATL_WGS_TFBS.
Any additional information required to reanalyze the data reported in this paper is available upon request to the corresponding authors.
The online version of this article contains a data supplement.
There is a Blood Commentary on this article in this issue.
The publication costs of this article were defrayed in part by page charge payment. Therefore, and solely to indicate this fact, this article is hereby marked “advertisement” in accordance with 18 USC section 1734.
REFERENCES
Author notes
Y. Kogure, T.K., and J.K. contributed equally to the study.

This feature is available to Subscribers Only
Sign In or Create an Account Close Modal