

Key Points
Pembrolizumab is well tolerated and effective in some patients with relapsed/refractory B-cell lymphomas after CD19-directed CAR T cells.
Patients who respond to pembrolizumab have CAR T cells and non–CAR T cells that are less exhausted compared with nonresponding patients.

Abstract
CD19-directed chimeric antigen receptor–modified (CAR T) T cells achieve durable remissions in about 30% to 40% of relapsed/refractory large B-cell lymphomas. T-cell exhaustion and/or an immunosuppressive tumor microenvironment may contribute to CAR T-cell failure. Pembrolizumab, an anti-PD1 immune checkpoint inhibitor, may reverse T-cell exhaustion after CAR T-cell therapy. We treated 12 patients with B-cell lymphomas who were either refractory to (n = 9) or relapsed after (n = 3) CD19-directed CAR T-cell (4-1BB–costimulated) therapy with pembrolizumab 200 mg IV every 3 weeks. Median time from CAR T-cell infusion to first pembrolizumab dose was 3.3 months (range, 0.4-42.8 months). Pembrolizumab was well tolerated, and the only grade ≥3 adverse events related to pembrolizumab were neutropenia (n = 3; 25%). Best overall response rate after pembrolizumab was 25% (3 of 12 patients; 1 complete response; 2 partial responses). One (8%) patient had stable disease; thus, 4 of 12 (33%) patients had clinical benefit. After pembrolizumab, 4 patients with clinical benefit had an increase in percentage of CAR T cells by mass cytometry by time of flight (CyTOF); 3 of 4 of these patients also had increases in CAR19 transgene levels by quantitative polymerase chain reaction. Deep immune profiling using CyTOF revealed increased CAR T-cell activation and proliferation and less T-cell exhaustion in clinical responders. Together, PD1 blockade with pembrolizumab after CD19-directed CAR T-cell therapy appears safe and may achieve clinical responses in some patients with B-cell lymphomas refractory to or relapsed after CAR T-cell therapy. This trial was registered at www.clinicaltrials.gove as #NCT02650999.
Introduction
Anti-CD19 chimeric antigen receptor–modified (CAR) T cells are now a standard of care for relapsed or refractory diffuse large B-cell lymphoma (DLBCL), high-grade B-cell lymphoma, transformed follicular lymphoma, primary mediastinal large B-cell lymphoma, and mantle cell lymphoma.1-4 Although CAR T-cell therapy achieves responses for many patients, long-term remissions occur in only 30% to 40% of patients with relapsed or refractory large B-cell lymphomas and in about 60% of patients with relapsed or refractory for follicular lymphoma.5-9 Thus, there remains an unmet need for effective therapies for patients with lymphoma failing to respond to or relapsing after CD19-directed CAR T-cell therapy.
Loss of the target antigen, CD19, has been clearly demonstrated as a mechanism of resistance to CAR T cells in B-cell acute lymphoblastic leukemia and less frequently in B-cell lymphomas10-15; however, most patients with lymphoma who fail CD19-directed CAR T-cell therapy do not have loss of CD19.1,8,16,17 Additionally, CAR T-cell persistence is not required for maintenance of a long-term clinical response in patients with lymphoma.8 These observations suggest that host/tumor factors are critical to clinical response. Other potential causes of CAR T-cell failure include T-cell exhaustion and an immunosuppressive tumor microenvironment (TME).2,18-20 In patients relapsed after or refractory to axicabtagene ciloleucel, two-thirds of patients' biopsies had immunohistochemical expression of PD-L1 by tumor cells or TME.21 Additionally, higher baseline levels of inhibitory checkpoint protein expression (PD-L1, LAG3) by tumor and TME cells have been reported in patients who do not respond to CAR T cells.2,16
We hypothesized that immune checkpoint blockade using anti–PD-1 antibodies would reverse T-cell exhaustion after CAR T-cell therapy. Clinically, we and others have observed that some patients with progressive lymphoma after CAR T cells responded to immune checkpoint blockade.22,23 We found that CAR T cells increased after pembrolizumab, and this increase was associated with elevated interleukin 6 levels, as well as a decrease in coexpression of PD-1 and Eomesodermin (EOMES) by CAR T cells.22 Granzyme B expression also increased after pembrolizumab in both CD4+ and CD8+ T-cell subsets. These observations led us to conduct an investigator-initiated clinical trial of pembrolizumab for patients with relapsed/refractory B-cell lymphomas after anti-CD19 CAR T-cell therapy.
Methods
This was a prospective, investigator-initiated, single-institution, phase 1/2a study of pembrolizumab in patients with relapsed or refractory B-cell lymphomas after treatment with anti-CD19 CAR T cells. This clinical trial was approved by the University of Pennsylvania Institutional Review Board, and all participants provided written informed consent.
Eligibility criteria
Patients were eligible if they received a single dose of CAR T cells expressing either murine or human monoclonal antibody-derived CD19-specific single chain variable fragment fused in tandem with 4-1BB and CD3ζ costimulatory/activation domains (CTL019,24,25 CTL11926,27). On documentation of progressive lymphoma, defined as disease at least 1.5 cm in long axis dimension on positron emission tomography (PET)/computed tomography (CT), contrast-enhanced CT, or magnetic resonance imaging, patients were eligible for enrollment. When feasible, patients underwent biopsy to document presence of lymphoma. Exclusion criteria included the following: intervening therapy between CAR T-cell infusion and screening, history of noninfectious pneumonitis, and history of autoimmune disease. Eligible patients had platelet counts ≥50 000/µL, absolute neutrophil counts ≥1000/µL, and hemoglobin ≥8 g/dL with a red blood cell transfusion requirement >7 days. Prior corticosteroid use was not an exclusion criterion, and there was no defined washout period for prior corticosteroids. After enrollment, corticosteroid use beyond physiologic replacement doses was only permitted for management of adverse events related to pembrolizumab.
Trial design
Patients received pembrolizumab 200 mg IV every 3 weeks for 1 year or until progression of disease, therapy-limiting toxicity, or elective protocol discontinuation. Patients achieving complete response (CR) could discontinue treatment if they had received at least 8 doses of pembrolizumab and were at least 2 cycles after documentation of CR. Patients with ≥grade 3 nonhematologic toxicities that fully resolved were permitted to continue pembrolizumab at a decreased dose of pembrolizumab 100 mg IV. Response assessments were performed using PET/CT imaging every 12 weeks for up to 2 years after the first dose of pembrolizumab. The 2007 revised response criteria for malignant lymphoma were used for response assessment by the treating investigator.28 To avoid premature therapy discontinuation because of pseudoprogression, subjects with radiologic progression without clinical evidence of progression were permitted to continue treatment at the treating investigator’s discretion until progression of disease was confirmed on subsequent imaging.
Tumor biopsies were performed, when feasible, before initiation of treatment with pembrolizumab and at end of treatment. Tumor from enrolled patients had PD-L1 immunohistochemistry performed on formalin-fixed paraffin-embedded sections on a Dako Automated Link 48 platform. Validation was performed on nondecalcified tissue using antibodies reactive with PD-L1 (clone22C3, Dako PharmDx Kit). The following antibodies were also used for immunohistochemistry on formalin-fixed paraffin-embedded tissue sections: CD3 (PA0122, clone LN10 Leica Microsystems), CD19 (CD19-163-L-CE, clone BT51E Leica), and PD1 (AB52587, clone NAT 105; Abcam).
Peripheral blood mononuclear cells (PBMCs) and serum were collected before initiation of pembrolizumab, 24 to 72 hours after first pembrolizumab infusion, weekly during weeks 1 to 6, before each pembrolizumab cycle, and at treatment conclusion. Supplemental Tables 1 and 2, available on the Blood Web site describe the exact timing of sample collection.
The primary end point was safety using a Bayesian monitoring rule to ensure that dose-limiting toxicity (DLT) was no greater than 30%. Stopping boundaries ensured trial termination if at any time there was at least a 97.5% chance that the DLT rate was greater than 30%. DLT was defined as grade 3 or higher nonhematologic toxicity leading to permanent pembrolizumab discontinuation or any grade 4 nonhematologic toxicity or cytokine release syndrome (CRS) at least possibly related to pembrolizumab. Toxicity was assessed using the Common Terminology Criteria for Adverse Events (CTCAE) version 4 and the Penn scale for CRS grading.29 Secondary end points included clinical outcomes (best overall response rate [ORR], 3-month ORR, progression-free survival [PFS], overall survival), and biologic correlative studies of T cells. CAR transgene DNA was quantitated by polymerase-chain reaction (PCR) assay as previously described.10 Kaplan Meier curves for PFS were constructed using Stata version 16.
Immune profiling
PBMCs from patients (31 samples from 12 patients) and 2 healthy donors were analyzed using mass cytometry by time of flight (CyTOF) as described.30 Briefly, we used CyTOF to simultaneously measure expression of 39 molecules related to immune cell lineage, differentiation state, and function. We included an anti-CAR antibody to phenotype previously infused CAR T cells before and after pembrolizumab treatment. Briefly, 3 × 10⁶ PBMCs were incubated with cisplatin for 1 minute and then stained with metal-labeled antibodies to surface proteins at room temperature for 30 minutes. After cell surface staining, cells were permeabilized using fixation/permeabilization solution (eBioscience, Thermo Fisher) at room temperature for 30 minutes, stained with metal-labeled antibodies to intracellular proteins at room temperature for 60 minutes, and washed in permeabilization buffer and fixed with phosphate-buffered saline–1.6% paraformaldehyde before acquisition by CyTOF. CAR T cells were identified using a human anti-CAR19 antibody (fully human immunoglobulin G1 (IgG1)-Leu-Ala-Leu-Ala, with λ light chain derived from phage display, species: human, isotype: IgG1 Leu-Ala-Leu-Ala Fc-silenced, clone name: NOV1220) conjugated to 163 Dy metal. Analyses were performed using FlowJo v10 (TreeStar), as well as R v3.5.1 and RStudio v1.1.383.
Results
Patient characteristics
From 1 June 2016 to 4 June 2018, 12 patients who previously received CAR T cells for relapsed/refractory B-cell lymphomas on 2 clinical trials (NCT02030834 and NCT02445248)2,8,16 were enrolled. Data are reported as of 31 December 2020. Full patient characteristics are detailed in Table 1. Eleven patients had DLBCL, and 1 patient had follicular lymphoma (FL), grade 1-2. DLBCL subtypes included 5 germinal center (3 double hit or triple hit), 4 non-germinal center, 1 T-cell/histiocyte-rich large B-cell lymphoma, and 1 transformed FL. Ten of 12 (83%) patients had biopsy-documented lymphoma after CAR T cells, and all patients had PET/CTs documenting measurable disease after CAR T cells with Deauville scores ≥4. Nine (75%) patients were refractory to CAR T-cell therapy, and 3 (25%) patients relapsed after responding to CAR T cells. For all patients, median PFS after CAR T cells was 2.8 months (range, 0.4-35.2 months); median time from CAR T-cell infusion to first pembrolizumab dose was 3.3 months (range, 0.4-42.8 months). For patients who were refractory to CAR T cells, median PFS after CAR T cells was 2.7 months (range, 0.4-4.5 months) and median time to first pembrolizumab dose was 3.2 months (range, 0.4-4.6 months). For patients who had relapsed after CAR T cells, median PFS after CAR T cells was 26.2 months (range, 19.0-35.2 months), and median time to first pembrolizumab dose was 27.1 months (range, 20.2-42.8 months). The median number of pembrolizumab doses received was 2 (range, 1-9). CD19 was detected by flow cytometry in 9 of 9 post-CAR T-cell biopsies performed before study treatment. Pretreatment biopsies from 7 of 9 patients studied had 5% or greater expression of PD-L1 by immunohistochemistry (Table 2).
Patient characteristics
| Characteristic | All patients, N=12 |
|---|---|
| Sex | 11 men, 1 woman |
| ECOG PS, median | 1 (range: 0-2) |
| Age, median | 58 y (range: 30-78 y) |
| Histology | 11 (92%) DLBCL |
| 5 (42%) GC* (2 “double hit,” 1 “triple hit”) | |
| 4 (33%) non-GC* | |
| 1 (8%) TRLBCL | |
| 1 (8%) tFL | |
| 1 (8%) FL | |
| Stage | 2 (17%) stage II |
| 10 (83%) stage IV | |
| LDH elevated | 11 (92%) |
| Prior therapies, median | 4 (range: 3-8) |
| Primary refractory† | 9 (75%) |
| Best response to CAR T cells | 9 PD, 3 CR |
| CAR T-cell PFS, median | 2.8 mo (range: 0.4-35.2) |
| Time between CAR T-cell infusion and first pembrolizumab dose | 3.3 mo (range: 0.4-42.8) |
| CD19 expression after CAR T-cell therapy | 9/9 (100%) |
| CAR construct | 8 (75%) murine anti-CD19, 4-1BB, CD3zeta |
| 4 (25%) humanized anti-CD19, 4-1BB, CD3zeta |
FL, follicular lymphoma, grade 1-2; GC, germinal center; DHL, double hit lymphoma; tFL, transformed follicular lymphoma; TRLBCL, T-cell rich large B-cell lymphoma.
Germinal center vs nongerminal center cell of origin determined by Hans algorithm.48
Primary refractory lymphoma is defined as PD or SD as best response after at least 4 cycles of first-line therapy. Patients must have received an anti-CD20 monoclonal antibody and anthracycline-containing regimen.
Tumor biopsies before and after pembrolizumab
| ID | Tumor CD19+ | Total | Tumor | TME | TIL | |||
|---|---|---|---|---|---|---|---|---|
| PD-L1+ (%) | PD-L1+ (%) | PD-L1+ (%) | Total PD-1+ (%) | Tumor PD-1+ (%) | T cells PD-1+ (%) | |||
| 01- pre | Positive | 20 | 20 | <1 | ND | ND | ND | Present |
| 04-pre | Positive | 10 | 10 | <1 | 5 | <1 | 5 | Present |
| 05-pre | Positive | 50 | <1 | 50 | 5 | <1 | 5 | Present |
| 05-post | ND | 40 | <1 | 40 | 10 | <1 | 10 | Present |
| 06-pre | Positive | 5 | 5 | <1 | <1 | <1 | <1 | Absent |
| 06-post | ND | 10 | 10 | <1 | <1 | <1 | <1 | Absent |
| 07-pre | Positive | 80 | 80 | <1 | 5 | <1 | 5 | Present |
| 07-post | Positive | 50 | 50 | <1 | 10 | <1 | 10 | Present |
| 10-pre | Positive | 5 | 5 | <1 | <1 | <1 | <1 | Absent |
| 11-pre | Positive | <1 | <1 | <1 | 5 | <1 | 5 | Present |
| 12-pre | Positive | <1 | <1 | <1 | 5 | <1 | 5 | Present |
| 13-pre | Positive | 10 | 10 | <1 | 10 | 5 | 5 | Present |
Patient 02 had cytology with immunohistochemistry confirming presence of lymphoma; however, the above was not performed.
ND, not performed; TIL, tumor infiltrating CD3+ T cells.
Ten of 12 patients did not receive any corticosteroids, and no patient received tocilizumab within close proximity of pembrolizumab (supplemental Table 3).
There were no differences in safety or efficacy outcomes after pembrolizumab between patients who received murine or humanized CAR T cells.
Safety
Pembrolizumab was generally well tolerated. Adverse events per patient at least possibly related to pembrolizumab are summarized in Table 3 and supplemental Table 3.
Adverse events at least possibly related to pembrolizumab
| Event | Patients with event, n (%) | |||||
|---|---|---|---|---|---|---|
| All grades, n (%) | Grade 1, n (%) | Grade 2, n (%) | Grade 3, n (%) | Grade 4, n (%) | Grade 5, n (%) | |
| Cytokine release syndrome | 1 (8) | 0 | 1 (8) | 0 | 0 | 0 |
| Infusion-related reaction | 1 (8) | 0 | 1 (8) | 0 | 0 | 0 |
| Fever | 3 (25) | 1 (8) | 2 (17) | 0 | 0 | 0 |
| Fatigue | 1 (8) | 1 (8) | 0 | 0 | 0 | 0 |
| Dehydration | 1 (8) | 0 | 1 (8) | 0 | 0 | 0 |
| Diarrhea | 1 (8) | 1 (8) | 0 | 0 | 0 | 0 |
| Nausea | 1 (8) | 0 | 1 (8) | 0 | 0 | 0 |
| Hematuria | 1 (8) | 1 (8) | 0 | 0 | 0 | 0 |
| Anemia | 1 (8) | 0 | 1 (8) | 0 | 0 | 0 |
| Lymphocyte count decreased | 2 (17) | 1 (8) | 0 | 1 (8) | 0 | 0 |
| Neutropenia | 4 (33) | 1 (8) | 0 | 0 | 3 (25) | 0 |
| Thrombocytopenia | 1 (8) | 1 (8) | 0 | 0 | 0 | 0 |
| Alkaline phosphatase elevated | 1 (8) | 0 | 1 (8) | 0 | 0 | 0 |
| ALT elevated | 2 (17) | 2 (17) | 0 | 0 | 0 | 0 |
| AST elevated | 2 (17) | 1 (8) | 1 (8) | 0 | 0 | 0 |
| Hyperbilirubinemia | 1 (8) | 0 | 0 | 1 (8) | 0 | 0 |
| Hypocalcemia | 1 (8) | 1 (8) | 0 | 0 | 0 | 0 |
| Synovitis | 1 (8) | 1 (8) | 0 | 0 | 0 | 0 |
| Pleural effusion | 1 (8) | 1 (8) | 0 | 0 | 0 | 0 |
With regard to potentially immune-mediated adverse events, neutropenia was the most common grade 3/4 adverse event (n = 3, 25%); this was transient and resolved with granulocyte colony-stimulating factor. Notably, those patients who developed neutropenia had recurrent episodes of neutropenia after pembrolizumab dosing. There were no episodes of febrile neutropenia. Three patients (25%) developed fever (grade 1-2) after the first infusion of pembrolizumab. One patient had a grade 2 infusion-related reaction, which occurred 10 minutes after completing the first pembrolizumab infusion and 96 days after CAR T-cell infusion. The same patient later developed grade 2 CRS 1 day after first pembrolizumab infusion and was managed with supportive care. Finally, transaminitis (n = 2, 17%), synovitis (n = 1; 8%), hematuria (n = 1; 8%), and pleural effusion (n = 1; 8%) were also observed, with resolution after holding pembrolizumab.
Two (17%) patients had low-grade fatigue. One patient with hyperbilirubinemia (possibly related; grade 3) was later found to have cytomegalovirus (CMV) infection (unrelated; grade 4), resulting in discontinuation of protocol therapy.
Efficacy
Twelve patients were evaluable for response. Best ORR after pembrolizumab was 25% (1 CR; 2 partial responses [PR]; Figure 1). Three-month ORR was also 25% (1 CR, 2 PR). Three-month clinical benefit was 33% (1 CR, 2 PR, 1 stable disease [SD]). The patient with FL did not respond to pembrolizumab. We did not observe a difference in ORR or PFS based on prior response to CAR T cells (ie, refractory or relapsed; log-rank, P = .85) or based on pre–CAR T-cell therapy variables such as age, lactate dehydrogenase (LDH) elevation, Eastern Cooperative Oncology Group (ECOG) performance score, number of prior therapies, or absolute lymphocyte counts. Two of 9 (22%) patients who were refractory to CAR T cells responded to pembrolizumab, whereas 1 of 3 (33%) patients who relapsed after CAR T cells responded to pembrolizumab. The number of prior therapies did not differ between responders and nonresponders (median of 4 prior therapies for both) to pembrolizumab after CAR T cells. Eight patients had progressive disease (PD) while on pembrolizumab. Pseudoprogression occurred in 1 instance. One patient developed tumor enlargement within 2 months of first pembrolizumab dose, but a biopsy confirmed this was predominantly comprised of T cells. He continued on treatment and achieved a PR. All responses occurred within 1 to 3 months of initiation of pembrolizumab (Figure 1). One patient with germinal center DLBCL who stopped pembrolizumab after 9 cycles because of personal preference continues in CR for over 4 years.
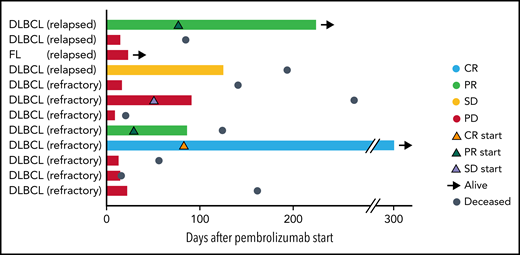
Swimmer plot depicting clinical outcomes after pembrolizumab. Bars are color coded based on 3-month response. Best ORR and 3-month ORR was 3 of 12 (25%). One patient had a CR (light blue bar), and 2 patients had PRs (light green bars). Two patients had SD with symptomatic improvement as best response, but only 1 of these patients continued to maintain SD at 3 months (yellow bar) and the other patient had PD at 3 months (red bar). The remaining 7 patients had progression of lymphoma (red bars). Orange triangles, onset of CR; green triangles, onset of PR; lavender triangles, onset of SD; black arrows, patient is alive at last follow-up; steel blue circles, patient is deceased. Response to CAR T cells (eg, relapsed or refractory) is indicated after patient ID number.
Swimmer plot depicting clinical outcomes after pembrolizumab. Bars are color coded based on 3-month response. Best ORR and 3-month ORR was 3 of 12 (25%). One patient had a CR (light blue bar), and 2 patients had PRs (light green bars). Two patients had SD with symptomatic improvement as best response, but only 1 of these patients continued to maintain SD at 3 months (yellow bar) and the other patient had PD at 3 months (red bar). The remaining 7 patients had progression of lymphoma (red bars). Orange triangles, onset of CR; green triangles, onset of PR; lavender triangles, onset of SD; black arrows, patient is alive at last follow-up; steel blue circles, patient is deceased. Response to CAR T cells (eg, relapsed or refractory) is indicated after patient ID number.
For responding patients, 1 patient with T-cell/histiocyte-rich large B-cell lymphoma with a PR was withdrawn from study because of CMV infection, another patient with a PR was elderly and not a candidate for curative intent therapy such as allogenic stem cell transplantation, and the patient in CR declined further lymphoma treatment once CR was achieved.
All responding patients had biopsies with CD3+ tumor-infiltrating lymphocytes present and between 10% and 50% total PD-L1 expression (Table 2). One of 4 patients with clinical benefit had tumor PD-1 expression of 5% (Table 2). There were no statistically significant differences between responders and nonresponders and those with and without clinical benefit.
Effects of pembrolizumab on anti-CD19 CAR T cells
Ten of 12 patients had re-expansion of CAR T cells in peripheral blood after receiving pembrolizumab, measured by CAR19 transgene copy number (Figure 2A; supplemental Table 4). Median peak CAR T-cell expansion occurred at day 3 after the first dose of pembrolizumab (range, 2-13). Maximum CAR transgene copy number during therapy was not associated with response (supplemental Table 4); however, 3 of 3 patients with clinical benefit who were tested had more than 1 CAR T-cell re-expansion peak during successive pembrolizumab doses, whereas all 8 nonresponding patients had only a single re-expansion peak following the first dose of pembrolizumab with no further expansion during subsequent doses. CAR T-cell re-expansion peaks observed in patients with clinical benefit did not temporally correlate with doses of pembrolizumab; both those patients with multiple CAR T-cell expansion peaks and those with a single CAR T-cell expansion peak had consistently detectable levels of pembrolizumab from start of therapy, as expected given the 26-day half-life of pembrolizumab.
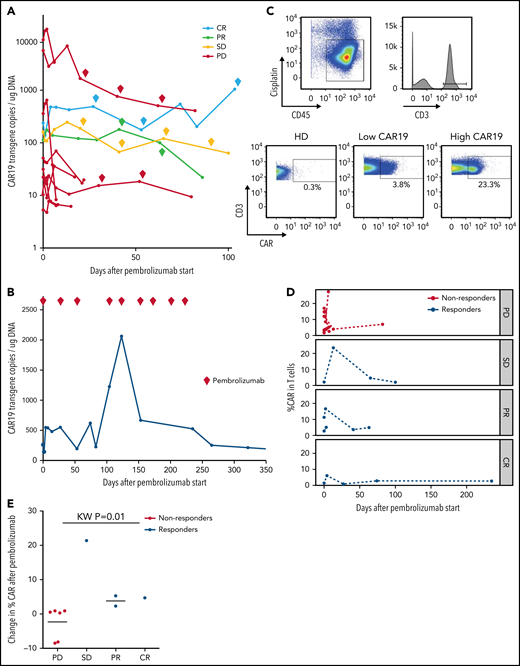
Changes in CAR19 copy number and percentage of CAR T cells after pembrolizumab. (A) CAR19 transgene copies/ug DNA for each patient after administration of pembrolizumab (n = 11). Pembrolizumab was started at day 0. Each diamond indicates a subsequent dose of pembrolizumab. Data are classified based on 3-month ORR. One patient with a PR did not have longitudinal data for CAR19 transgene copies available. (B) CAR19 transgene copies per μg DNA for patient 4, who had a complete response to pembrolizumab. (C) Gating strategy for identifying CAR T cells. Live cells were identified as CD45+Cisplatin−. T cells are gated as CD3+ live cells. CAR T cells are identified using a CAR19 antibody and gating the CAR T cells as CAR19+CD3+ live cells. (D) Percentage of CAR T cells among total T cells as a function of days from pembrolizumab infusion, separated by clinical response (n = 11). Patients with progressive lymphoma after pembrolizumab are indicated in red (“nonresponders,” which includes PD). Patients with clinical benefit after pembrolizumab are indicated in blue (“responders,” which includes SD, PR, and CR). (E) Cumulative dot plot showing the change (difference) in CAR T-cell percentage between the first measurement after pembrolizumab and pre-pembrolizumab baseline in patients with PD, SD, PR, and CR (n = 10).
Changes in CAR19 copy number and percentage of CAR T cells after pembrolizumab. (A) CAR19 transgene copies/ug DNA for each patient after administration of pembrolizumab (n = 11). Pembrolizumab was started at day 0. Each diamond indicates a subsequent dose of pembrolizumab. Data are classified based on 3-month ORR. One patient with a PR did not have longitudinal data for CAR19 transgene copies available. (B) CAR19 transgene copies per μg DNA for patient 4, who had a complete response to pembrolizumab. (C) Gating strategy for identifying CAR T cells. Live cells were identified as CD45+Cisplatin−. T cells are gated as CD3+ live cells. CAR T cells are identified using a CAR19 antibody and gating the CAR T cells as CAR19+CD3+ live cells. (D) Percentage of CAR T cells among total T cells as a function of days from pembrolizumab infusion, separated by clinical response (n = 11). Patients with progressive lymphoma after pembrolizumab are indicated in red (“nonresponders,” which includes PD). Patients with clinical benefit after pembrolizumab are indicated in blue (“responders,” which includes SD, PR, and CR). (E) Cumulative dot plot showing the change (difference) in CAR T-cell percentage between the first measurement after pembrolizumab and pre-pembrolizumab baseline in patients with PD, SD, PR, and CR (n = 10).
The patient who achieved CR had a course notable for multiple episodes of CAR T-cell re-expansion (Figure 2B). His highest peak CAR transgene copy number occurred on day 123 after 4 cycles of pembrolizumab with a 628% increase in transgene copy number from his pre-pembrolizumab baseline level. Throughout the duration of pembrolizumab exposure, this patient had persistently high numbers of CAR T cells in the range of, or greater than, levels usually observed in patients after CAR T-cell infusion without pembrolizumab. After completing 9 cycles of pembrolizumab, CAR19 transgene copy number declined to undetectable levels over several months after discontinuing pembrolizumab.
To evaluate correlates of clinical response and to identify potential biomarkers of efficacy for pembrolizumab therapy after CAR T cells, we examined patients’ PBMCs collected at baseline and at peak CAR T-cell expansion using high-dimensional cytometry.30 Using this approach, we successfully detected CAR T cells in 11 of 11 available patients’ blood samples, whereas CAR T-cell staining was not observed in control healthy donors as expected (Figure 2C). This approach allowed tracking of CAR T cells over the course of pembrolizumab therapy. In general, the frequency of CAR T cells varied during the course of therapy (Figure 2D). However, there was a trend in patients with clinical benefit to have an increase in the proportion of CAR T cells detected by CyTOF after initiation of pembrolizumab (Figure 2E); 3 of these 4 patients with clinical benefit also had an increase in CAR transgene levels by quantitative PCR. In contrast, the proportion of CAR T cells in nonresponders remained stable or decreased slightly after pembrolizumab treatment (Figure 2E).
Immune profiling reveals increased CAR T-cell activation and proliferation in clinical responders
We also examined the differentiation state of both CAR T cells and non–CAR T-cell CD3+ cells in these patients. Using the anti-CAR antibody to distinguish CAR and non–CAR T-cell subsets in circulation, there were no significant differences in proportions of major T-cell differentiation subsets (as defined by patterns of expression of CD45RA and CD27) between responders and nonresponders (threshold for significance: P < .05). Moreover, the percentage of CAR T cells that coexpressed PD-1 and CD39, putative markers of exhaustion, did not correlate with clinical or patient parameters such as age, LDH elevation, ECOG performance score, number of prior therapies, or absolute lymphocyte counts (data not shown). We used Phenograph to further distill the high dimensional CyTOF data into clusters of cells representing discrete differentiation or activation states. As expected, CAR T cells and non–CAR T cells had distinct differentiation profiles, with 29 clusters that were significantly different between these cell types (Figure 3A-B). In particular, clusters expressing markers consistent with T-cell exhaustion such as CD39, PD-1, Ki67, CD38, TIGIT, CD27, EOMES, and TOX were overrepresented in the CAR T-cell populations compared with non–CAR T cells (clusters 15 and 24; Figure 3C). We next examined whether features of CAR T cells could distinguish clinical responders and nonresponders and compared pooled available samples from responders and nonresponders. Six clusters of CAR T cells were identified that significantly differed between responders and nonresponders (clusters 5, 6, 10, 11, 25, and 27; Figure 3D-E). In clusters that were increased in responding patients, CAR T cells expressed high levels of CD26, CD127, CD69, T-bet, and CXCR5, as well as some inhibitory receptors (LAG-3, Tim-3, CTLA-4), but low levels of other markers of T-cell exhaustion and/or terminal differentiation such as Granzyme K, TOX, EOMES, and CD39. The clusters associated with clinical response contained predominantly CD8+ T cells, although one (cluster 27) contained both CD4+ and CD8+ T cells (Figure 3E). In contrast, of the 3 clusters most enriched in nonresponders, 2 were mainly CD4+ and expressed markers of exhaustion and/or terminal differentiation (eg, TOX, CD57, TIGIT, EOMES), whereas 1 cluster was CD8+ and had moderate expression of exhaustion makers (Figure 3E). In addition to responders and nonresponders, we also compared patients who were relapsed vs refractory to CAR T-cell therapy and found some overlap with the previous analysis, with 2 of the above clusters (cluster 5, estimate 8.1, P = .04; cluster 11, estimate 1.1, P = .01; composition displayed in Figure 3E) that were also increased in patients who had relapsed. These observations suggested a slightly lower level of exhaustion in the patients who relapsed but will require validation in a larger cohort to allow definitive conclusions.
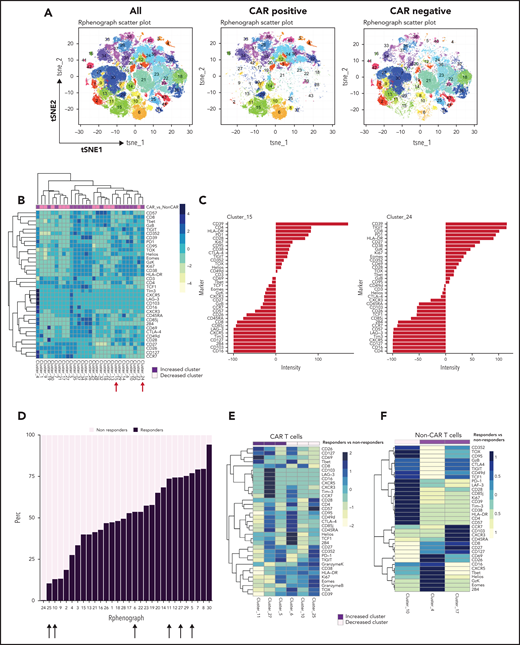
Immune profiling of CAR T cells and non–CAR T cells in peripheral blood. (A) t-SNE plots of all T cells, CAR T cells, and non–CAR T cells using phenograph analysis. (B) Heatmap showing the composition of the 29 clusters of T cells most different in proportions in CAR T cells compared with non–CAR T cells. Arrows indicate clusters significantly different. Each cluster is a column. Clusters increased in CAR T cells are topped by a purple bar. Clusters decreased in CAR T cells are topped by a pink bar. (C) Composition of cluster 15 and 24 T cells after marker normalization. (D) Stacked bar plot of relative contribution of each group in each cluster (x-axis) vs fraction of cells in that cluster from each group (y-axis). All the CD3 T cells from all patients within a group were combined, and the percentage of total cells contributed to each cluster by each group was calculated and displayed on the y-axis (ie, 50% of cells in cluster X are from the nonresponders group; sum of contributions from the 2 groups for each cluster equals 100%, and each group is displayed in a different color). The clusters (listed on the x-axis) were ordered by relative abundance of responders CD3 T cells. Arrows highlight key clusters that are significantly different (further shown in panel B). (E) Heatmap showing the composition of the 6 clusters of CAR T cells significantly different in proportions in responders compared with nonresponders. Each cluster is a column. Clusters increased in responders are topped by a purple bar. Clusters decreased in responders are topped by a pink bar. (F) Heatmap showing the composition of the 3 clusters of non–CAR T cells significantly different in proportions in responders compared with nonresponders. Patients with clinical benefit (CR, PR, SD) at 3 months are grouped as responders, and patients with PD at 3 months are grouped as nonresponders (n = 11).
Immune profiling of CAR T cells and non–CAR T cells in peripheral blood. (A) t-SNE plots of all T cells, CAR T cells, and non–CAR T cells using phenograph analysis. (B) Heatmap showing the composition of the 29 clusters of T cells most different in proportions in CAR T cells compared with non–CAR T cells. Arrows indicate clusters significantly different. Each cluster is a column. Clusters increased in CAR T cells are topped by a purple bar. Clusters decreased in CAR T cells are topped by a pink bar. (C) Composition of cluster 15 and 24 T cells after marker normalization. (D) Stacked bar plot of relative contribution of each group in each cluster (x-axis) vs fraction of cells in that cluster from each group (y-axis). All the CD3 T cells from all patients within a group were combined, and the percentage of total cells contributed to each cluster by each group was calculated and displayed on the y-axis (ie, 50% of cells in cluster X are from the nonresponders group; sum of contributions from the 2 groups for each cluster equals 100%, and each group is displayed in a different color). The clusters (listed on the x-axis) were ordered by relative abundance of responders CD3 T cells. Arrows highlight key clusters that are significantly different (further shown in panel B). (E) Heatmap showing the composition of the 6 clusters of CAR T cells significantly different in proportions in responders compared with nonresponders. Each cluster is a column. Clusters increased in responders are topped by a purple bar. Clusters decreased in responders are topped by a pink bar. (F) Heatmap showing the composition of the 3 clusters of non–CAR T cells significantly different in proportions in responders compared with nonresponders. Patients with clinical benefit (CR, PR, SD) at 3 months are grouped as responders, and patients with PD at 3 months are grouped as nonresponders (n = 11).
To assess changes occurring between baseline and during pembrolizumab therapy, we also compared baseline samples and posttreatment samples in responders and nonresponders (Figure 4A-B). We identified 1 cluster (cluster 17) that increased after pembrolizumab in responders only (P = .06; Figure 4B). This cluster was defined by expression of CD127, CD27, TCF1, and low or moderate expression of exhaustion markers such as PD-1, TOX, and Granzyme K (Figure 4C).
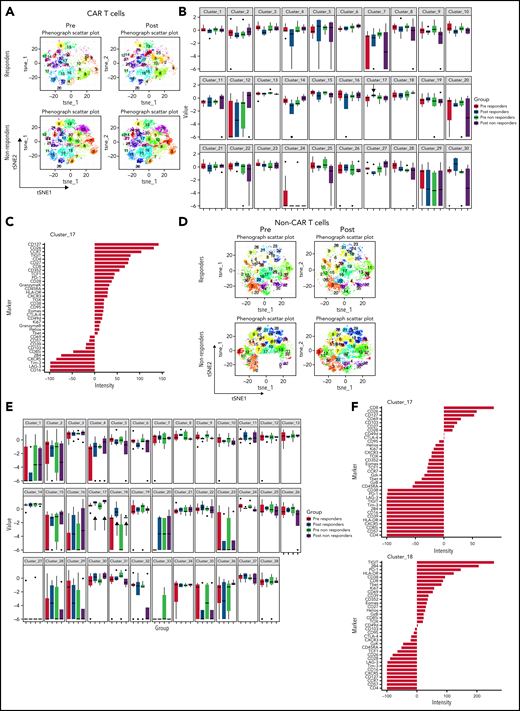
CAR T cells and non–CAR T cells in samples from baseline and after pembrolizumab, analyzed separately. (A) t-SNE plots of CAR T cells in responders and nonresponders, before and after pembrolizumab therapy, using phenograph analysis. (B) Boxplot showing frequencies of each of the defined clusters in panel A. (C) Composition of cluster 17 CAR T cells after marker normalization. (D) t-SNE plots of non–CAR T cells in responders and nonresponders, before and after pembrolizumab therapy, using Phenograph analysis. (E) Boxplot showing frequencies of each of the defined clusters in panel D. (C) Composition of cluster 17 and 18 non–CAR T cells after marker normalization. Patients with clinical benefit at 3 months are grouped as responders, and patients with PD at 3 months are grouped as nonresponders.
CAR T cells and non–CAR T cells in samples from baseline and after pembrolizumab, analyzed separately. (A) t-SNE plots of CAR T cells in responders and nonresponders, before and after pembrolizumab therapy, using phenograph analysis. (B) Boxplot showing frequencies of each of the defined clusters in panel A. (C) Composition of cluster 17 CAR T cells after marker normalization. (D) t-SNE plots of non–CAR T cells in responders and nonresponders, before and after pembrolizumab therapy, using Phenograph analysis. (E) Boxplot showing frequencies of each of the defined clusters in panel D. (C) Composition of cluster 17 and 18 non–CAR T cells after marker normalization. Patients with clinical benefit at 3 months are grouped as responders, and patients with PD at 3 months are grouped as nonresponders.
Finally, we examined the features of non–CAR T cells in clinical responders and nonresponding patients. Three clusters of non–CAR T cells were identified that significantly differed between responding and nonresponding patients (clusters 4, 10, and 17; Figure 3F). Clusters that were increased in responders (clusters 4 and 17) contained CD8+ T cells expressing high levels of CD26, CD127, CD69, T-bet, CXCR5, and some inhibitory receptors, but low expression of other markers of T-cell exhaustion such as TOX, PD-1, and CD39. In contrast, a cluster increased in nonresponders (cluster 10) expressed markers of T-cell exhaustion (eg, TOX, CD39, TIGIT, EOMES; Figure 3F). When analyzing samples from baseline and posttreatment separately (Figure 4D), we identified 2 CD8+ T-cell clusters (clusters 17 and 18) that increased after pembrolizumab in non–CAR T cells of both responders and nonresponders (P = .06 and .02 for cluster 17 and P = .03 and .04 for cluster 18 for responders and nonresponders, respectively; Figure 4D-F). These clusters were defined by activation and differentiation markers such as CD127, CD69, and HLA-DR expressed by CD8 T cells, as well as moderate expression of exhaustion markers such as PD-1 and TIGIT.
Together, our analyses indicate increased CAR T-cell activation and proliferation with decreased markers of exhaustion after pembrolizumab in patients responding to pembrolizumab after CAR T-cell therapy, as well as potential differences in non–CAR T cells in patients who responded or did not respond to pembrolizumab.
Discussion
In this trial, pembrolizumab was administered to B-cell lymphoma patients refractory to CAR T cells and patients with late relapses after an initial response to CAR T cells. Thus, this study provides insight into the safety of pembrolizumab after CAR T-cell infusion, preliminary evidence of efficacy, and insight into the timing and ability of pembrolizumab to stimulate CAR T cells.
We observed that pembrolizumab is safe and well tolerated when administered as early as 0.4 months after CAR T-cell infusion. The immune-mediated adverse events observed were grade 1 to 2 events that were manageable with drug hold until resolution. It is notable that we did not observe any of the serious autoimmune events that have previously been reported with pembrolizumab,31-36 perhaps because of the heavily pretreated, immunosuppressed nature of these patients or because of the limited time on treatment of two-thirds of the patients with highly aggressive, progressive DLBCL that did not respond to pembrolizumab. Although 1 case series of pembrolizumab after CAR T cells reported several autoimmune complications,33 our findings are generally more consistent with early reports of CAR T cells combined with checkpoint inhibition for lymphoma,37 other large trials of single-agent pembrolizumab for primary mediastinal large B-cell lymphoma and single-agent nivolumab for relapsed/refractory DLBCL,31,32 which both reported that neutropenia was the most common grade 3 to 4 toxicity and found a high incidence of fatigue. The infusion-related reaction and CRS we observed are less typical for pembrolizumab and may have alternatively been related to the presence of CAR T cells. The increased incidence of fever after pembrolizumab in this study may have also represented low-grade CRS.
We also observed that pembrolizumab after anti-CD19 directed CAR T-cell therapy resulted in clinical responses in a subset of patients with progressive B-cell lymphomas. This study supports earlier case reports of efficacy of checkpoint blockade after CAR T-cell failure in DLBCL.22,23,33 The efficacy of immune checkpoint blockade in relapsed/refractory DLBCL is poor; nivolumab monotherapy administered in this setting achieved 3% ORR for autologous stem cell transplant-ineligible patients and a 10% ORR for patients relapsed or refractory after autologous stem cell transplant.31,38 Similarly, response rates in retrospective reviews of immune checkpoint blockade for primarily DLBCL and FL report an 8.5% ORR.39 Although it is not feasible to make direct cross-study comparisons, the activity of pembrolizumab that we observed may be because of a relative increase in CAR T cells in responding patients. In particular, it is notable that 2 of 3 responding patients and 3 of 4 patients with clinical benefit were refractory to CAR T cells. Additionally, as with a clinical trial of front-line pembrolizumab with rituximab, cyclophosphamide, doxorubicin, vincristine, and prednisone, we found that all patients who responded to pembrolizumab had tumor expression of at least 5% PD-L1, although tumor expression of PD-L1 did not significantly differ between those who did and did not express PD-L1.36
Analysis of the pharmacokinetics of CAR T cells in patients treated with pembrolizumab appears to identify responding patients and supports the hypothesis that, in some patients, CAR T cells expand after PD1 blockade. A greater increase in CAR T cells numbers was observed when pembrolizumab administration was closer in proximity to CAR T-cell infusion. After pembrolizumab, responders tended to have an increase in the percentage of T cells that were CAR T cells compared with nonresponders. In addition, we noted that responders had more than one wave of CAR T-cell expansion after starting pembrolizumab, whereas nonresponders only had a single episode of CAR T-cell expansion or no CAR T-cell expansion at all.
Deep immune profiling of patients using CyTOF confirmed long-term persistence of CAR T cells in patients with lymphoma; these cells could be detected in all patients examined at a median of 4 months and up to 3.5 years after CAR T-cell therapy. CAR T cells at baseline displayed features of T-cell exhaustion, and further treatment with pembrolizumab led to an expansion of CAR T cells with increased activation and proliferation of these cells. These observations highlight the potential of immune checkpoint blockade to reinvigorate exhausted CAR T cells in lymphoma patients who failed to respond to CAR T cell therapy because of exhaustion or CAR T-cell poor response. Overall, CAR T cells appear less exhausted in pembrolizumab responders compared with nonresponders. This low degree of T-cell exhaustion is likely more easily improved by PD-1 blockade, which may explain a lower threshold for activation of the cells after PD-1 blockade and subsequent higher proliferation. It has been observed that pembrolizumab can both stimulate expansion of T-cell clones already present and stimulate expansion of new T-cell clones in patients with lymphoma.22 Interestingly, the activation and proliferation induced by immune checkpoint blockade affected both the CAR T-cell and non–CAR T-cell compartments. Some of these non–CAR T cells activated by pembrolizumab may be tumor specific, responding to tumor antigens. However, other cells activated by blocking the PD-1 pathway may be bystander cells, encompassing T cells of other specificities. Although some previous studies show minimal activation of CMV-specific T cells in patients with melanoma receiving PD-1 blockade,40 it is possible that in other settings, T cells specific for CMV or other persisting viruses such as Epstein-Barr virus could be activated by anti–PD-1 treatment. Future studies will be necessary to evaluate the potential on-tumor or bystander nature of these responses in CAR T-cell patients receiving checkpoint blockade. Nevertheless, these immune profiling results indicate biological activity of pembrolizumab on CAR T cells persisting in patients with relapsed or refractory lymphoma, as well as the potential for signatures of T-cell exhaustion in CAR T cells at baseline to be used as a negative biomarker of response to immune checkpoint blockade.
Our findings in patients receiving pembrolizumab are substantiated by other studies of patients with lymphoma with progression of disease after CAR T cells.41 Nonresponding patients after CAR T-cell therapy had increased CD8 T cells with an exhausted phenotype in both CAR T-cell products and tumor biopsies obtained after CAR T-cell therapy. Additionally, patients with lymphoma with CR 3 months after CAR T cells had higher numbers of CD8+ T cells with memory phenotypes in CAR T-cell infusion products than their nonresponder counterparts.41
In addition to immune checkpoint blockade, approaches to increase the effectiveness of CAR T cells for B-cell lymphomas also include targeted therapy with Bruton tyrosine kinase inhibitors42-45 and bispecific antibody therapy in conjunction with CAR T cells.46 We await the results of ongoing multicenter CAR T-cell/immune checkpoint blockade studies, including the PORTIA (tisagenlecleucel/pembrolizumab, NCT03630159), ZUMA-6 (axicabtagene ciloleucel/atezolizumab),47 and PLATFORM studies (lisocabtagene maraleucel/relatlimab/nivolumab, NCT03310619), which may help to elucidate whether variables such as the underlying CAR T-cell costimulatory domain and whether targeting PD-1 vs PD-L1 affects clinical responses to CAR T cells. The optimal approach to patients relapsed/refractory after CAR T-cell failure also remains under investigation.
Although patient numbers are small, these data suggest potential differences in the biology of CAR T cells or in the overall immune landscape of responders and nonresponders that influence the clinical efficacy of PD-1 blockade administered in this setting. Future work aimed at improving immune health after CAR T-cell infusion and work aimed at decreasing CD8+ CAR T-cell exhaustion in CAR T-cell products may serve as potential platforms for enhancing the efficacy of immune checkpoint blockade in patients treated with CAR T cells.
Acknowledgments
The authors thank all patients and blood donors, their families and surrogates, and the clinical research team, including Ellen Napier, Tanya Latorre, Kristy Walsh, Emeline Chong, Nicole Winchell, and medical personnel who managed patient care; Irina Kulikovskaya, Minnal Gupta, and Rachel Reynolds for PCR analyses; and Vanessa Gonzalez and Mohsin Mahir for PCR data management.
E.A.C. was supported by the National Institutes of Health (NIH) under Ruth L. Kirschstein National Research Service award T32CA009615 from the National Cancer Institute and the Lymphoma Research Foundation under a postdoctoral fellowship grant. E.A.C. was also supported by the Stefan and Elizabeth Brodie Fund for Lymphoma Research at the University of Pennsylvania. M.R. was supported by the Lymphoma Research Foundation Career Development Awasr, Gilead Research Scholar award, Gabrielle’s Angel Foundation, Emerson Collective award, Laffey-McHugh Foundation, Parker Institute for Cancer Immunotherapy, and NIH, National Cancer Institute grants 1K99CA212302 and R00CA212302. E.J.W. was supported by NIH grants AI155577, AI082630, AI117950 (National Institute of Allergy and Infectious Diseases), and CA210944 (National Cancer Institute). E.J.W., C.A., and M.R. were also supported by the Parker Institute for Cancer Immunotherapy, which supports the cancer immunology program at the University of Pennsylvania. S.J.S. and M.R. were also supported by the Berman and Maguire Funds for Lymphoma Research at the University of Pennsylvania.
Authorship
Contribution: E.A.C., C.A., E.J.W., and S.J.S. designed the research; E.A.C. collected data; E.A.C., C.A., J.S., S.D.N., D.J.L., S.F.L. M.R., S.B., and S.J.S. performed the research; E.A.C. and C.A. performed statistical analyses; E.A.C., C.A., E.J.W., and S.J.S. analyzed and interpreted the data; E.A.C. and C.A. wrote the manuscript; and all authors had access to the primary data and participated in editing the manuscript.
Conflict-of-interest disclosure: E.A.C. is on the advisory board for Novartis, KITE, and BMS. J.S. reports consultancy for Genmab, Adaptive, Astra-Zeneca, BMS, Imbrium, ADCT, Atara, Pharmacyclics, and Seattle Genetics and research funding from Astra-Zeneca, BMS, Incyte, Merck, Seattle Genetics, Pharmacyclics, and TG Therapeutics. S.D.N. is on the advisory board for Morphosys and has membership on a data and safety monitoring board (DSMB) for Merck. D.J.L. is on the advisory board for Morphosys, Karyopharm, and Celgene, receives research funding from Takeda, Curis, and Triphase, and is a DSMB member for Morphosys. S.F.L. has intellectual property related to CTL019 assigned by the University of Pennsylvania to Novartis; has received research funding from Novartis, Tmunity, Cabaletta Bio, and Carisma; and has received consulting fees from Gilead/KITE. S.B. reports research funding from Scopio Labs Ltd. M.R. holds patents related to CD19 CAR T cells; has served as a consultant for nanoString, BMS, GSK, Bayer, and AbClon; and receives research funding from AbClon, nanoString, and Beckam Coulter. E.J.W. has consulting agreements with and/or is on the scientific advisory board for Merck, Marengo, Janssen, Related Sciences, Rubius Therapeutics, Pluto Immunotherapeutics, Synthekine, and Surface Oncology. E.J.W. is a founder of Surface Oncology, Danger Bio and Arsenal Biosciences and has a patent licensing agreement on the PD-1 pathway with Roche/Genentech. S.J.S. reports research funding from Acerta, Celgene, Genentech/Roche, Merck, Novartis, Pharmacyclics, and T.G. Therapeutics and honoraria/consulting fees from Acerta, AstraZeneca, Celgene, Incyte, Janssen, Loxo Oncology, Morphosys, and Nordic Nanovector. S.J.S. is a steering committee member for Celgene, Nordic Nanovector, and Novartis and has a patent for combination therapies of CAR T cells and PD-1 inhibitors.
Correspondence: Elise A. Chong, 3400 Civic Center Blvd, Perelman Center for Advanced Medicine, South Pavilion Ext, 12th Floor, Rm 12-143, Philadelphia, PA 19104; e-mail: elise.chong@pennmedicine.upenn.edu.
Deidentified individual participant data may be requested by e-mailing the corresponding author. The study protocol is included in the Supplemental Materials. R scripts and other resources are available online at https://github.com/wherrylab/Cytof_analysis_calanio.
The online version of this article contains a data supplement.
There is a Blood Commentary on this article in this issue.
The publication costs of this article were defrayed in part by page charge payment. Therefore, and solely to indicate this fact, this article is hereby marked “advertisement” in accordance with 18 USC section 1734.

This feature is available to Subscribers Only
Sign In or Create an Account Close Modal