Abstract
Diffuse large B-cell lymphoma (DLBCL) can be divided into prognostically important subgroups with germinal center B-cell–like (GCB), activated B-cell–like (ABC), and type 3 gene expression profiles using a cDNA microarray. Tissue microarray (TMA) blocks were created from 152 cases of DLBCL, 142 of which had been successfully evaluated by cDNA microarray (75 GCB, 41 ABC, and 26 type 3). Sections were stained with antibodies to CD10, bcl-6, MUM1, FOXP1, cyclin D2, and bcl-2. Expression of bcl-6 (P < .001) or CD10 (P = .019) was associated with better overall survival (OS), whereas expression of MUM1 (P = .009) or cyclin D2 (P < .001) was associated with worse OS. Cases were subclassified using CD10, bcl-6, and MUM1 expression, and 64 cases (42%) were considered GCB and 88 cases (58%) non-GCB. The 5-year OS for the GCB group was 76% compared with only 34% for the non-GCB group (P < .001), which is similar to that reported using the cDNA microarray. Bcl-2 and cyclin D2 were adverse predictors in the non-GCB group. In multivariate analysis, a high International Prognostic Index score (3-5) and the non-GCB phenotype were independent adverse predictors (P < .0001). In summary, immunostains can be used to determine the GCB and non-GCB subtypes of DLBCL and predict survival similar to the cDNA microarray.
Introduction
Diffuse large B-cell lymphoma (DLBCL) is the most common type of non-Hodgkin lymphoma and accounts for 30% to 40% of new diagnoses.1,2 However, DLBCL is heterogeneous both clinically and morphologically. Despite the use of anthracycline-based chemotherapy, durable remissions are achieved in only 40% to 50% of patients.2 Therefore, it is important to identify at diagnosis those patients who may benefit from more aggressive or experimental therapies.
Currently, the prognosis of patients with DLBCL is estimated using the clinical parameters of the International Prognostic Index (IPI).3 However, these clinical parameters reflect a mixture of underlying biologic or genetic differences. In an attempt to elucidate these underlying factors, the prognostic value of numerous individual proteins has been studied by immunoperoxidase and molecular techniques.4-34 However, these studies have yielded conflicting results, and none have been validated in a large prospective trial. Therefore, in contrast to the IPI, these individual markers are generally not used in clinical practice for selecting therapy or predicting prognosis.
Using a cDNA microarray, DLBCL can be divided into prognostically significant subgroups with germinal center B-cell–like (GCB), activated B-cell–like (ABC), or type 3 gene expression profiles.35,36 The GCB group has a significantly better survival than the ABC group. The type 3 group is heterogeneous and not well defined, but has a poor outcome similar to the ABC group. Another study using an oligonucleotide array has demonstrated that DLBCL can be divided into 2 molecularly distinct populations (cured and fatal/refractory).37 Because this technology is expensive and not generally available, a simpler, more widely available method to subclassify DLBCL into molecularly distinct and prognostically significant groups using immunohistochemistry would have wide applicability and practical utility in routine clinical practice.
A few studies have used the immunohistochemical expression of CD10, bcl-6, or MUM1 to classify cases of DLBCL into GCB and non-GCB groups.29,31,32,38 However, the resulting data are conflicting, with 2 studies showing a significantly better survival for the GCB group,29,38 whereas 2 others have found no difference in survival between the GCB and non-GCB groups.31,32 None of these studies had cDNA microarray gene expression data to correlate with their immunohistochemical findings.
All of the cases included in our study were previously evaluated by cDNA microarray technology.35,36 The goal of this study was to evaluate the use of immunoperoxidase staining for predictive markers to accurately subdivide DLBCL into these prognostically relevant subgroups using the cDNA microarray results as a gold standard.
Patients and methods
We studied 152 patients with de novo DLBCL obtained from the Nebraska Lymphoma Study Group Registry (49 cases), British Columbia Cancer Center (30 cases), University of Würzburg (29 cases), Norwegian Radium Hospital (29 cases), University of Barcelona (8 cases), and the Southwest Oncology Group (7 cases). Of these, 142 cases were previously analyzed and classified using the Lymphochip cDNA microarray (75 GCB, 41 ABC, and 26 type 3),35,36 whereas 10 cases (6.6%) failed that analysis or the cDNA results were inconclusive. Each of the patients received an anthracycline-containing chemotherapy regimen. Approval was obtained from the University of Nebraska Medical Center institutional review board for these studies. Informed consent was provided according to the Declaration of Helsinki.
For the tissue microarray (TMA), hematoxylin and eosin–stained sections from each paraffin-embedded, formalin-fixed block were used to define diagnostic areas, and 2 to 5 (average, 4) random, representative 0.6-mm cores were obtained from each case and inserted in a grid pattern into a recipient paraffin block using a tissue arrayer (Beecher Instruments, Silver Spring, MD). Sections (5 μm) were then cut from each TMA and stained with antibodies to CD20, CD10, bcl-6, MUM1, bcl-2, cyclin D2, and FOXP1 (Table 1). The antibodies selected recognize molecules whose mRNA expression was highly associated with the GCB or non-GCB groups in cDNA microarray studies,35,36 and are reactive in formalin-fixed, paraffin-embedded tissue. Following deparaffinization, heat-induced antigen retrieval techniques were used for each antibody. A rabbit antimouse amplification kit (Ventana Medical Systems, Tucson, AZ) was used to enhance staining for CD10 and FOXP1, whereas an endogenous biotin-blocking kit (Ventana) was used for bcl-6 to decrease background staining. Following antigen retrieval and primary antibody incubation, the reaction was completed in a Ventana ES instrument using a diaminobenzidine immunoperoxidase detection kit (Ventana). A CD20 stain was performed to evaluate each core for involvement by tumor, and each core was evaluated independently by 2 pathologists (C.P.H. and D.D.W.) for the percentage of tumor cells staining by visual estimation and recorded in 10% increments. Disagreements were resolved by joint review on a multihead microscope. For each case, the core with the highest percentage of tumor cells stained was used for analysis. Cases were considered positive if 30% or more of the tumor cells were stained with an antibody. The intensity of staining was also evaluated, but was not used to determine positivity because the variability in tissue fixation and processing appeared to affect the intensity of staining. A uniform cutoff of 30% was chosen based on prior analysis of a subset of the data.39 A similar cut-off has been used by others evaluating TMA material.40-42
Antibodies used for immunohistochemical stains
Antibody . | Clone . | Source . | Antigen retrieval . | Dilution . |
|---|---|---|---|---|
| CD20 | L26 | Dako, Carpinteria, CA | Citrate 30 | 1:200 |
| CD10 | 56C6 | Ventana, Tucson, AZ | Citrate 60 | 1:1 |
| Bcl-6 | Polyclonal | Santa Cruz Biotechnology, Santa Cruz, CA | EDTA 60 | 1:75 |
| MUM1 | MUM1p* | Falini et al46 | EDTA 30 | 1:10 |
| Bcl-2 | 124 | Dako | EDTA 30 | 1:10 |
| Cyclin D2 | Polyclonal | Santa Cruz Biotechnology | EDTA 30 | 1:500 |
| FOXP1 | JC12 | Banham et al66 | EDTA 30 | 1:80 |
Citrate 30 indicates 30 minutes at 95°C in citrate (10 mM, pH 6.0); citrate 60 indicates 60 minutes at 95°C in citrate (10 mM, pH 6.0); EDTA 30 indicates 30 minutes at 95°C in EDTA (ethylenediaminetetraacetic acid; 1 mM, pH 8.0), EDTA 60 indicates 60 minutes at 95°C in EDTA (1 mM, pH 8.0).
This clone is now commercially available from Dako.
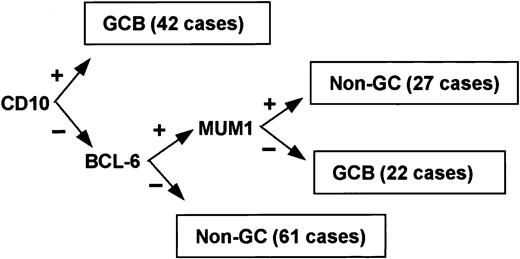
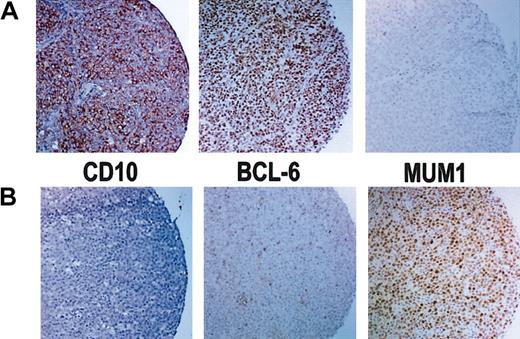
Immunoperoxidase results for CD10, bcl-6, and MUM1 were used to subclassify the cases (Figures 1 and 2). Although 3 subgroups of DLBCL were identified by cDNA microarray classification, the type 3 group is heterogeneous and behaves in a manner similar to the ABC group.36 Therefore, the cases were classified into 2 groups: GCB or non-GCB. Given that bcl-6 and CD10 are markers of germinal center B cells,43-45 cases were assigned to the GCB group if CD10 alone was positive or if both bcl-6 and CD10 were positive. If both bcl-6 and CD10 were negative, the case was assigned to the non-GCB subgroup. MUM1 is expressed in plasma cells and the later stages of B-cell development,46 and it is associated with the ABC group in gene expression profiling studies.36 If bcl-6 was positive and CD10 was negative, the expression of MUM1 determined the group: if MUM1 was negative, the case was assigned to the GCB group; if MUM1 was positive, the case was assigned to the non-GCB group.
Results of immunoperoxidase staining. (A) Immunoperoxidase stains of a GCB case that is positive for CD10 and bcl-6 but negative for MUM1. (B) Immunoperoxidase stains of a non-GCB case that is negative for CD10 but shows rare bcl-6+ cells and is positive for MUM1. Original magnification, × 100.
Results of immunoperoxidase staining. (A) Immunoperoxidase stains of a GCB case that is positive for CD10 and bcl-6 but negative for MUM1. (B) Immunoperoxidase stains of a non-GCB case that is negative for CD10 but shows rare bcl-6+ cells and is positive for MUM1. Original magnification, × 100.
The Kaplan-Meier method was used to estimate overall and event-free survival distributions.47 Overall survival (OS) was calculated as the time from diagnosis to the date of death or last contact. Patients who were alive at last contact were treated as censored for OS analysis. Event-free survival (EFS) was calculated from the time of diagnosis to the date of progression, death, or last contact. Patients who were alive at last contact and who had not progressed were treated as censored for EFS analysis. The log-rank test, stratified by institution, was used to compare survival distributions.48 The Mantel-Haenszel method was used to compare the clinical characteristics between the TMA subgroups while stratifying for institution.49 Multivariate analysis was performed using the Cox regression method and was stratified by institution.50 Stepwise selection was used to determine the variables that were independent predictors of overall survival. SAS software (SAS Institute, Cary, NC) was used for the data analysis.
Results
Clinical data were available for all patients. The patients included 82 men and 70 women with a median age of 63 years (range, 14-90 years). The median follow-up of the surviving patients was 6.4 years (range, 0.8-21.8 years). The 5-year OS for the entire group was 52% and the 5-year EFS was 48%.
Expression of CD10 was seen in 28% (42 of 152) of the patients, bcl-6 in 56% (85 of 152), MUM1 in 47% (71 of 151), cyclin D2 in 13% (19 of 152), bcl-2 in 50% (76 of 152), and FOXP1 in 61% (90 of 147). Univariate analysis of the expression of each protein and its relationship to OS and EFS are shown in Table 2. Tumor expression of bcl-6 was associated with a significantly longer OS (P < .001) and EFS (P = .013). Similarly, CD10 expression predicted for longer OS (P = .019), but not EFS. In contrast, tumor expression of MUM1 was associated with shorter OS (P = .009) and EFS (P = .003). Likewise, cyclin D2 predicted for worse OS (P < .001) and EFS (P < .001), whereas the expression of bcl-2 or FOXP1 did not predict for OS or EFS.
Immunohistochemical stain results, TMA subclassification, IPI scores, and their effect on (OS) and EFS by univariate analysis
. | No. (%) . | 5-y OS, % (95% CI) . | P* . | 5-y EFS, % (95% CI) . | P* . |
|---|---|---|---|---|---|
| CD10 | |||||
| Negative | 110 (72) | 44 (34-53) | .019 | 47 (37-57) | .89 |
| Positive | 42 (28) | 74 (60-87) | 51 (35-68) | ||
| Bcl-6 | |||||
| Negative | 67 (44) | 30 (18-42) | < .001 | 35 (22-49) | .013 |
| Positive | 85 (56) | 69 (59-79) | 57 (46-68) | ||
| MUM1 | |||||
| Negative | 80 (53) | 66 (55-76) | .009 | 62 (51-74) | .003 |
| Positive | 71 (47) | 36 (24-48) | 31 (19-43) | ||
| Cyclin D2 | |||||
| Negative | 133 (87) | 58 (45-71) | < .001 | 54 (44-63) | < .001 |
| Positive | 19 (13) | 11 (0-26) | 7 (0-20) | ||
| Bcl-2 | |||||
| Negative | 76 (50) | 55 (43-66) | .17 | 54 (42-67) | .17 |
| Positive | 76 (50) | 50 (38-61) | 42 (30-55) | ||
| FOXP1 | |||||
| Negative | 57 (39) | 58 (45-71) | .29 | 52 (38-66) | .25 |
| Positive | 90 (61) | 50 (39-61) | 48 (36-59) | ||
| TMA | |||||
| GCB | 64 (42) | 76 (66-87) | < .001 | 63 (50-76) | .007 |
| Non-GCB | 88 (58) | 34 (24-45) | 36 (25-47) | ||
| IPI score | |||||
| 0-2 | 84 (66) | 68 (58-78) | < .001 | 65 (54-76) | < .001 |
| 3-5 | 44 (34) | 31 (17-45) | 23 (9-37) |
P values were determined by comparing survival distributions using the log-rank test.
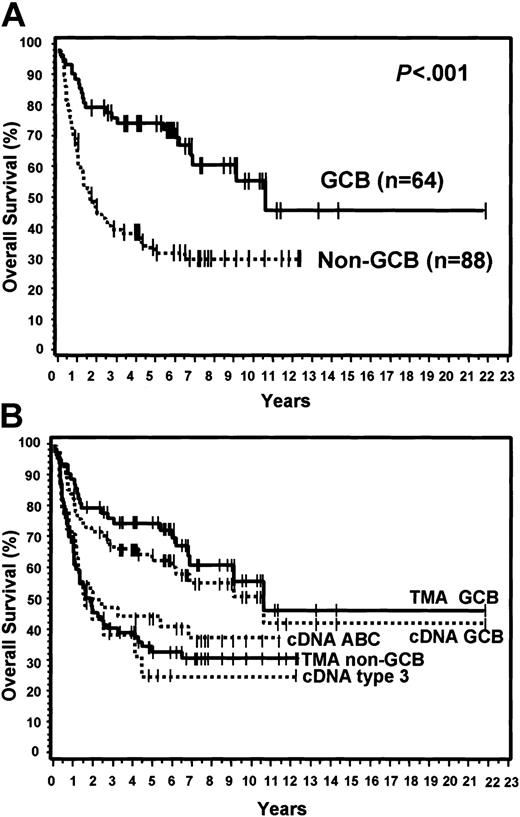
Of the 152 cases, 64 (42%) were considered GCB and 88 (58%) were considered non-GCB by TMA analysis (Figure 1). Of the GCB cases, 9% expressed CD10 alone, 34% expressed bcl-6 alone, and 57% expressed both CD10 and bcl-6 (Figure 2). MUM1 expression was seen in 17% of the GCB cases (2 cases with CD10 alone and 9 cases with both CD10 and bcl-6). Of the non-GCB cases, 36% expressed MUM1 alone, 31% expressed both MUM1 and bcl-6, and 33% were negative for all of these markers (Figure 2). Cases classified as GCB by the TMA had a significantly longer OS (P < .001; Figure 3A) and EFS (P = .007) compared with the non-GCB group. The 5-year OS for the GCB group was 76% compared with only 34% for the non-GCB group (Table 2), which is similar to that reported using the cDNA microarray.35,36 In fact, the OS curves of the TMA classification virtually superimpose on those corresponding to the cDNA classification (Figure 3B).
OS curves and TMA classification. (A) OS curves using the TMA classification of GCB versus non-GCB. (B) TMA classification of GCB versus non-GCB compared to the cDNA classification of GCB, ABC, and type 3.
OS curves and TMA classification. (A) OS curves using the TMA classification of GCB versus non-GCB. (B) TMA classification of GCB versus non-GCB compared to the cDNA classification of GCB, ABC, and type 3.
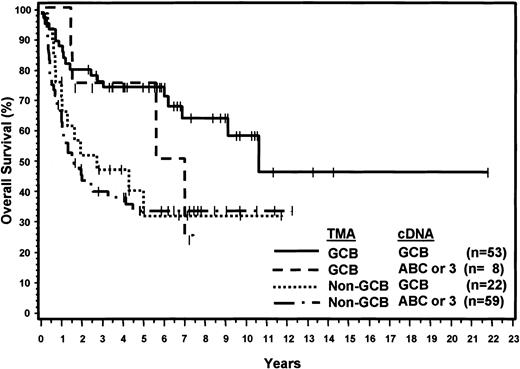
Considering the cDNA microarray classification as the gold standard, the sensitivity of the TMA was 71% for the GCB group and 88% for non-GCB group. The positive predictive value of the TMA classification was 87% for the GCB group and 73% for the non-GCB group. Compared with the cDNA microarray results, 30 patients were thought to have been misclassified using the TMA. Eight cases classified as ABC or type 3 by the cDNA microarray were classified as GCB by the TMA, and 22 cases classified as GCB by the cDNA microarray were classified as non-GCB by the TMA. However, the 8 patients thought to have been misclassified as GCB by the TMA had a 5-year OS of 76% and the survival curve is similar to the concordant GCB OS curve except for 2 late deaths (Figure 4). Furthermore, survival analysis demonstrated that the 22 patients classified by the TMA as non-GCB but assigned to the GCB category by the cDNA microarray had a 5-year OS of only 34%, which is comparable to the 5-year OS of 35% for the concordant non-GCB/ABC or type 3 cases (Figure 4). Thus, the TMA classification may be more predictive of OS than the cDNA microarray classification.
OS curves showing concordant and discordant results of TMA and cDNA classification.
OS curves showing concordant and discordant results of TMA and cDNA classification.
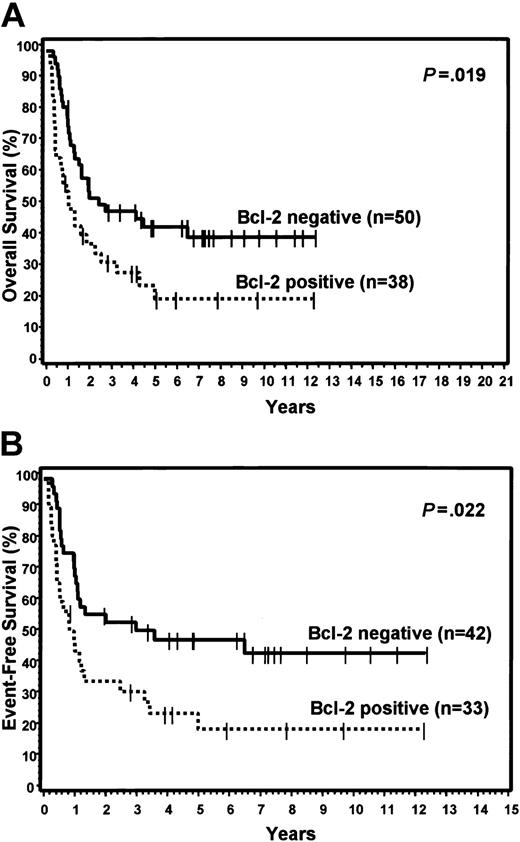
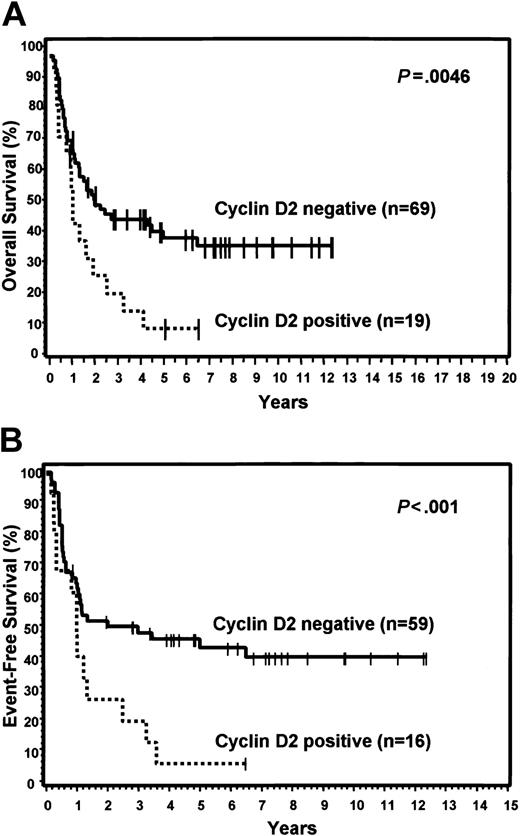
FOXP1 was expressed in 48% of the GCB group and 71% of the non-GCB group, but did not predict for OS or EFS in either the TMA GCB or non-GCB groups, or within the IPI categories. Bcl-2 was expressed in 59% of the GCB group and 43% of the non-GCB group. Expression of bcl-2 did not predict for OS or EFS in the GCB group, but cases in the non-GCB group that expressed bcl-2 had a significantly worse OS (P = .019) and EFS (P = .022; Figure 5). However, bcl-2 expression did not predict for OS or EFS within the low or high IPI categories. Cyclin D2 expression was seen only in cases assigned to the non-GCB group (22%) and predicted for significantly worse OS (P = .005) and EFS (P < .001) within this group (Figure 6). Cyclin D2 was also a significant predictor of worse OS and EFS in both the low and high IPI categories.
Expression of bcl-2. Relationship of bcl-2 expression to OS (A) and EFS (B) in non-GCB patients.
Expression of bcl-2. Relationship of bcl-2 expression to OS (A) and EFS (B) in non-GCB patients.
Expression of cyclin D2. Relationship of cyclin D2 expression to OS (A) and EFS (B) in non-GCB patients.
Expression of cyclin D2. Relationship of cyclin D2 expression to OS (A) and EFS (B) in non-GCB patients.
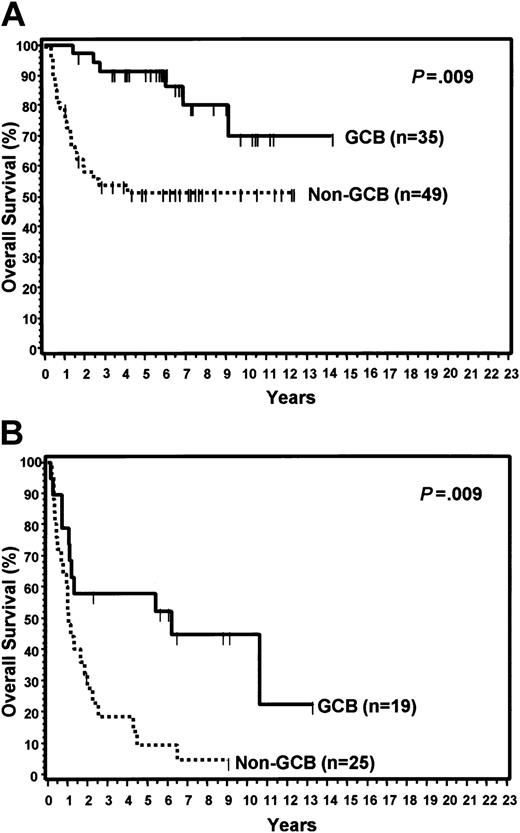
The clinical features of the patients with TMA classifications of GCB and non-GCB are shown in Table 3. The 2 subtypes of DLBCL did not differ with regard to any of the clinical features. For the entire group, the IPI score predicted OS (P < .001) and EFS (P < .001) when comparing those with low (0-2) versus high (3-5) scores (Table 2). When separately considering those patients with low or high IPI scores, the TMA GCB group had a significantly longer OS than the non-GCB group within each IPI category (Figure 7). Non-GCB patients with a high IPI score had a particularly poor prognosis with a median OS of only 1 year.
Clinical features of the 2 TMA subtypes of DLBCL
. | Total (%) . | GCB (%) . | Non-GCB (%) . | P . |
|---|---|---|---|---|
| Total no. | 152 | 64 | 88 | |
| Sex | ||||
| Male | 82 (54) | 29 (45) | 53 (60) | .11 |
| Female | 70 (46) | 35 (55) | 35 (40) | |
| Age, y | ||||
| Median | 63 | 60 | 64 | .56 |
| Range | 14-90 | 14-82 | 21-90 | |
| Stage | ||||
| I/II | 77 (51) | 32 (51) | 45 (51) | .97 |
| III/IV | 74 (49) | 31 (49) | 43 (49) | |
| Extranodal sites | ||||
| Fewer than 2 | 120 (82) | 48 (77) | 72 (85) | .36 |
| 2 or more | 27 (18) | 14 (23) | 13 (15) | |
| Karnofsky score | ||||
| Higher than 70 | 117 (77) | 51 (80) | 66 (76) | .51 |
| 70 or lower | 34 (23) | 13 (20) | 21 (24) | |
| LDH | ||||
| Normal | 65 (48) | 32 (56) | 33 (42) | .11 |
| High | 70 (52) | 25 (44) | 45 (58) | |
| IPI risk group | ||||
| Low, 0-2 | 84 (66) | 35 (65) | 49 (66) | .80 |
| High, 3-5 | 44 (34) | 19 (35) | 25 (34) |
LDH indicates lactate dehydrogenase.
Relationship between IPI scores and TMA classification. (A) OS curves of patients with low IPI scores (0-2) by TMA classification of GCB versus non-GCB. (B) Patients with high IPI scores (3-5) by TMA classification.
Relationship between IPI scores and TMA classification. (A) OS curves of patients with low IPI scores (0-2) by TMA classification of GCB versus non-GCB. (B) Patients with high IPI scores (3-5) by TMA classification.
Multivariate analysis was performed using 128 patients with complete information for all variables. Variables considered in the analysis were the TMA classification, IPI risk group (0-2 versus 3-5), cyclin D2, bcl-2, FOXP1, and interactions between the TMA classification and cyclin D2, bcl-2, and FOXP1. The IPI was an independent predictor of OS (P < .0001), with those in the high IPI risk group (scores 3-5) having a 4.2-fold (95% CI, 2.3-7.5) greater risk of death. The TMA classification was also an independent predictor of OS (P < .001), with the non-GCB cases having a 3.6-fold (95% CI, 1.9-6.6) greater risk of death. None of the other variables was a significant independent predictor.
Discussion
Gene expression studies using cDNA microarrays have identified prognostic subgroups in DLBCL.35-37 Initially, DLBCL was divided into only 2 subgroups termed GCB and ABC, but a third group, called type 3, was subsequently added to reflect the heterogeneity of DLBCL in gene expression.35,36 Although as few as 13 to 17 genes can be used to identify prognostic subgroups,36,37 gene expression technology is not currently available for routine clinical use. Furthermore, this technology requires fresh or frozen tissue with an adequate amount of RNA. With the frequent use of radiologically directed needle biopsies, adequate tissue for routine histology is sometimes difficult to obtain. Therefore, the ability to identify subgroups of DLBCL using immunohistochemistry would have great practical utility.
We found that the GCB and non-GCB subtypes of DLBCL can be accurately predicted using a panel of only 3 immunostains. As depicted in Figure 1, the expression pattern of CD10, bcl-6, and MUM1 can be used to classify DLBCL into GCB and non-GCB subtypes. The antibodies selected for this study recognize molecules whose mRNA expression was highly associated with the GCB and non-GCB groups in cDNA microarray studies,35,36 and are reactive in formalin-fixed, paraffin-embedded tissue. Compared with the cDNA microarray, this immunostain panel reproduced the gene expression results in 71% of GCB and 88% of non-GCB cases and predicted for survival in a similar manner. This is the first study to correlate subclassification by gene expression with subclassification by protein expression in DLBCL.
If confirmed, our findings would have immediate clinical utility because immunohistochemical staining is already a widely used method. In addition, immunostains allow for the direct visualization and, therefore, evaluation of the neoplastic cells. On the other hand, gene expression methods require a fresh or frozen tumor sample, which is not available in many cases, and sometimes fail to yield results (6.6% of our cases). In addition, unless microdissection is performed, the tissue submitted for cDNA analysis contains not only tumor but also the associated nontumor tissue. If there is a significant amount of nontumor tissue present, the cDNA expression data may not reflect the gene expression profile of the tumor. In the current study, 22 cases were classified as GCB by the cDNA microarray but as non-GCB by the TMA. However, these 22 patients had a median survival of only 2.7 years and, therefore, behaved similarly to the other non-GCB cases. This finding suggests that those patients actually belong in the non-GCB group. The cDNA classification may have been inaccurate due to the presence of normal lymph node tissue or normal germinal centers in the cDNA sample, which could have biased the cDNA results. In addition, the amount of stromal tissue present in the cDNA sample may also have influenced the gene expression results. In these 22 discordant cases, the TMA classification appears to predict survival more accurately, which was likely due to our ability to directly visualize immunostaining of the tumor cells. Actual protein expression in the tumor cells is more likely to be predictive of outcome than mRNA expression, because these 2 parameters may not always correlate and the expression of protein is the ultimate effector of gene expression. However, because these findings need to be confirmed, we are unable to conclude at this time that the TMA classification is a better predictor than the cDNA microarray.
Recently, the cDNA results from most of our cases were reclassified using an alternative algorithm.51 This alternative method defined 3 groups designated as GCB, ABC, and unclassified. Of our 139 cases analyzed using this algorithm, 70 were classified as GCB, 44 as ABC, and 25 unclassified. The TMA classification had a sensitivity of 70% for the GCB group and 87% for the non-GCB group when using this alternative method, and the positive predictive value of the TMA classification was 84% for the GCB group and 74% for the non-GCB group. The survival outcomes of the cases were similar to those shown in Figures 3 and 4, thus reaffirming the predictive value of our immunostain panel.
The TMA is a cost-effective tool that allows the rapid evaluation of immunohistochemical staining of multiple tumors in a single tissue section.52 Although the TMA is a research tool, TMA immunostaining results agree with whole tissue section staining in 86% to 100% of cases and, as the number of core samples increases, the level of agreement also increases.41,42 By using 4 core samples from each case, the agreement between TMA and whole section staining is 97% to 100%.41 Furthermore, when compared with whole section immunohistochemistry, there is better consistency in the immunostaining between cases because most cases are located on the same TMA section. Quantitation of the staining results is also easier because each tissue core can be completely viewed under one intermediate-power microscopic field, and each case can be evaluated in a matter of seconds. Furthermore, use of a TMA preserves the tissue in the paraffin blocks for future studies.
CD10 is a membrane-associated, neutral endopeptidase that is expressed in a variety of human tissues, but has a restricted expression in the germinal center cells of reactive lymphoid tissues.44 Previous studies using flow cytometry have suggested that CD10 expression in DLBCL may predict for inferior survival,53,54 especially in conjunction with bcl-2 expression.54 However, these studies included only a limited number of patients with short clinical follow-up. Another report of CD10 expression using flow cytometry or immunostaining in DLBCL found that patients with low IPI scores and CD10 expression had a significantly better OS,27 whereas other studies have found no difference in outcome for patients with DLBCL that express CD10.31,32,55 However, in the study by Colomo and colleagues,31 the CD10+ cases were significantly more likely to have advanced-stage disease, which may have negated any predictive value of CD10 expression. Some studies using immunohistochemical methods have found CD10 expression to be associated with significantly improved OS.20,23,28,38 Like-wise, we found that CD10 expression predicts for better OS. However, given the variability of outcomes in these retrospective studies, it is doubtful that CD10 alone can be used to predict survival in DLBCL.
Bcl-6 is a zinc-finger protein that acts as a transcriptional repressor56 and is expressed in germinal center B cells and a subset of CD4+ T cells.43,45,57,58 Gene rearrangements involving bcl-6 have been detected in 16% to 37% of DLBCL, but most studies have found no difference in outcome.9,14-16,22 One study found bcl-6 rearrangement to predict for better OS,8 whereas 2 other studies have found it to predict for worse OS.21,30 However, studies of bcl-6 rearrangements do not identify all of the DLBCL cases that overexpress bcl-6, because some mutations of the bcl-6 gene may also result in overexpression.59,60 Immunohistochemical studies of bcl-6 expression and its relationship to outcome in DLBCL are limited in number. A recent study reported no difference in OS related to bcl-6 expression,31 whereas another study found bcl-6 expression to be associated with a better EFS but not OS.18 Other studies have reported that bcl-6 expression predicts for better OS.20,24,30 We found that bcl-6 expression by immunohistochemistry predicts for both better OS and EFS. Furthermore, bcl-6, in conjunction with CD10 and MUM1, is a useful marker to identify the GCB phenotype. However, some cases of DLBCL that express bcl-6 and MUM1 have an ABC gene expression pattern. Although these cases express bcl-6, the outcome is most likely to be that of the ABC subtype, and this may explain why there are discrepancies in outcome prediction when using bcl-6 expression alone. The cases in this study were investigated using a polyclonal anti–bcl-6 antibody. More recently, a monoclonal antibody (clone PG-B6p), which is also suitable for detection of the bcl-6 molecule in routine biopsies, has become commercially available. The monoclonal antibody should facilitate future tissue microarray studies because of its high specificity, absence of background staining, and the good reproducibility of immunostaining results between different centers.43
MUM1/IRF-4 is a lymphoid-specific member of the interferon regulatory factor family of transcription factors.61 MUM1 is normally expressed in plasma cells and a minor subset of germinal center cells, and has been reported in 50% to 77% of DLBCLs.40,46,62 Although a recent study found no association between MUM1 expression and OS,31 we found that expression of MUM1 in at least 30% of tumor cells is associated with a significantly worse OS and EFS. Others have also found MUM1 to be predictive of worse survival.38,63 Expression of MUM1 may denote the final step of germinal center B-cell differentiation with subsequent B-cell maturation toward plasma cells.64 Given this biologic function, it appears that MUM1 has potential to be a marker of the non-GCB phenotype. Indeed, when used in conjunction with CD10 and bcl-6, we found that MUM1 identified cases of the non-GCB phenotype.
The prognostic value of bcl-2 expression in DLBCL is controversial. By Southern blot analysis, the presence of bcl-2 gene rearrangement does not appear to be predictive of survival5,7,8,11,13,15,16,19,22 with only one study reporting worse survival.4 In fact, some studies suggest that patients with bcl-2 gene rearrangements have better survival.16,22 Multiple studies have looked at the expression of bcl-2 using immunostains and most have found no difference in OS.6,7,10,11,17-20,26 Some studies have found that bcl-2 expression is associated with a significantly worse OS.12,13,15,25,29-31 However, one of these studies included T-cell lymphomas13 and, in 2 studies, the bcl-2+ group had higher stage disease.12,31 A number of studies have found bcl-2 expression to correlate with worse EFS.10-13,17 In the cDNA study,35 a 4-fold increase of bcl-2 mRNA was more common in the ABC group (71%) compared with the GCB group (29%), but we did not find a significant difference in the expression of bcl-2 protein between the GCB and non-GCB groups in this study. However, mRNA expression does not always translate to protein expression. Other studies using an immunohistochemical panel that classified DLBCL into GCB and non-GCB groups have also found no difference in the expression of bcl-2 protein between these 2 groups.29,31 These studies reported bcl-2 expression in 50% to 67% of GCB and 45% to 62% of non-GCB cases.29,31 Similarly, we found that bcl-2 was expressed in 59% of the GCB group and 43% of the non-GCB group. In our study population, bcl-2 expression by itself had no prognostic effect on OS or EFS. However, when used in conjunction with the TMA subclassification, expression of bcl-2 was associated with a significantly worse outcome in the non-GCB group, but not in the GCB group.
FOXP1 is a winged-helix transcription factor that acts as a transcriptional repressor.65,66 It is expressed in a wide variety of normal and neoplastic tissues, including a subset of DLBCL.66 In reactive lymphoid tissues, FOXP1 is seen in a variable proportion of B cells, both within and outside the germinal centers, but it does not stain plasma cells.66 One group has reported an inverse correlation between FOXP1 and bcl-6 expression in DLBCL.67 By immunohistochemical staining, we found FOXP1 expression in 61% of DLBCL. Within the TMA subgroups, FOXP1 was expressed more often in the non-GCB group (71% of cases) than in the GCB group (48% of cases). However, FOXP1 expression had no effect on OS or EFS when evaluated alone or within the context of IPI scores or the TMA subclassification.
Cyclin D2 is a cell cycle regulatory protein that is reported to be expressed in 27% of DLBCLs by immunohistochemical staining.68 However, another study found no evidence of genomic amplification of the cyclin D2 gene in 24 cases of DLBCL.69 No studies to date have evaluated the prognostic significance of cyclin D2 expression in DLBCL. In the current study, we found expression of cyclin D2 in 14% of DLBCLs. However, all of these patients were in the non-GCB subgroup and they had a very poor clinical outcome with a median survival of only 1 year. Only 2 of the 19 patients were alive at 5 years. Additional studies evaluating the prognostic value of cyclin D2 expression in DLBCL are needed to confirm our preliminary findings.
A recent study similar to ours used the coexpression of CD10 and bcl-6 to determine the “GC phenotype,” and found that it was predictive of better OS.29 However, by using this more limited approach, some GCB cases that mark with either CD10 or bcl-6 alone would be inaccurately classified as non-GCB. In our study, this method would have misclassified 28 GCB patients as non-GCB, because these cases were positive for either CD10 or bcl-6, but not both. Although it may be useful to identify patients who will perform better with current therapy, it is perhaps more important to accurately identify those patients who will do poorly in order to provide more aggressive therapy at the time of diagnosis. To accurately subdivide DLBCL, markers predictive of both the GCB and non-GCB phenotypes should be used. Another study similar to ours using an immunostain panel of CD10, bcl-6, MUM1, and CD138 was recently published,31 but did not find a survival difference between the GCB and non-GCB patients. However, the cases expressing CD10 were significantly more likely to have advanced stage (Ann Arbor stage III or IV) disease compared with those who were negative for CD10. This clinical difference may account for their inability to find a survival difference between CD10+ and CD10– cases and, in turn, GCB and non-GCB cases. In addition, 14% of the patients included in that study did not receive an anthracycline-containing chemotherapy regimen. Recently, another group reported that the combination of CD10, bcl-6, MUM1, and CD138 could identify 2 prognostic subgroups in DLBCL.38 Similarly, we found that CD10, bcl-6, and MUM1 expression could subclassify DLBCL into GCB and non-GCB groups. We also found that, in addition to the IPI score, our immunostain panel was an independent predictor of survival in multivariate analysis.
In conclusion, we found that the expression of CD10, bcl-6, MUM1, bcl-2, and cyclin D2 are each predictive of survival in DLBCL, and that the results for CD10, bcl-6, and MUM1 can be combined to divide DLBCL into GCB and non-GCB subgroups with an outcome similar to that predicted by cDNA microarray analysis. In fact, this latter panel of immunostains predicted the cDNA classification in 71% of GCB and 88% of ABC or type 3 cases. However, these findings need to be confirmed and more studies comparing gene expression and protein expression are clearly needed. Currently, the number of immunohistochemical markers available for delineating prognostic groups is rather limited. As new antibodies for GCB- and ABC-specific proteins or other markers are developed for immunohistochemistry, additional studies would be of interest. If such studies are confirmatory, a panel of immunohistochemical stains could be used to stratify patients for risk-adjusted therapies. In particular, patients with the non-GCB phenotype, especially those with high IPI scores or with tumors expressing bcl-2 or cyclin D2, could be identified prospectively for more aggressive or experimental therapies.
Prepublished online as Blood First Edition Paper, September 22, 2003; DOI 10.1182/blood-2003-05-1545.
Supported in part by US Public Health Service grants CA36727 and CA84967 awarded by the National Cancer Institute, Department of Health and Human Services, the Leukemia Research Fund of Great Britain, and the Associazione Italiana per la Ricerca sul Cancro (AIRC).
The publication costs of this article were defrayed in part by page charge payment. Therefore, and solely to indicate this fact, this article is hereby marked “advertisement” in accordance with 18 U.S.C. section 1734.
The authors wish to thank Jacqueline L. Cordell who made the FOXP1 antibody, Greg Cochran who performed the immunostains, James C. Lynch for advice regarding statistical analysis, and the other members of the Lymphoma/Leukemia Molecular Profiling Project.

This feature is available to Subscribers Only
Sign In or Create an Account Close Modal