

Key Points
SMZL comprises 4 distinct genetically defined molecular clusters and 2 distinct phenotypically defined immune-microenvironment classes.
The molecular-based nosology of SMZL can improve disease classification and discovery of novel biomarkers and therapeutic vulnerabilities.

Abstract
Splenic marginal zone B-cell lymphoma (SMZL) is a heterogeneous clinico-biological entity. The clinical course is variable, multiple genes are mutated with no unifying mechanism, and essential regulatory pathways and surrounding microenvironments are diverse. We sought to clarify the heterogeneity of SMZL by resolving different subgroups and their underlying genomic abnormalities, pathway signatures, and microenvironment compositions to uncover biomarkers and therapeutic vulnerabilities. We studied 303 SMZL spleen samples collected through the IELSG46 multicenter international study (NCT02945319) by using a multiplatform approach. We carried out genetic and phenotypic analyses, defined self-organized signatures, validated the findings in independent primary tumor metadata and determined correlations with outcome data. We identified 2 prominent genetic clusters in SMZL, termed NNK (58% of cases, harboring NF-κB, NOTCH, and KLF2 modules) and DMT (32% of cases, with DNA-damage response, MAPK, and TLR modules). Genetic aberrations in multiple genes as well as cytogenetic and immunogenetic features distinguished NNK- from DMT-SMZLs. These genetic clusters not only have distinct underpinning biology, as judged by differences in gene-expression signatures, but also different outcomes, with inferior survival in NNK-SMZLs. Digital cytometry and in situ profiling segregated 2 basic types of SMZL immune microenvironments termed immune-suppressive SMZL (50% of cases, associated with inflammatory cells and immune checkpoint activation) and immune-silent SMZL (50% of cases, associated with an immune-excluded phenotype) with distinct mutational and clinical connotations. In summary, we propose a nosology of SMZL that can implement its classification and also aid in the development of rationally targeted treatments.
Introduction
Splenic marginal zone lymphoma (SMZL) is an indolent small B-cell neoplasm deriving from lymphocytes of the splenic marginal zone and affecting the spleen, bone marrow (BM), and peripheral blood (PB).
The incidence of SMZL is increasing, mainly because of improved diagnostic techniques resulting in more patients being diagnosed every year. However, in parallel, life expectancy of patients with SMZL is not improving. Compared with other indolent B-cell neoplasms, the survival of patients with SMZL is unsatisfactory (5-year relative survival ∼79%),1-3 and no breakthrough treatment advances have been seen.3
SMZL is heterogeneous at multiple levels. The clinical course is variable, with some patients having prolonged survival and a proportion (∼20%) experiencing rapidly progressive disease and survival <5 years.4 SMZL lacks a unifying genetic lesion. Multiple mutated genes have been identified, which are restricted to a fraction of cases.5-11 Inflammatory cells are expanded in a subset of SMZL,12 suggesting the existence of different microenvironments. Clinical trials evaluating novel agents provide a glimpse into signaling pathways that are essential for SMZL, but sensitivity to these agents is not always observed.13-15
The IELSG46 study (NCT02945319) is a multicenter, international, retrospective, observational study that aims at resolving the heterogeneity of SMZL into subgroups by using a multiplatform approach, with the belief that it might yield a nosology of SMZL that could be implemented for disease classification and result in the discovery of novel biomarkers and therapeutic vulnerabilities.
Methods
Patients
Inclusion criteria of the IELSG46 study were: (1) age ≥18 years; (2) SMZL diagnosis by spleen histopathologic examination; (3) availability of tumor material from spleen collected before initiation of medical therapy; and (4) availability of baseline and follow-up annotations. Patients who received any antitumor medical therapy before splenectomy were excluded. The study was conducted in accordance with the Declaration of Helsinki and the principles of Good Clinical Practice. The study was approved by the Ethics Committee (ID: 2016-01978), and patients provided written informed consent. Coded health-related patient data and tumor biological samples were collected from eligible patients (supplemental Methods, available on the Blood Web site).
Pathology review and tissue microarray
A pathology expert panel reviewed the cases (G. Bhagat, E.C, L.D.L., S. Dirnhofer, L.M., S.A.P., M.A.P., M. Paulli, M. Ponzoni, A.T.G.). Diagnoses were based on the WHO classification.16 Cases were assembled on tissue microarrays (A. Tzankov) as described with slight modifications.17 IGHV analysis was performed in 2 different ways according to quality/quantity of the starting material (supplemental Methods).
LyV3.0 CAncer Personalized Profiling by deep Sequencing Assay (CAPP-Seq)
A CAPP-Seq protocol was used for mutation and copy number abnormality (CNA) analysis. Libraries derived from tumor genomic DNA of FFPE (n = 246) or frozen tissues (n = 57). No patient-matched normal specimens were available. The assay limit of quantification was calculated as the mean allele frequency of non-SNP variants from normal FFPE spleen “blank” samples. The assay analytical sensitivity was established by generating limiting dilutions of FFPE gDNA from 1 patient with active lymphoma into normal gDNA of FFPE spleen samples, resulting in expected tumor fractions between 100% and 0.2%. The number of the libraries loaded in the sequencer was tailored to obtain a coverage >2000 times in >80% of the region of interest. A tumor-only, background error-suppressed approach was used for variant and copy number calling (supplemental Methods).
RNA-seq
RNA-seq (TruSeq Stranded mRNA Kit; Illumina Technology) of 45 fresh biopsy samples was used to identify gene fusions. Gene expression was assessed in FFPE biopsy samples by using HTG EdgeSeq Precision Immuno-Oncology (HTG-PIO) and HTG EdgeSeq Oncology Biomarker Panels (HTG-OBP) (HTG Molecular Diagnostics) (supplemental Methods).
Bioinformatics and medical statistics
The following bioinformatics approaches are described in the supplemental Methods: mutation calling, CNA detection, pathway-driven clustering of mutation data, gene fusion detection, gene expression analysis, signature enrichment testing, microenvironment signatures definition and clustering, and deconvolution of cell percentages from bulk transcriptomes. Overall survival (OS) was measured from the date of initial presentation to the date of death from any cause (event) or last follow-up (censoring). Survival analysis was performed by Kaplan-Meier method. Relative survival (RS), defined as the ratio between actuarial survival observed in patients and expected survival of the general population matched to by geographical origin, sex, age, and calendar year of diagnosis, was calculated using the Ederer II method. Categorical variables were compared by χ2 test and Fisher’s exact test when appropriate. Continuous variables were compared by ANOVA and student t tests when appropriate. Statistical tests were 2-sided, and significance was defined as P < .05, after correction for multiplicity where appropriate. Analyses were performed with R (http://www.r-project.org).
Results
Patient characteristics
Patients diagnosed with SMZL on splenic resections were registered in the IELSG46 study by 28 centers in Europe and the United States. A total of 373 patients were initially identified. Seventy cases were excluded due to alternative diagnoses on central pathology review or insufficient material (supplemental Figure 1A). Table 1 lists the clinical characteristics of the 303 patients with confirmed SMZLs. Deletion 7q and use of IGHV1-2*04 allele, which are recurrent in SMZL,18,19 were detected in 26.4% and 33.9% of cases, respectively. Based on the percentage of IGHV gene identity to the germline, 11.1% of cases were “truly unmutated” (100% homology) (supplemental Table 1). Median follow‐up after splenectomy was 10.6 years, with 86 deaths. At 10 years, OS was 68.5% and RS compared with the matched general population was 82.1% (supplemental Figure 1B). After splenectomy, which counted as first-line therapy, 10.6% of patients received additional treatment, including chemotherapy (5%) or rituximab +/− chemotherapy (5.6%).
Patients’ characteristics
| Charachteristic | n (%) |
|---|---|
| Female:male ratio | 55.1:44.9 |
| Median age | 64 (IQR = 17) |
| Period of diagnosis | |
| <1990 | 1 (0.3) |
| 1990-1994 | 11 (3.6) |
| 1995-1999 | 32 (10.6) |
| 2000-2004 | 75 (24.8) |
| 2005-2009 | 142 (46.9) |
| 2010-2014 | 32 (10.6) |
| >2015 | 10 (3.3) |
| ECOG scale | |
| 0-1 | 191 (63.0) |
| >1 | 16 (5.3) |
| Missing | 96 (31.7) |
| Ann Arbor stage | |
| I | 0 |
| II | 0 |
| III | 0 |
| IV | 272 (89.8) |
| missing | 31 (10.2) |
| B symptoms | |
| Yes | 54 (17.8) |
| No | 181 (59.7) |
| Missing | 68 (22.5) |
| Extrahilar lymph node | |
| Yes | 61 (20.1) |
| No | 156 (51.5) |
| Missing | 86 (28.4) |
| Median hemoglobin | 11.6 g/dL (IQR=2.9) |
| HPLL (<9.5 g/dL) | 41 (13.5) |
| ILL (<12 g/dL) | 142 (46.9) |
| Low (<10 g/dL) | 56 (18.5) |
| Missing | 54 (17.8) |
| Median platelets | 125 ×109/L (IQR=70) |
| Low (<80 ×109/L) | 33 (10.9) |
| Missing | 62 (20.5) |
| Median lymphocytes | 3.3 ×10⁹/L (IQR=7.65) |
| High (>5.0 × 10⁹/L) | 84 (27.7) |
| Normal | 135 (44.6) |
| Missing | 84 (27.7) |
| Median LDH | 387.5 U/L (IQR=249) |
| High (>ULN) | 87 (28.7) |
| Normal | 113 (37.3) |
| Missing | 103 (34.0) |
| Median albumin | 40 g/L (IQR=6.0) |
| Low (<35 g/L) | 23 (7.6) |
| Normal | 131 (43.2) |
| Missing | 149 (49.2) |
| Median β2-microglobulin | 3.6 mg/L (IQR=2.07) |
| High (>2.5 mg/L) | 96 (31.7) |
| Normal | 34 (11.2) |
| Missing | 173 (57.1) |
| HCV | |
| Positive | 12 (4.0) |
| Negative | 175 (57.7) |
| Missing | 116 (38.3) |
| Serum monoclonal component | |
| Yes | 61 (20.1) |
| IgG | 21(34.5) |
| IgM | 39 (63.9) |
| Missing | 1 (1.6) |
| No | 138 (45.6) |
| Missing | 104 (34.3) |
Extrahilar lymph nodes were regional in all cases and affected the celiac region.
HPLL, Hb threshold by the Splenic Marginal Zone Lymphoma Study Group (HPLL) score; IIL, Hb threshold by the Interguppo Italiano Linfomi (IIL) score.
These data confirmed the representativeness of the study cohort and the lack of biases due to the inclusion of splenectomized patients.3,20,21
A genetic classifier for SMZL
We investigated mutations using the LyV3.0 CAPP-seq assay, which targeted ∼280 kb of genomic space by deep sequencing and that has been specifically designed to cover the majority of coding regions known to be recurrently mutated in mature B-cell neoplasms (supplemental Table 2). To validate the LyV3.0 CAPP-seq assay, we compared in silico the enrichment of somatic mutations by LyV3.0 CAPP-seq with whole exome sequencing (WES) after simulating mutation detection using data from 32 individual SMZLs reported in the literature.22 LyV3.0 CAPP-seq yielded a 23-fold increase of variant detection per sample per sequenced base pair compared with WES (supplemental Table 3). For coding mutations, minimal increase in the mutation recovery from SMZL samples was expected by enlarging the probed genomic space over that included in LyV3.0 CAPP-seq. When applied to DNA samples from 8 FFPE tissues of normal spleen (“blank” samples), the limit of quantification of LyV3.0 CAPP-seq was 0.3%, which represented the analytical background noise threshold (supplemental Figure 2A). When gDNA samples from 3 FFPE tissues of SMZL were diluted with control gDNA from FFPE tissues of normal spleen, the analytical sensitivity of LyV3.0 CAPP-seq was 2%, representing the lowest detectable allele frequency (supplemental Figure 2B).
A stringent computational method designed for tumor-only samples was used to filter out artifacts, putative germline variants, variants of unknown significance, and variants known to be benign or likely benign. Individual nonsynonymous mutations discovered by LyV3.0 CAPP-seq (supplemental Table 4) and recurring in >1% of SMZLs are shown in Figure 1A. The number of mutations in each individual sample was not affected by the age of the biopsy (supplemental Figure 2C). The most frequently mutated genes were NOTCH2, KLF2, KMT2D, TNFAIP3, NOTCH1, and TP53. Consistent with the diagnosis of SMZL, the rare MYD88 mutations mapped outside the p.265 hotspot. No fusions were detected by RNA-seq. Mutations in MYC, BCL2, and BCL6, which are surrogates for translocation of these genes adjacent to immunoglobulin genes,23 were extremely rare (supplemental Table 4).
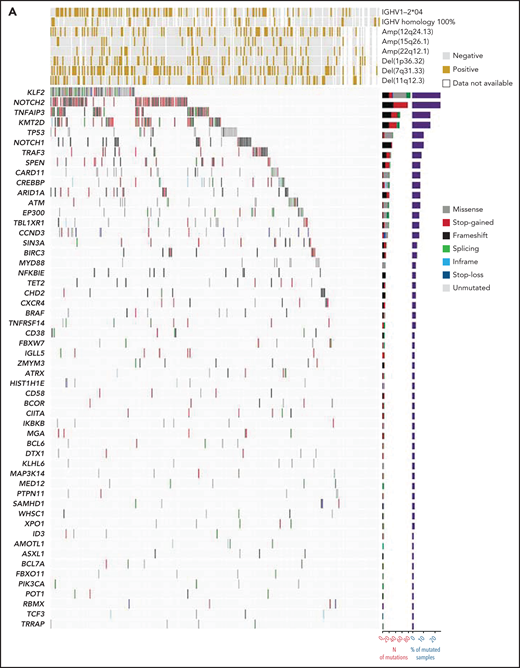
Mutation landscape of SMZL. (A) The heatmap shows genes mutated in ≥1% of SMZL cases. In the heatmap, each row represents a gene, and each column represents an SMZL case. The heatmap is manually clustered to emphasize mutational cooccurrence. The number and type of somatic mutations in any given gene are plotted in the histogram on the right of the heatmap. On the top of the heatmap are shown the cytogenetic and immunogenetic features for each SMZL sample. (B) The heatmap shows pairwise Pearson correlation coefficients between each pair of genes mutated in SMZL. Red cells indicate a positive correlation, blue cells indicate a negative correlation. (C) Pathways that are recurrently mutated in newly diagnosed SMZL. In the heatmap, rows correspond to genes, and columns represent individual patients. Color coding is based on gene alteration status (gray, wild type; red, mutated). The heat map was manually clustered to emphasize mutational cooccurrence.
Mutation landscape of SMZL. (A) The heatmap shows genes mutated in ≥1% of SMZL cases. In the heatmap, each row represents a gene, and each column represents an SMZL case. The heatmap is manually clustered to emphasize mutational cooccurrence. The number and type of somatic mutations in any given gene are plotted in the histogram on the right of the heatmap. On the top of the heatmap are shown the cytogenetic and immunogenetic features for each SMZL sample. (B) The heatmap shows pairwise Pearson correlation coefficients between each pair of genes mutated in SMZL. Red cells indicate a positive correlation, blue cells indicate a negative correlation. (C) Pathways that are recurrently mutated in newly diagnosed SMZL. In the heatmap, rows correspond to genes, and columns represent individual patients. Color coding is based on gene alteration status (gray, wild type; red, mutated). The heat map was manually clustered to emphasize mutational cooccurrence.
To segregate SMZLs into discrete genetic classes supported by coordinated mutational profiles, we started with a set of pathway-driven seed modules comprising components of several B-cell programs (supplemental Table 5). Genes were assigned to a module based on published literature and database annotations.23-27 Genes that were attributed to multiple modules (eg, KLF2) were not assigned and seeded individually. Unsupervised analysis of mutational cooccurrence between all lesion pairs revealed overall significantly stronger exclusivity between intrapathway lesions (Figure 1B). Mutual exclusivity of mutations within a pathway could reflect functional redundancy and supported their aggregation within a seed (Figure 1C). We then applied hierarchical clustering on principal components (HCPC) and discovered 4 groups of tumors (clusters) with discrete genetic signatures overall accounting for 86.4% of cases and an additional subset without detectable mutations in the interrogated genomic space (13.6% of cases) (Figure 2A). The algorithm converged on genetic clusters that for simplicity were termed NNK (58.2% of cases, for NF-κB, NOTCH, and KLF2 modules), DMT (32.8% of cases, for DNA-damage response, MAPK, and TLR modules), CBS (4.8% of cases, for cytokine, B-cell receptor signaling, and spliceosome modules), and PA (4.2% of cases, for PI3K/AKT module). Application of the same approach to an independent meta-dataset of SMZLs profiled by WES22 produced overlapping genetic clusters (supplemental Figure 3A), thus supporting the robustness of the classification and excluding biases related to the hypothesis-driven design of the genomic space we used for sequencing.

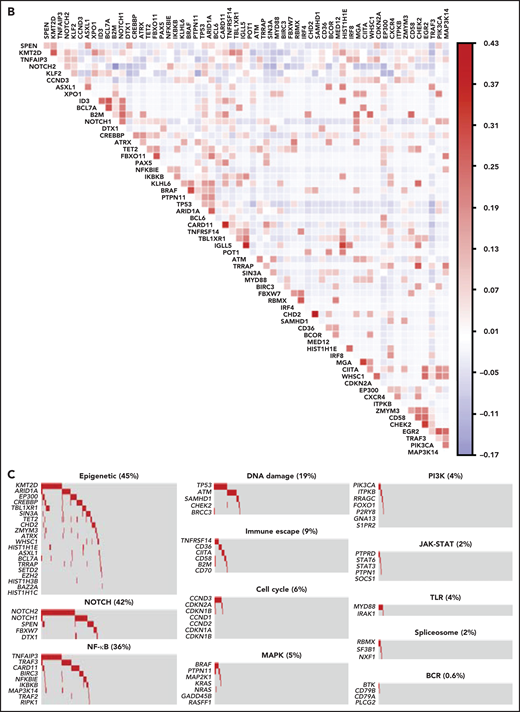
Pathway-driven clustering of SMZL mutations. (A) Heatmap showing SMZL mutations collapsed into pathways and clustered using HCPC in the SMZL cohort. (B) Heatmap showing genes entering the clustering analysis. The genes are color-coded according to the assigned cluster and ordered according to the relative enrichment in the specific cluster represented as a bar on the right. Only genes with mutation rate >0.01 are shown. (C) The heatmap shows the enrichment of IGHV mutational status and recurrent CNA in the molecular clusters. Size and color intensities of the circles are proportional to the prevalence of each variable in the molecular cluster. The asterisk shows statistical significant differences (Fisher’s exact test P < .05).
Pathway-driven clustering of SMZL mutations. (A) Heatmap showing SMZL mutations collapsed into pathways and clustered using HCPC in the SMZL cohort. (B) Heatmap showing genes entering the clustering analysis. The genes are color-coded according to the assigned cluster and ordered according to the relative enrichment in the specific cluster represented as a bar on the right. Only genes with mutation rate >0.01 are shown. (C) The heatmap shows the enrichment of IGHV mutational status and recurrent CNA in the molecular clusters. Size and color intensities of the circles are proportional to the prevalence of each variable in the molecular cluster. The asterisk shows statistical significant differences (Fisher’s exact test P < .05).
The minimal set that allowed to classify patients with SMZL into NNK and DMT clusters included 14 genes (TP53, ATM, KLF2, TNFAIP3, NOTCH2, BRAF, MYD88, SPEN, CARD11, NOTCH1, PTPN11, CHD2, SAMHD1, and NFKBIE) and performed with an accuracy of 90% in the training set and of 89% in the validation set. The model was further validated in a completely independent meta-dataset,22 yielding a comparable accuracy (73%) (supplemental Figure 4).
Overall, 99.4% of mutations discovered in the spleen were concordantly detected in synchronous peripheral/marrow blood, including 100% of mutations affecting the minimal set of genes. This observation indicates that molecular cluster assignment can leverage on “liquid biopsies” (supplemental Figure 5).
NNK and DMT clusters together accounted for the vast majority (91.0%) of SMZLs with detectable mutations. NNK-SMZLs were dominated by mutations affecting NF-κB (eg, TNFAIP3), including noncanonical pathway genes (eg, TRAF3, BIRC3), NOTCH (eg, NOTCH2, NOTCH1, SPEN), and KLF2. KLF2 mutations cooccurred with NOTCH mutations in 21.8% of NNK-SMZL, and with NF-kB mutations in 18.6% of cases (Figure 2B). These observations, along with the fact that NOTCH, NF-κB, and KLF2 regulate MZ B-cell differentiation,28 and that KLF2 is a master regulator of both NOTCH and NF-κB29 signaling, suggested a pervasive oncogenic cooperation between these genetic lesions in NNK-SMZLs to hijack the MZ B-cell differentiation program. DMT-SMZLs were characterized by mutations in DNA damage response genes (eg, TP53, ATM). Mutations in MAPK (eg, BRAF) and TLR genes (eg, MYD88) were also enriched in DMT-SMZLs (Figure 2B). CBS-SMZLs harbored mutations in cytokine signaling (eg, STAT6, STAT3, PTPN1, PTPRD), B-cell receptor signaling (eg, CD79A, BTK), and spliceosome (eg, SF3B1, RBMX) genes. PA-SMZLs harbored mutations in PIK3CA, ITPKB, a noncanonical inhibitor of AKT,30 and RRAGC, an mTORC1-regulator31 (Figure 2B).
Molecular clusters were correlated with immunogenetic features and CNA to find specific associations (Figure 2C; supplemental Tables 1 and 6). NNK-SMZLs were enriched in IGHV1-2*04 usage and 7q deletion, while conversely, DMT-SMZLs showed depletion of both (Figure 2C; supplemental Table 7).
Phenotypic differences among SMZL clusters
We applied gene expression profiling to FFPE tissue samples to explore phenotypic differences among SMZL clusters. The concordance between expression profiling of FFPE tissues and gold standard RNA-seq was validated in 57 cases with available paired frozen and FFPE SMZL specimens (supplemental Figure 2D-E). We analyzed the entire study cohort for the expression of 2559 genes focusing on oncogenic signaling and used 18 signatures, selected from public databases and the literature according to the genes and pathways related to the mutation signatures (supplemental Table 8), and reflecting distinct biological processes and differentiation programs of B cells (supplemental Tables 8 and 9). For each signature, we calculated an activity score that is directly associated with the magnitude of a particular effect among populations of cells.32 We then analyzed the correlation between the NNK- and DMT-SMZL clusters and the signatures (Figure 3A). NNK-SMZLs expressed significantly higher levels of genes belonging to the NOTCH2 pathway and of genes that are activated by noncanonical NF-κB transcription factors.33 A proliferation signature also characterized NNK-SMZLs. Conversely, DMT-SMZLs had a signature of impaired TP53 and apoptosis functions.
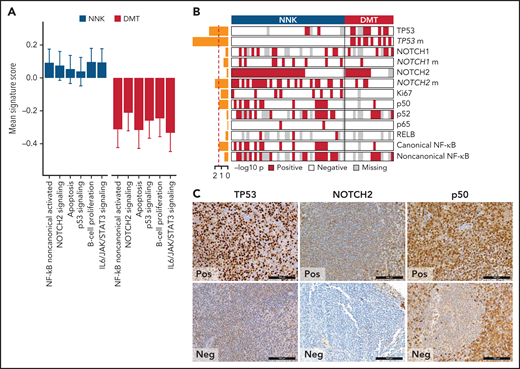
Biological attributes of the molecular clusters. (A) Barplot showing differential gene expression signature enrichment between NNK and DMT cluster. Statistical significance was determined using pairwise Student t tests on scaled activity score values and was <0.05 for all the gene sets (NF-κB noncanonical activated, P = .004; NOTCH2 signaling, P = .043; apoptosis, P = .009; p53 signaling, P = .028; B-cell proliferation, P = .014; IL6/JAK/STAT3 signaling, P = .003). (B) The heatmap shows the distribution of TMA markers in NNK and DMT molecular clusters. A red color indicates the positivity of the marker, a white color indicates the negativity of the marker, and gray color indicates missing data. The barplot on the left shows the -log10P value of a 1-sided Fisher’s exact test between the 2 clusters for each marker. (C) TP53, NOTCH2, and p50 expression in TMA cores from SMZL spleen sections.
Biological attributes of the molecular clusters. (A) Barplot showing differential gene expression signature enrichment between NNK and DMT cluster. Statistical significance was determined using pairwise Student t tests on scaled activity score values and was <0.05 for all the gene sets (NF-κB noncanonical activated, P = .004; NOTCH2 signaling, P = .043; apoptosis, P = .009; p53 signaling, P = .028; B-cell proliferation, P = .014; IL6/JAK/STAT3 signaling, P = .003). (B) The heatmap shows the distribution of TMA markers in NNK and DMT molecular clusters. A red color indicates the positivity of the marker, a white color indicates the negativity of the marker, and gray color indicates missing data. The barplot on the left shows the -log10P value of a 1-sided Fisher’s exact test between the 2 clusters for each marker. (C) TP53, NOTCH2, and p50 expression in TMA cores from SMZL spleen sections.
We used immunohistochemistry (IHC) to comparatively screen NNK-SMZLs vs DMT-SMZLs for evidence of NOTCH and NF-κB biochemical activation (Figure 3B,C; supplemental Table 10). Consistent with the high incidence of NOTCH and NF-κB pathway mutations in NNK-SMZLs, they frequently showed nuclear staining for NOTCH, canonical- and noncanonical-NF-κB proteins, while nuclear TP53 expression strongly correlated with DMT-SMZLs (Figure 3B,C).
Paired BM biopsies of 96 patients were revised by the local pathologists. The BM morphology was typical (ie, nodular or nodular-interstitial pattern, with or without intrasinusoidal infiltration) in 85 cases (88.5%) and atypical (ie, paratrabecular or diffuse patterns without intrasinusoidal infiltration) in the remaining 11 cases (11.5%). With the limitations imposed by the sample size, the majority of cases showing an atypical BM morphology belonged to the DMT molecular cluster, while cases belonging to the NNK, CBS, and PA molecular clusters preferentially or exclusively showed a typical BM morphology (supplemental Table 11).
Immune microenvironment of SMZL
The immune microenvironment of SMZL is poorly understood. We thus profiled the expression of 1402 genes focusing on tumor/immune interactions and used 16 signatures (supplemental Table 12), reflecting distinct immune cell subtypes and immune cell programs, to virtually reconstruct the spleen microenvironment of SMZL.34 We analyzed the relationship of each signature among samples by applying an unsupervised clustering algorithm and obtained 2 major classes of predicted spleen microenvironment in SMZL (Figure 4A; supplemental Table 13). One class, accounting for 50% of SMZLs, was dominated by macrophage (eg, CD163), cytokine (eg, BAFF, IL6, IL10), chemokine (eg, CXCR3,35CXCL9,36,37CCL5, CX3CR138), T cell (eg, CD3), and regulatory T cell (eg, FOXP3) signatures, along with an expected immune-suppressive checkpoint milieu (eg, inhibitory receptors CTLA4, TIM3, PD-1, BTLA, TIGIT, LAG3 associated with T-cell exhaustion, and low expression of MHC-I genes) indicative of an immune-evasion profile (immune-suppressive class). A second class, accounting for the other 50% of SMZLs, had a microenvironment where the B-cell signatures of obvious tumor origin dominated (eg, CD19, CD20, CD79A/B, PAX5) similar to observations in immune-excluded lymphomas (immune-silent class).39 Application of the same approach to an independent meta-dataset of spleen samples of SMZL40 produced overlapping phenotypic clusters even with a smaller sample size (supplemental Figure 3B), thus supporting the robustness of the classification.


Resolution of the tumor microenvironment by gene expression analysis. (A) Heatmap of scaled activity score values related to microenvironment signatures. HCPC clustering reveals 2 major microenvironment classes (“immune-suppressive” and “immune-silent”) in the SMZL cohort. The differential expression of the microenvironment signatures is also represented as density plots on the right. (B) Alluvial plot showing sample distribution among microenvironment classes and mutational clusters. (C) The heatmap shows the percentages of patients mutated for the top mutated genes in the 2 microenvironment classes. Size and color intensities of the circles are proportional to the prevalence of each variable in the microenvironment class. The asterisk shows statistical significant differences (Fisher’s exact test P < .05).
Resolution of the tumor microenvironment by gene expression analysis. (A) Heatmap of scaled activity score values related to microenvironment signatures. HCPC clustering reveals 2 major microenvironment classes (“immune-suppressive” and “immune-silent”) in the SMZL cohort. The differential expression of the microenvironment signatures is also represented as density plots on the right. (B) Alluvial plot showing sample distribution among microenvironment classes and mutational clusters. (C) The heatmap shows the percentages of patients mutated for the top mutated genes in the 2 microenvironment classes. Size and color intensities of the circles are proportional to the prevalence of each variable in the microenvironment class. The asterisk shows statistical significant differences (Fisher’s exact test P < .05).
To confirm the different composition of the “immune-suppressive” and “immune-silent” SMZL classes, we applied digital cytometry deconvolution,41 which inferred a heterogeneous and microenvironment-rich composition in the “immune-suppressive” class of SMZL, and a high ratio of neoplastic-to-microenvironmental cells in the “immune-silent” class (Figure 5A; supplemental Table 14).
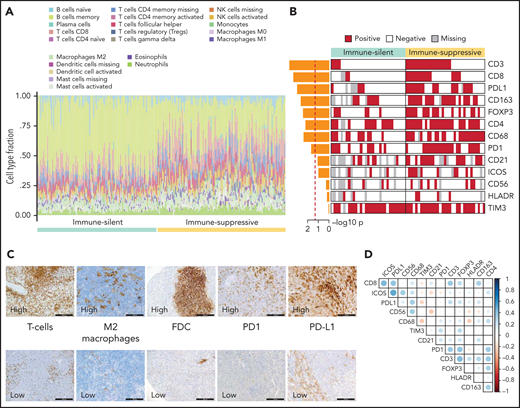
Orthogonal validations of the microenvironment composition. (A) Digital cytometry experiments. Gene expression data were used to infer the cell composition (covering 22 hematopoietic cellular populations) of spleen tissues. Staked barplots represent the individual cell compositions (scaled to a total of 100%). Samples (on the x-axis) are ordered according to the 2 major microenvironment classes. (B) The heatmap shows the distribution of selected TMA markers across the 2 microenvironment classes. A red color indicates the positivity of the marker, a white color indicates the negativity of the marker, and gray color indicates missing data. The barplot on the left shows the -log10P value of a 1-sided Fisher’s exact test between the 2 classes for each marker. (C) CD3 (T cell), CD163 (M2 macrophages), CD21 (FDC), PD1, PDL1 expression in TMA cores from SMZL spleen section. (D) The heatmap shows pairwise Pearson correlation coefficients between TMA markers. Red cells indicate negative correlation, and blue cells indicate positive correlation.
Orthogonal validations of the microenvironment composition. (A) Digital cytometry experiments. Gene expression data were used to infer the cell composition (covering 22 hematopoietic cellular populations) of spleen tissues. Staked barplots represent the individual cell compositions (scaled to a total of 100%). Samples (on the x-axis) are ordered according to the 2 major microenvironment classes. (B) The heatmap shows the distribution of selected TMA markers across the 2 microenvironment classes. A red color indicates the positivity of the marker, a white color indicates the negativity of the marker, and gray color indicates missing data. The barplot on the left shows the -log10P value of a 1-sided Fisher’s exact test between the 2 classes for each marker. (C) CD3 (T cell), CD163 (M2 macrophages), CD21 (FDC), PD1, PDL1 expression in TMA cores from SMZL spleen section. (D) The heatmap shows pairwise Pearson correlation coefficients between TMA markers. Red cells indicate negative correlation, and blue cells indicate positive correlation.
Orthogonal validation by immuno-phenotypical analysis confirmed the microenvironment tissue contexture derived from gene expression and digital cytometry deconvolution (Figure 5B,C; supplemental Table 10). The “immune-suppressive” class of SMZL had higher intratumoral CD3+ T cells, CD4+ T cells, CD8+ T cells, FOXP3+ T cells, CD163+ (M2) macrophages, and CD68+ macrophages than the “immune-silent” class. The “immune-suppressive” class of SMZL also had higher intratumoral PD1+ cells and PD-L1+ cells than “immune-silent” SMZL. PD1 expression colocalized with T-follicular helper cells in tumors containing germinal centers and with tumor-infiltrating T cells in areas devoid of germinal centers. PD-L1 expression colocalized with tumor-infiltrating macrophages (Figure 5D). The immune-microenvironment classes were evenly distributed between cases with typical and atypical BM morphology (supplemental Table 11).
The immune microenvironment classes of SMZL were equally distributed across the molecular clusters (Figure 4B). Taken together, these data indicated that in SMZL, such as in DLBCL, microenvironment signatures provide additional information that is not fully captured by a multigene mutational signature.23 In DLBCL, individual gene mutations rather than molecular signatures provided mechanistic insights into the interaction between lymphoma cells and the immune microenvironment.42-47 To understand at a more granular level the mechanisms by which SMZL might induce specific microenvironment patterning, we comparatively assessed the spectra of the most recurrent mutations between the “immune-suppressive” vs the “immune-silent” classes of SMZL. KLF2 mutations were enriched in the “immune-suppressive” class of SMZL and depleted in the “immune-silent” class (Figure 4C). The tumor mutational burden, that is an approximation for neoantigen load and corresponds to the number of nonsynonymous mutations per coding area of the target region, was also higher in the “immune-suppressive” vs the “immune-silent” classes of SMZL (1.012 mutation/Mb vs 0.826 mutation/Mb, P = .019).
Clinical course of the SMZL clusters
Baseline clinical features distributed evenly across molecular clusters and immune microenvironment classes of SMZL (supplemental Table 15). To understand whether any molecular cluster or immune microenvironment class of SMZL was more aggressive than the others, we correlated these variables with relative survival. Lymphoma‐specific deaths account for less than one‐half of total deaths in SMZL.3 Accordingly, RS provides a more accurate measure of excess mortality experienced by patients than OS, without requiring cause of death information. When the demographic effects of age, sex, and year of diagnosis were compensated, the 10-year life expectancies of patients with NNK-, DMT-, and “immune-suppressive”-SMZLs were 79.0%, 85.5%, and 79.6%, respectively, of those expected in the matched general population (Figure 6; supplemental Figure 4). Conversely, the 10-year life expectancy of patients with CBS-, PA-, or “immune-silent”-SMZL was not significantly lower than that expected in the matched general population. The combination of molecular and phenotypic profiling allowed us to sort out a high-risk clinical subset whose lymphoma was characterized by having both the NNK genotype and “immune-suppressive” microenvironment, and associated with an excess mortality (10 years RS: 70.8%) compared with the matched general population (Figure 6; supplemental Figure 6).
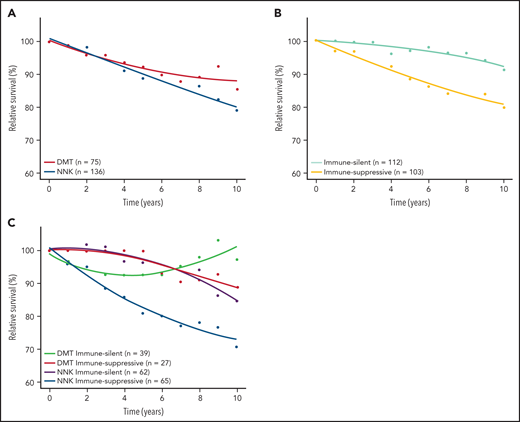
RS of SMZL patients. RS rates are presented for the 2 major mutational clusters (A), for the 2 major microenvironment classes (B), and for all their combinations (C).
RS of SMZL patients. RS rates are presented for the 2 major mutational clusters (A), for the 2 major microenvironment classes (B), and for all their combinations (C).
Among baseline clinical biomarkers that are known to be associated with SMZL patients’ outcomes, only low Hb and albumin significantly impacted relative survival (supplemental Figure 7). Of note, neither low Hb nor low albumin is associated with any molecular or microenvironmental SMZL subtypes, making it unlikely that they can act as confounders in the inferior RS of NNK and immune-suppressive SMZL (supplemental Table 15).
Discussion
Our study highlights the complexity of SMZL, which comprises 4 distinct genetically defined molecular clusters and 2 distinct phenotypically defined immune-microenvironment classes. The molecular framework for SMZL that we present here provides an evolving understanding of its pathogenesis and can be regarded as a building block for further refining the classification of small B-cell lymphoproliferative diseases involving the spleen.
NNK and DMT clusters together contain the vast majority of SMZLs. NNK-SMZLs differ from DMT-SMZLs genetically, phenotypically, and clinically. The NNK cluster accounts for ∼60% of SMZLs and is characterized by genetic changes that have been previously associated with the disease, such as NOTCH2 mutations, KLF2 mutations, 7q deletion, and IGHV1-2*4 usage.5,6,18,19 The DMT cluster accounts for ∼30% of SMZLs and is characterized by mutations in genes that are broadly affected in different B-cell lymphoproliferative disorders such as TP53, ATM, BRAF, and MYD88. The enrichment of nuclear expression of NOTCH and NF-κB transcription factors and of their gene expression signatures in NKK-SMZLs, and the complementary enrichment of signatures marking dysfunction of TP53 and apoptosis in DMT-SMZLs support the biological validity of these molecular clusters. From a clinical perspective, NNK- and DMT-SMZLs show different outcomes.
The existence of NNK- and DMT-SMZLs was externally validated in independent cohorts and by genetically modified mouse models of SMZL. The robustness of the NNK and DMT molecular clusters is supported by their identification in the Oquendo et al22 meta-dataset of SMZL genotypes, despite its heterogeneous source of tumor DNA (eg, blood, marrow, spleen), sequencing strategy, and variant calling pipeline. In vivo murine models mimicking SMZL confirm that Notch2/Nf-κB activation and Tp53 disruption in committed/mature B cells are distinct and sufficient mechanisms of neoplastic transformation.48,49 Therefore, our results strongly support the conclusion that SMZLs exist as at least 2 molecularly distinct subtypes that are resolvable by genomic analysis. The CBS and PA molecular clusters account for a minority of SMZL (∼10%) and warrant further validations.
Splenectomy was the first-line therapy in all patients of the IELSG46 cohort. Currently, splenectomy is less frequently used as first-line therapy in SMZL and has progressively been replaced by rituximab.3 Evaluation of the relationship between SMZL genetic subtypes and outcome in additional cohorts and in the setting of rituximab-based treatment will be important to confirm and extend these findings. Lymphoma treatment is an evolving field, and a number of pathway inhibitors have recently been approved.50,51 The results of our study nominate genetic subtypes of SMZL where pathway inhibitors could be tested. For example, drugs that target B-cell receptor-dependent NF-κB activation (eg, BTK inhibitors) could be investigated in NNK-SMZLs, drugs that target the PI3K/AKT/mTOR pathway (eg, PI3K inhibitors) could be investigated in PA-SMZLs, while drugs that activate the apoptotic machinery when the DNA damage response pathway is disrupted (eg, BCL2 inhibitors) could be investigated in DMT-SMZLs.
Gene expression signatures and in situ profiling segregate 2 basic types of SMZLs immune microenvironments with distinct mutational and clinical connotations. The “immune-suppressive” class of SMZL accounts for ∼50% of cases and strongly correlates with tumor-infiltrating lymphocytes and macrophage recruitment as well as with immune checkpoint activation, ultimately suggesting the potential role of checkpoint-inhibitors in this subset of SMZLs.14 The “immune-suppressive” class of SMZLs mimics the signatures of the “host response” class of diffuse large B-cell lymphoma (DLBCL), which notably expresses high levels of molecules also observed in SMZL,52 and frequently involves the spleen. This observation establishes a new link between SMZL and DLBCL in addition to the recently discovered BN2/C1 genotype of DLBCL,23,53 which shares NOTCH2 mutations with SMZL.
We highlight the enrichment of KLF2 inactivating mutations within the “immune-suppressive” class of SMZL. As KLF2 is a transcription factor involved in regulating several immune responses, it is likely that a constitutive dysregulated gene expression/epigenetic program drives immune evasion in KLF2 mutated SMZLs. Deregulated transcription of lymphoma cells has already been associated with modifications of the tumor microenvironment interactions resulting in immune cell recruitment, immune cell reprogramming, and immune evasion in other lymphoma types.42,45,46 The precise mechanisms linking KLF2 mutations with reshaping of the immune microenvironment remain to be established.
Gene expression and immune cell topography indicate that “immune-silent” SMZLs can be categorized as a “cold” tumor. In this setting, therapeutic strategies harnessing the killing power of T cells in a TCR independent manner and redirecting T cells into close proximity of target cells to form a cytolytic synapse (eg, bispecific T-cell engagers or CAR T cells) could be investigated.
Our study has some limitations. It lacks data on gene translocations, and the extent of assessable CNA is restricted to the target regions of the sequencing assay. Such biases are, however, largely mitigated. First, our gene panel covers all the genomic regions implicated in recurrent CNA that were previously reported in SNP array studies of SMZL, including 1q, 3q, 6q, 7q, 8p, 12q, 17p, and 18q.54 Second, contrary to DLBCL, SMZL has low genomic complexity and lacks recurrent translocations.6,55,56 Third, no novel recurrent fusions were detected by RNA-seq. Fourth, mutations in MYC, BCL2, and BCL6, which are a surrogate of their translocations with an immunoglobulin gene partner,23 were extremely rare in the cohort, consistent with the knowledge that such structural variants are virtually absent in SMZL.55,56
Our study was entirely based on spleen tissue samples. Currently, SMZL can be diagnosed without the need for splenectomy by integrating BM histology with cell morphology and immunophenotype in the blood and BM.57 This notion prompts the question as to how we can identify the molecular clusters and microenvironmental classes of SMZL with a minimally invasive approach (ie, without splenectomy). The almost universal dissemination of lymphoma cells in the blood allows the use of “liquid biopsy” approaches for characterizing the genetics of SMZL. The validity of this approach is confirmed by the evidence that the molecular profile of circulating SMZL cells matches that of cells residing in the spleen.6 Efforts to profile tumor-infiltrating immune cells in SMZL have inherent limitations if splenectomy is not performed for diagnostic or therapeutic purposes. The comparison of paired BM and spleen histology may inform whether BM biopsy can be used to classify SMZL according to the microenvironmental classes. Multiparametric phenotyping of immune cells led to new lines of inquiry and assessment of the tumor microenvironment from PB samples.58,59 The abundance of tumor cells in SMZL in both blood and marrow also provides an opportunity of profiling at the same time both sides of the tumor-immune cell interactome.
In summary, our multiplatform genomic analysis elucidates SMZL pathogenesis and provides a conceptual edifice to advance the classification and development of precision therapies for SMZL.
Acknowledgments
This study was supported by Swiss Cancer Research, ID 3746, 4395, 4660, and 4705, Bern, Switzerland, Research Advisory Board of the Ente Ospedaliero Cantonale, ABREOC 2019-22514, Bellinzona, Switzerland, European Research Council (ERC) Consolidator Grant CLLCLONE, ID: 772051, Swiss National Science Foundation, ID 320030_169670/1, 310030_192439, 320036_179318, Berne, Switzerland, Fondazione Ticinese Contro il Cancro, Fondazione Fidinam, Lugano, Switzerland, Nelia & Amadeo Barletta Foundation, Lausanne, Switzerland, Fond’Action, Lausanne, Switzerland, The Leukemia & Lymphoma Society, Translational Research Program, ID 6594-20, New York, NY, AFRI, Ente Ospedaliero Cantonale, Bellinzona, Switzerland, Fondazione Ettore Balli, Associazione Italiana Ricerca sul Cancro, Special 5x1000 Program Metastases ID 21198.
Authorship
Contribution: F.B. and L.T.D.B. performed bioinformatics analysis, interpreted data, contributed to data interpretation, and manuscript preparation; A.B. performed molecular studies and bioinformatics analysis and contributed to data interpretation and manuscript preparation; F.G. performed molecular studies and contributed to data interpretation and manuscript preparation; M.F., R.K., A.R.E., and A. Calcinotto performed animal experiments, interpreted data, and contributed to manuscript revision; V.S., G.F., D.P., K.P., and A.A. performed molecular studies, to interpreted data, and contributed to manuscript revision; A.C., L. Ceriani, F. Bertoni, and F.C. contributed to data interpretation and manuscript revision; L.B. contributed to study management and manuscript revision; M.C.P., M.G.C., G.G., and W.W. contributed to medical data management, medical statistics, data interpretation, and manuscript revision; M.L., G. Bhagat, E.C., L.D.L., S. Dirnhofer, S.A.P., M.A.P., A.T.G., A. Tzankov, M. Paulli, M. Ponzoni, and L.M. provided study material, performed pathological revision, and contributed to manuscript revision; L.A., M.J.B., G.B., S.B., R.B., A. Broccoli, M.M.B., V.C., S.C., P.C., E.D., L.D., S.D., F.F., G. Gaidano, J.F.G., B.G., P.G., M.G.D.S., G. Gritti, A.G., F.H., G.I., M. Ladetto, A.L.G., E.L., A. Maiorana, R.M., E.M., V.M., M. Merli, A. Moccia, M. Mollejo, C.M., U.N., D.G.O., F. Passamonti, F. Piazza, S.P., A.R., E.S., G.S., E. Santambrogio, L.S., A.S., G. Stüssi, J.T.G., G.T., C. Tarella., C. Thieblemont, T.T., A.T., G.V., C.V., U.V., R.W., F.Z., T.Z., and P.L.Z provided study material and clinical data and contributed to manuscript revision; L.C. and H.K. performed bioinformatics analysis, contributed to data interpretation and manuscript preparation; E.Z. provided key scientific insights and contributed to data interpretation and manuscript revision; and D.R. designed the study, interpreted data, and wrote the manuscript.
Conflict-of-interest disclosure: D.R. received honoraria from AbbVie, AstraZeneca, Janssen, and research grants from AbbVie, AstraZeneca, Janssen. G. Gritti is a consultant for Takeda, IQvia, Gilead Sciences, receives research funding from Gilead Sciences, and received honoraria from Amgen and Roche. L.S. received honoraria for advisory boards from AbbVie, AstraZeneca, and Janssen. P. Ghia received honoraria from AbbVie, ArQule/MSD, AstraZeneca, Beigene, Celgene/Juno, BMS, Gilead, Janssen, Loxo/Lilly, Roche, and research grants from AbbVie, AstraZeneca, Gilead, Janssen, Sunesis. L.A. received advisory honoraria from Roche, Celgene, Janssen-Cilag, Verastem, Eusa Pharma, and Incyte, research support from Gilead, and travel expenses from Roche, Celgene, Janssen-Cilag, and Eusa Pharma. B.M.J. is currently an AstraZeneca employee. A.M. receveid honoraria for advisory boards from Roche, Janssen, and Takeda. The remaining authors declare no competing financial interests.
Correspondence: Davide Rossi, Hematology, Oncology Institute of Southern Switzerland and Institute of Oncology Research, 6500 Bellinzona, Switzerland; e-mail: davide.rossi@eoc.ch.
There is a Blood Commentary on this article in this issue.
The online version of this article contains a data supplement.
The publication costs of this article were defrayed in part by page charge payment. Therefore, and solely to indicate this fact, this article is hereby marked “advertisement” in accordance with 18 USC section 1734.

This feature is available to Subscribers Only
Sign In or Create an Account Close Modal