Key Points
Genome-wide screening identifies PTPN1 and PTPN2 as phosphatases involved in ALK inhibitor resistance in lymphoma.
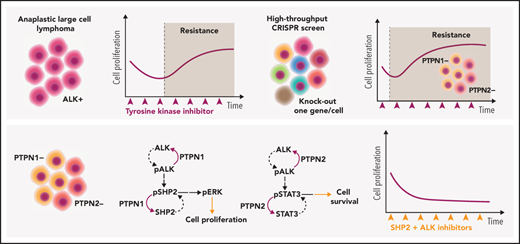
PTPN1 and PTPN2 regulate ALK and SHP2 phosphorylation, and combined inhibition of ALK and SHP2 is an effective approach to treat ALCL.
Abstract
Anaplastic large cell lymphomas (ALCLs) frequently carry oncogenic fusions involving the anaplastic lymphoma kinase (ALK) gene. Targeting ALK using tyrosine kinase inhibitors (TKIs) is a therapeutic option in cases relapsed after chemotherapy, but TKI resistance may develop. By applying genomic loss-of-function screens, we identified PTPN1 and PTPN2 phosphatases as consistent top hits driving resistance to ALK TKIs in ALK+ ALCL. Loss of either PTPN1 or PTPN2 induced resistance to ALK TKIs in vitro and in vivo. Mechanistically, we demonstrated that PTPN1 and PTPN2 are phosphatases that bind to and regulate ALK phosphorylation and activity. In turn, oncogenic ALK and STAT3 repress PTPN1 transcription. We found that PTPN1 is also a phosphatase for SHP2, a key mediator of oncogenic ALK signaling. Downstream signaling analysis showed that deletion of PTPN1 or PTPN2 induces resistance to crizotinib by hyperactivating SHP2, the MAPK, and JAK/STAT pathways. RNA sequencing of patient samples that developed resistance to ALK TKIs showed downregulation of PTPN1 and PTPN2 associated with upregulation of SHP2 expression. Combination of crizotinib with a SHP2 inhibitor synergistically inhibited the growth of wild-type or PTPN1/PTPN2 knock-out ALCL, where it reverted TKI resistance. Thus, we identified PTPN1 and PTPN2 as ALK phosphatases that control sensitivity to ALK TKIs in ALCL and demonstrated that a combined blockade of SHP2 potentiates the efficacy of ALK inhibition in TKI-sensitive and -resistant ALK+ ALCL.
Introduction
Anaplastic large cell lymphoma (ALCL) is a T-cell lymphoma frequently driven by chromosomal rearrangements involving the anaplastic lymphoma kinase (ALK) gene. Chemotherapy, or brentuximab vedotin plus chemotherapy, is the current standard of care for ALCL, including ALK+ ALCL, with a ∼70% cure rate for ALK+ ALCL.1 The strong dependency of ALK+ ALCL on ALK signaling2,3 supported the clinical use of ALK tyrosine kinase inhibitors (TKIs) in ALK+ ALCL refractory or relapsed cases after chemotherapy, where the ALK TKI crizotinib has shown remarkable efficacy in pediatric and adult studies.4,5 Based on these early clinical results, the Food and Drug Administration recently granted “breakthrough therapy” designation to crizotinib for use in patients with relapsed/refractory ALK+ ALCL. Clinically, crizotinib-treated patients can be divided into responders (ie, patients that undergo prolonged complete remission for several years with no detectable minimal residual disease)4,5 or resistant patients that develop resistance to crizotinib within the first few months of treatment. For responder patients, long-term follow-up showed that cure is not achieved even in patients with a prolonged complete response, as discontinuation of crizotinib in patients in complete remission for several years leads to rapid relapse.6
ALK point mutations explain a small subset of crizotinib-resistant cases.4,5 These mutations overlap with those observed in ALK+ non–small-cell lung cancer (NSCLC) patients and can be potentially overcome by administering an alternative ALK TKI.7,8 However, ALCL patients show primary resistance or early progression within 4 months in the absence of an ALK mutation,4,5 likely through additional mechanisms that are currently poorly understood. The discovery of such mechanisms could lead to specific therapies to overcome ALK TKI resistance in ALK+ ALCL.
By employing clustered regularly interspaced short palindromic repeats (CRISPR)/CRISPR-associated protein 9 (Cas9) genome-wide screens, we identified PTPN1 (also called PTP1B) and PTPN2 (TC-PTP) as 2 key tyrosine phosphatases that directly regulate ALK phosphorylation in ALCL. Deletion of PTPN1 and PTPN2 from tested ALK+ ALCL lines conferred immediate resistance to crizotinib as well as to second- and third-generation ALK TKIs in vitro and in vivo. Mechanistically, PTPN1 and/or PTPN2 deletion resulted in hyperactivation of STAT3 and the MAPK pathway. In addition, PTPN1 deletion potently increased SHP2 (PTPN11) phosphorylation. ALK-mediated activation of SHP2 is a specific feature of ALK+ ALCL, and blockade of SHP2 activity by a selective inhibitor restored sensitivity to crizotinib in PTPN1- or PTPN2-deficient cells in vitro and in vivo. Thus, we have shown that PTPN1 and PTPN2 phosphatases regulate ALK activity and that resistance to ALK TKIs can be overcome by a combination therapy using SHP2 inhibitors.
Materials and methods
Cell lines and reagents
Human ALK+ ALCL cell lines (TS, SU-DHL-1, COST, Karpas-299, and JB6) were obtained from the German Collection of Microorganisms and Cell Cultures. OCI-Ly13.2, DL-40, and MAC2A (ALK− ALCL) were kindly provided by David Weinstock (Dana-Farber Cancer Institute). T cells were purified from peripheral blood mononuclear cells (PBMCs) from healthy donors. Cell lines were maintained in RPMI 1640 (Corning) with 10% fetal bovine serum, 1% penicillin and streptomycin (Corning), and 1% glutamine (Corning). Cell lines were grown at 37°C in humidified atmosphere with 5% CO2. 293FT cells (Thermo Fisher Scientific) were cultured in Dulbecco’s modified Eagle medium, 10% fetal bovine serum, 1% penicillin and streptomycin, and 1% glutamine. Crizotinib and lorlatinib were obtained from Pfizer; alectinib (S2762), SHP099 (S8278), and Ceritinib (S7083) were purchased from Selleckchem; SD-36 (HY-129602) was purchased from MedChemExpress; and TL 13-112 (6745/5) was purchased from Tocris Bioscience.
Positive selection screening
10 × 107 ALCL cells were transduced with the concentrated lenti-GeCKO Library with multiplicity of infection closest to 0.4 via spin-infection at 2000 rpm for 2 hours at room temperature (RT). After 24 hours transduction, cells were pooled together in T75 flasks, and puromycin selection was done for 7 days. On day 7, cells were counted, and 3 × 10⁷ cells were collected for genomic DNA analysis. The rest of the cells were split into drug and dimethyl sulfoxide (DMSO) conditions with 3 × 10⁷ cells per condition. Cells were counted and passaged with fresh crizotinib added every 2 days. On day 14, cells were collected for genomic DNA analysis.
Data analysis
Single-guide RNA (sgRNA) sequences in the Genome-Scale CRISPR Knock-Out (GeCKO) library were aligned to a FASTQ file for each sample by using the basic local alignment search tool aligner, allowing a maximum mismatch of 2 bases. The number of uniquely matched or aligned reads for each sgRNA was counted. The read counts for each unique sgRNA for a given sample were normalized to RPM ([reads per million] mapped reads) to represent sgRNA values. We then used the Model-based Analysis of Genome-wide CRISPR-Cas9 Knockout (MAGeCK) algorithm9 to identify enriched genes’ rank by comparing crizotinib treatment with DMSO control sgRNAs counts, as well as depleted genes’ rank by DMSO over day 0. Based on acquired ranking list, we further selected and refined the list to identify the final candidate genes using the following restricted filtering criteria: (1) P < .005; (2) containing at least 2 significantly enriched sgRNAs identified by MAGeCK and; (3) excluding genes with median RPM <3 in treatment of enrichment comparison and in day 0 for depletion. The RPM median of significantly enriched or depleted sgRNAs (false discovery rate [FDR] <0.25) called by MAGeCK were used to represent gene level of enrichment or depletion values for each identified candidate.
RNA-sequencing data analysis
Data were provided under the MAPPYACTS protocol. Raw paired-end FASTQ files were mapped against the human reference genome (GRCh38.p12) and GENCODE transcriptome annotation version v2910 using Salmon11 (version 0.14.0) with the default parameters. Strand-specific transcript counts were converted into gene counts using the tximport package12 in R. Differential gene expression analysis and normalization were performed using the edgeR package13 in R.
Tumor xenograft
NOD scid gamma (NSG) immunocompromised mice were purchased from Charles River Laboratories. 10 × 106 of wild-type (WT), PTPN1, and PTPN2 knockout (KO) cells were resuspended in 100 µL of phosphate-buffered saline (PBS) and injected subcutaneously to both flanks of NSG mice. Tumor growth was measured with a caliper every 2 days, and tumor volume was measured as follows: (length × width2 × 0.5). When tumors reached 5 mm of length, mice were treated with crizotinib (75 mg/kg), SHP099 (75 mg/kg), or combination of both drugs by oral gavage daily for 10 to 14 days. Drugs were dissolved in 0.5% methylcellulose plus 0.05% Tween-80. Mice were euthanized at humane endpoints and tumors were fixed with 10% formalin for further experiments.
Animal experiments were performed under protocols approved by the Institutional Animal Care and Use Committee of Boston Children’s Hospital and University of Torino.
Statistical analysis
Statistical analyses were performed using GraphPad PRISM 9.0 software. P values were calculated by using 2-way analysis of variance (ANOVA) and the unpaired, 2-tailed Student t test. The P values for RNA expression data were calculated by 2-sided Mann-Whitney U test in R.
Results
Loss of PTPN1 and PTPN2 induces resistance to crizotinib in ALK+ ALCL
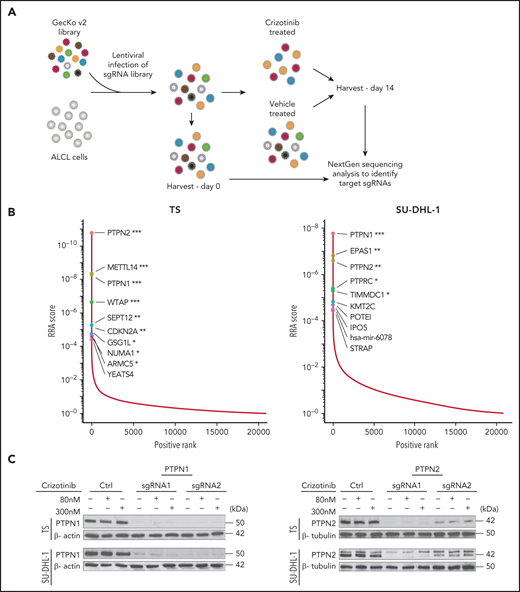
In order to identify mechanisms of resistance to crizotinib in ALK+ ALCL, we performed a genome-scale CRISPR-Cas9 loss-of-function screen in ALCL cells treated for 14 days with crizotinib (Figure 1A). The screening was performed in 4 different ALK+ ALCL cell lines (TS, SU-DHL-1, COST, and Karpas-299) that showed consistent Cas9 activity when tested with a sgRNA against reporter green fluorescent protein (data not shown), the expected frequency reads of nontargeting control sgRNAs (supplemental Figure 1A available on the Blood Web site) and reproducible depletion of sgRNAs targeting known essential genes in ALK+ ALCL,14 including c-MYC, STAT3, NPM1, ALK, and IRF414 (supplemental Figure 1B-C; supplemental Tables 1-2). We ranked genes that were significantly enriched in crizotinib-treated cells compared with vehicle-treated cells by their MAGeCK Robust Rank Aggregation score, thereby identifying targeted genes whose loss most likely drives crizotinib resistance (supplemental Table 3). Among enriched candidate genes, we recurrently identified 2 tyrosine phosphatases, PTPN1 and PTPN2, in all 4 studied cell lines, as well as other genes previously linked to ALK-mediated signaling in ALCL, such as EPAS1 (known as HIF-2α) in SU-DHL-115 and CDKN2A in TS and COST16 (Figure 1B; supplemental Figure 2; supplemental Table 3). PTPN1 ranked first in SU-DHL-1 and third in TS while it was lower in COST and Karpas-299; PTPN2 ranked first in TS, COST, and Karpas-299 and third in SU-DHL-1 (supplemental Table 3-4). PTPN1 is a ubiquitously expressed nonreceptor tyrosine phosphatase localized in the endoplasmic reticulum17 that controls the activation of several receptor tyrosine kinases, including the epidermal growth factor receptor (EGFR) and MET,18 and of the JAK/STAT pathway by dephosphorylating several members including TYK2, JAK2,19,20 and STAT5.21 PTPN2 is a negative regulator of T-cell receptor α/β–signaling by dephosphorylating the Src family kinases LCK and FYN,22 controls T-cell commitment in the thymus23 as well as peripheral T-cell homeostasis, and prevents T-cell responses to low-affinity self-antigens.22,24,25 PTPN2 also negatively regulates cytokine signaling by dephosphorylating members of the JAK/STAT pathway, including JAK1/3,26 STAT1,27 STAT3,28 and STAT529 in different cellular contexts. The JAK/STAT3 pathway is a critical pathway for ALK+ ALCL proliferation and survival.30-32 We thus decided to investigate the effects of PTPN1 and PTPN2 deletion in induction of resistance to crizotinib.
Genome-scale knockout screening reveals genes that meditate crizotinib resistance in anaplastic large cell lymphoma (ALCL). (A) Experimental design of the crizotinib resistance screen in ALK+ ALCL cell lines using the GecKO v2 library. (B) Genes ranked by MAGeCK Robust Rank Aggregation enrichment score in crizotinib over DMSO-treated cells, highlighting the top 10 of candidate genes acquired following specific filtering criteria based on the ranking list (see "Materials and methods"). ***FDR ≤0.01, **FDR ≤0.1, *FDR ≤ 0.2. (C) Deletion of PTPN1 or PTPN2 in ALK+ ALCL cell lines. TS and SU-DHL-1 cells were transduced with 2 different sgRNAs targeting either PTPN1 or PTPN2. Cells were treated with 80 nM or 300 nM crizotinib to evaluate changes in PTPN1 or PTPN2 expression. Western blotting was performed on cell lysates probed with the indicated antibodies. β-actin or β-tubulin were used as loading controls. One representative experiment of 4 is shown. (D) Cell viability assay was performed on TS and SU-DHL-1 WT or transduced cells with either PTPN1 or PTPN2 targeting sgRNAs undergoing crizotinib treatment. Data are represented as mean ± standard deviation (SD) of technical triplicates; **P < .01, ***P < .001, ****P < .0001, 2-way ANOVA followed by Dunnett's multiple comparisons test. (E) Growth curves of WT, PTPN1 KO, or PTPN2 KO ALK+ cells (TS and SU-DHL-1) treated with 80 nM crizotinib. Data are represented as means ± SD of technical triplicates; ****P < .0001, 2-way ANOVA followed by Tukey's multiple comparisons test. (F) PTPN1 KO or PTPN2 KO TS cells were subcutaneously injected into NSG mice. The mice were treated with crizotinib (75 mg/kg daily) by oral gavage. Data are represented as means ± SD of 4-6 mice in the control groups and 8 mice in the crizotinib-treated groups; ****P < .0001, 2-way ANOVA followed by Tukey's multiple comparisons test.
Genome-scale knockout screening reveals genes that meditate crizotinib resistance in anaplastic large cell lymphoma (ALCL). (A) Experimental design of the crizotinib resistance screen in ALK+ ALCL cell lines using the GecKO v2 library. (B) Genes ranked by MAGeCK Robust Rank Aggregation enrichment score in crizotinib over DMSO-treated cells, highlighting the top 10 of candidate genes acquired following specific filtering criteria based on the ranking list (see "Materials and methods"). ***FDR ≤0.01, **FDR ≤0.1, *FDR ≤ 0.2. (C) Deletion of PTPN1 or PTPN2 in ALK+ ALCL cell lines. TS and SU-DHL-1 cells were transduced with 2 different sgRNAs targeting either PTPN1 or PTPN2. Cells were treated with 80 nM or 300 nM crizotinib to evaluate changes in PTPN1 or PTPN2 expression. Western blotting was performed on cell lysates probed with the indicated antibodies. β-actin or β-tubulin were used as loading controls. One representative experiment of 4 is shown. (D) Cell viability assay was performed on TS and SU-DHL-1 WT or transduced cells with either PTPN1 or PTPN2 targeting sgRNAs undergoing crizotinib treatment. Data are represented as mean ± standard deviation (SD) of technical triplicates; **P < .01, ***P < .001, ****P < .0001, 2-way ANOVA followed by Dunnett's multiple comparisons test. (E) Growth curves of WT, PTPN1 KO, or PTPN2 KO ALK+ cells (TS and SU-DHL-1) treated with 80 nM crizotinib. Data are represented as means ± SD of technical triplicates; ****P < .0001, 2-way ANOVA followed by Tukey's multiple comparisons test. (F) PTPN1 KO or PTPN2 KO TS cells were subcutaneously injected into NSG mice. The mice were treated with crizotinib (75 mg/kg daily) by oral gavage. Data are represented as means ± SD of 4-6 mice in the control groups and 8 mice in the crizotinib-treated groups; ****P < .0001, 2-way ANOVA followed by Tukey's multiple comparisons test.
We deleted either PTPN1 or PTPN2 in 4 ALK+ ALCL cell lines, including 3 cell lines used for the screening approach (TS, SU-DHL-1, and COST) and 1 additional cell line (JB6) with 2 independent sgRNAs (Figure 1C; supplemental Figure 3A) and tested their sensitivity to increasing concentrations of crizotinib. Although crizotinib did not modulate PTPN1 and PTPN2 expression (Figure 1C; supplemental Figure 3A), all PTPN1 or PTPN2 KO cells became less sensitive to crizotinib (Figure 1D; supplemental Figure 3B). Notably, deletion of PTPN1 or PTPN2 led to decreased sensitivity to the second- and third-generation ALK TKIs alectinib and lorlatinib (supplemental Figure 3C-D). Prolonged treatment with crizotinib inhibited the growth of ALK+ ALCL WT cells, whereas ALK+ ALCL PTPN1 KO or PTPN2 KO cells were unaffected by crizotinib, and their growth was comparable to untreated cells (Figure 1E). To validate these results in vivo, we tested whether loss of PTPN1 or PTPN2 affected the growth response of ALK+ ALCL xenografts to crizotinib treatment. Although crizotinib induced regression of WT tumors, it did not affect the growth of PTPN1 or PTPN2 KO tumors (Figure 1F). Thus, we concluded that deletion of PTPN1 or PTPN2 in ALK+ ALCL induces resistance to multiple ALK TKIs in vitro and to crizotinib in vivo.
ALK phosphorylation is regulated by PTPN1 and PTPN2
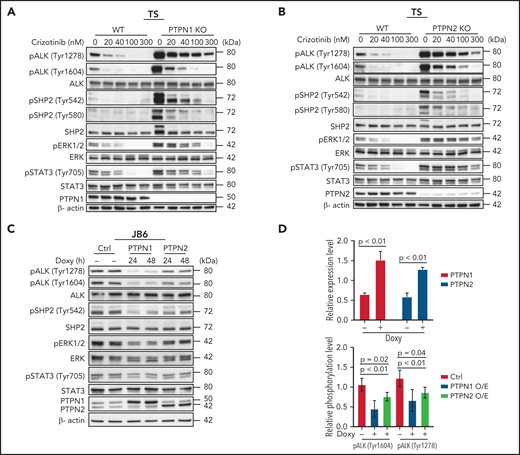
We next investigated the signaling mechanisms by which deletion of PTPN1 or PTPN2 increase resistance to crizotinib in ALK+ ALCL. ALK activates multiple downstream pathways that mediate its oncogenic signaling in ALCL, including the RAS-MEK-ERK, the JAK-STAT3, and the PI3K-AKT pathways.3,33,34 Surprisingly, we found that nucleophosmin 1 (NPM)-ALK baseline phosphorylation (at Tyr1278 and Tyr1604) was markedly increased and that complete abrogation of NPM-ALK phosphorylation was only achieved with higher doses of crizotinib for PTPN1 and PTPN2 KO compared with WT cell lines (Figure 2A-B; supplemental Figure 4A-B). Upon crizotinib withdrawal, NPM-ALK phosphorylation rebounded faster and stronger in PTPN1 and PTPN2 KO compared with WT cell lines (supplemental Figure 5). PTPN1 or PTPN2 KO cell lines also exhibited a twofold increase in phosphorylation of both of STAT3 (at Tyr705) and ERK1/2 (at Thr202/Tyr204) compared with WT cell lines (Figure 2A-B; supplemental Figure 4E). Consistently, upon withdrawal of crizotinib from the culture, phosphorylation of both STAT3 and ERK1/2 rebounded faster and stronger in PTPN1 or PTPN2 KO compared with WT cell lines, whereas AKT phosphorylation (at Ser473) showed minimal change (supplemental Figure 5A-D). Therefore, PTPN1 and PTPN2 deletion increased activation of the MAPK pathway and STAT3, in accordance with their known functions in T cells.22,23 To further validate these results, we tested whether increased expression of PTPN1 or PTPN2 was sufficient to induce dephosphorylation of NPM-ALK. We first transfected NPM-ALK into 293T cells transduced with lentiviral vectors expressing doxycycline-inducible PTPN1 or PTPN2. Phosphorylation of ALK was markedly reduced upon induction of either PTPN1 or PTPN2 overexpression (Figure 2C). Next, we generated ALCL cells with doxycycline-inducible PTPN1 or PTPN2 in 3 ALCL cell lines. A two-threefold increase of PTPN1 or PTPN2 expression was sufficient to decrease ALK phosphorylation, as well as ERK1/2 and STAT3 phosphorylation (Figure 2C-D; supplemental Figure 4C-D,F). We conclude that ALK phosphorylation is regulated by both PTPN1 and PTPN2 phosphatases in these cell lines. Finally, we investigated whether PTPN1 and PTPN2 are redundant ALK phosphatases in ALCL. To this end, we generated double KO ALCL cell lines either by deleting the PTPN2 gene in PTPN1 KO cells or by deleting PTPN1 gene in PTPN2 KO cells (supplemental Figure 6). Double PTPN1 and PTPN2 KO cells exhibited a further decrease in sensitivity to treatment with crizotinib, alectinib, or lorlatinib (supplemental Figure 3C-D).
PTPN1 KO and PTPN2 KO cells show increased phosphorylation of SHP2, STAT3 and ERK compared with WT cells following crizotinib treatment. (A-B) Western blot analysis of PTPN1 KO or PTPN2 KO TS cells treated with the indicated concentrations of crizotinib for 4 hours. Cell lysates were blotted with the indicated antibodies. β-actin was used as a loading control. One representative experiment of 3 with comparable results is shown. (C) Western blot analysis performed on JB6 cells transduced with a doxycycline-inducible lentivirus expressing PTPN1 or PTPN2. Cells were induced with doxycycline for 24 or 48 hours and collected. Cell lysates were blotted with indicated antibodies. β-actin was used as a loading control. (D) Quantification of PTPN1, PTPN2, pALK (Tyr1604), and pALK (Tyr1278) expression levels following PTPN1 or PTPN2 overexpression induced by doxycycline in JB6 as in panel C. Data are represented as means ± SD of average of the 24- and 48-hour time points. The P value was determined by multiple t tests.
PTPN1 KO and PTPN2 KO cells show increased phosphorylation of SHP2, STAT3 and ERK compared with WT cells following crizotinib treatment. (A-B) Western blot analysis of PTPN1 KO or PTPN2 KO TS cells treated with the indicated concentrations of crizotinib for 4 hours. Cell lysates were blotted with the indicated antibodies. β-actin was used as a loading control. One representative experiment of 3 with comparable results is shown. (C) Western blot analysis performed on JB6 cells transduced with a doxycycline-inducible lentivirus expressing PTPN1 or PTPN2. Cells were induced with doxycycline for 24 or 48 hours and collected. Cell lysates were blotted with indicated antibodies. β-actin was used as a loading control. (D) Quantification of PTPN1, PTPN2, pALK (Tyr1604), and pALK (Tyr1278) expression levels following PTPN1 or PTPN2 overexpression induced by doxycycline in JB6 as in panel C. Data are represented as means ± SD of average of the 24- and 48-hour time points. The P value was determined by multiple t tests.
NPM-ALK interacts with PTPN1 and PTPN2
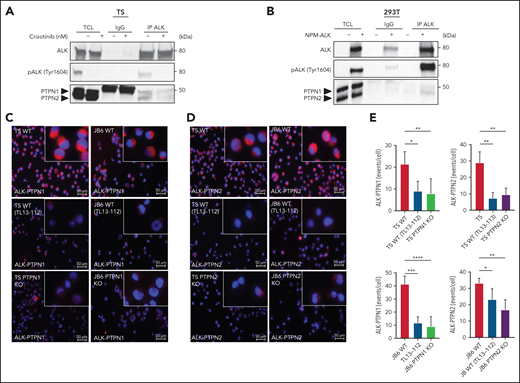
To determine whether PTPN1 or PTPN2 physically interact with NPM-ALK, we first performed coimmunoprecipitation (Co-IP) experiments in ALCL cell lines or in 293T cells transfected with an NPM-ALK construct. PTPN1 and PTPN2 weakly but specifically coimmunoprecipitated with NPM-ALK, consistent with the weak interaction observed between other phosphatases and their tyrosine kinase substrates35 (Figure 3A-B; supplemental Figure 7A). Next, we investigated the interaction of NPM-ALK with PTPN1 or PTPN2 by developing a proximity ligation assay (PLA). To control for specificity of the signals, we took advantage of the newly generated ALK degrader TL13-112 that is based on the ALK TKI ceritinib.36 Treatment of ALCL cells with TL13-112 induced a marked and rapid degradation of the NPM-ALK protein resulting in decreased STAT3 phosphorylation and MAPK activation (supplemental Figure 7B). Thus, the ALK degrader allows for a rapid downregulation of NPM-ALK in ALCL cells.
NPM-ALK interacts with PTPN1 and PTPN2. (A) Co-IP assay was performed on TS cells treated with 300 nM crizotinib for 3 hours. Co-IP was performed with anti-ALK antibody (IP ALK) or the corresponding isotype control (IgG) and analyzed by western blot probed with the indicated antibodies. One representative experiment out of 2 is shown. (B) Co-IP was performed on 293T cells transfected with NPM-ALK or the mock vector (-) and collected after 48 hours. Co-IP was performed with anti-ALK antibody (IP ALK) or the corresponding isotype control (IgG) and analyzed by western blot probed with the indicated antibodies. One representative experiment out of 2 is shown. (C-D) Representative images of in situ PLA (red) between NPM-ALK and PTPN1 (C) and NPM-ALK and PTPN2 (D) in TS and JB6 cell lines. WT TS and JB6 cells treated for 12 hours with TL13-112 100 nM were used as control to specifically reduced the anti-ALK antibody binding; PTPN1 KO and PTPN2 KO JB6 and TS cells were used as negative controls to remove anti-PTPN1 and PTPN2 antibody binding. (E) Quantification of PLA between ALK and PTPN1 and ALK and PTPN2 (C). Data are represented as mean ± SD; *P < .05, Student t test. TCL, total cell lysates.
NPM-ALK interacts with PTPN1 and PTPN2. (A) Co-IP assay was performed on TS cells treated with 300 nM crizotinib for 3 hours. Co-IP was performed with anti-ALK antibody (IP ALK) or the corresponding isotype control (IgG) and analyzed by western blot probed with the indicated antibodies. One representative experiment out of 2 is shown. (B) Co-IP was performed on 293T cells transfected with NPM-ALK or the mock vector (-) and collected after 48 hours. Co-IP was performed with anti-ALK antibody (IP ALK) or the corresponding isotype control (IgG) and analyzed by western blot probed with the indicated antibodies. One representative experiment out of 2 is shown. (C-D) Representative images of in situ PLA (red) between NPM-ALK and PTPN1 (C) and NPM-ALK and PTPN2 (D) in TS and JB6 cell lines. WT TS and JB6 cells treated for 12 hours with TL13-112 100 nM were used as control to specifically reduced the anti-ALK antibody binding; PTPN1 KO and PTPN2 KO JB6 and TS cells were used as negative controls to remove anti-PTPN1 and PTPN2 antibody binding. (E) Quantification of PLA between ALK and PTPN1 and ALK and PTPN2 (C). Data are represented as mean ± SD; *P < .05, Student t test. TCL, total cell lysates.
In ALCL lines, NPM-ALK specifically interacted with PTPN1 or PTPN2. Although NPM-ALK is localized both in the cytoplasm and in nucleus of the lymphoma cells, the signals indicating interaction were localized in the cytoplasm of the ALCL cells, consistent with the cytoplasmic localization of PTPN1 and PTPN2 (Figure 3C-E). These interaction signals were greatly diminished in ALCL cells treated with the ALK degrader or in PTPN1 or PTPN2 KO cells, confirming the specificity of the interactions (Figure 3C-E). Overall, these experiments demonstrated that NPM-ALK physically interacts with PTPN1 and PTPN2 in ALCL cells.
Next, we studied whether the NPM-ALK oncogenic signaling could directly regulate the expression of PTPN1 or PTPN2. Chromatin immunoprecipitation sequencing data analysis37 showed distinct STAT3 binding sites to both PTPN1 and PTPN2 genes that were almost completely abrogated by the blockade of ALK and STAT3 activity with crizotinib treatment (supplemental Figure 8A-B). The binding of STAT3 to the PTPN1 gene was mainly localized in the promoter region, raising the possibility that ALK and STAT3 signaling could regulate its expression. To directly test this hypothesis, we treated ALCL cells with the ALK degrader TL13-112 or the STAT3 degrader SD-36 that induced an almost complete degradation of NPM-ALK and STAT3 in ALCL cells (supplemental Figures 7B and 8C). In cells treated with the ALK or the STAT3 degrader, we observed increased transcription of PTPN1 messenger RNA (mRNA), whereas changes in PTPN2 mRNA levels were not consistent across different timepoints (supplemental Figures 7C and 8D). Thus, ALK oncogenic signaling represses PTPN1 transcription via STAT3.
PTPN1 regulates SHP2 phosphorylation in ALK+ ALCL
SHP2 (PTPN11) is a key phosphatase that contributes to oncogenic ALK signaling in lymphoma38 and in lung cancer.39 Oncogenic ALK binds to and phosphorylates the Tyr542 and Tyr580 residues at the SHP2 C-terminal tail.38 SHP2 phosphorylation at both residues is required for ERK activation in response to growth factors.40 Proteome-wide evidence for in vitro substrate preference suggests that SHP2 could be a substrate of PTPN1.41 Therefore, we investigated the effects of PTPN1 or PTPN2 deletion on SHP2 phosphorylation in ALCL cells. Deletion of PTPN1 induced a marked increase in SHP2 phosphorylation at Tyr542 and, to a lesser extent, at Tyr580 when ALCL cells were treated with increasing concentrations of crizotinib (Figure 2A; supplemental Figure 4A). Consistently, SHP2 phosphorylation rebounded faster and stronger in PTPN1 KO upon crizotinib withdrawal (supplemental Figure 5E,G). In contrast, in PTPN2 KO cell lines, we observed smaller changes in SHP2 phosphorylation at both Tyr542 and Tyr580 residues, likely reflecting the increase of NPM-ALK phosphorylation and activity (Figure 2B; supplemental Figures 4B and 5F,H). The addition of PTPN2 deletion in PTPN1 KO cells did not further increase SHP2 phosphorylation (supplemental Figure 6A,C), in contrast, the addition of PTPN1 deletion to PTPN2 KO cells strongly increased SHP2 phosphorylation (supplemental Figure 6B,D). Thus, we concluded that, in ALCL cells, phosphorylation of SHP2 is primarily regulated by PTPN1. Next, we performed PLAs to detect nanoscale interactions of SHP2 with PTPN1 in ALCL cells. The PLA assay demonstrated strong interaction signals of SHP2 with PTPN1, which were decreased in PTPN1 KO cells (supplemental Figure 9A-C), confirming a physical interaction between SHP2 and PTPN1 in ALCL cells.
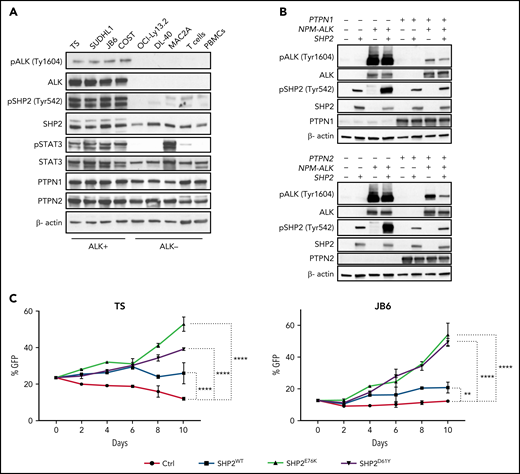
When we compared phosphorylation of SHP2 in T-cell lymphoma lines and normal T cells, we observed that SHP2 was strongly phosphorylated only in ALK+ ALCL but not in purified T cells from donors, in PBMCs, or in ALK- ALCL cell lines (Figure 4A). Although SHP2 phosphorylation was selectively identified in ALK+ ALCL cell lines, mRNA expression for SHP2, PTPN1, and PTPN2 was comparable across a spectrum of ALK+ and ALK- ALCL (supplemental Figure 9D). To investigate the contribution of SHP2 activation to ALK TKI resistance, we performed competition assays and IC50 evaluation under crizotinib treatment with ALK+ ALCL cell lines transduced with SHP2E76K or SHP2D61Y mutants that are recurrently found in hematopoietic malignancies and maintain SHP2 in an active conformation.42 Although we did not observe significant shifts in IC50 values (supplemental Table 6), ALK+ ALCL cell lines transduced with either SHP2E76K or SHP2D61Y mutants showed a significant growth advantage under crizotinib treatment compared with control groups transduced with a green fluorescent protein reporter (Figure 4C). Overall, these data show that SHP2 is selectively activated in ALK+ ALCL and that SHP2 activation partially contributes to resistance to ALK TKIs.
SHP2 phosphorylation is increased in ALK+ ALCL. (A) Western blot analysis performed on human ALK+ ALCL (TS, SU-DHL-1, JB6, and COST), ALK- ALCL (OCI-Ly13.2, DL-40, and MAC2A) and healthy donor T cells and PBMCs with the indicated antibodies. (B) Western blot analysis performed on 293T cells transduced with a doxycycline-inducible lentivirus expressing PTPN1 or PTPN2. 293T-HEK cells were transfected with NPM-ALK and/or SHP2 vectors as indicated, induced with doxycycline for 48 hours, and then collected. Cell lysates were blotted with indicated antibodies. β-Actin was used as a loading control. (C) Competitive cell growth assay performed on TS and JB6 cells transduced with a retrovirus expressing empty vector, SHP2wt, and SHP2E76K or SHP2D61Y mutant vectors cultured in presence of 40 nM crizotinib for indicated time. Data are represented as means ± SD of technical triplicates; **P = .0061 ****P < .0001, 2-way ANOVA followed by Dunnett's multiple comparisons test.
SHP2 phosphorylation is increased in ALK+ ALCL. (A) Western blot analysis performed on human ALK+ ALCL (TS, SU-DHL-1, JB6, and COST), ALK- ALCL (OCI-Ly13.2, DL-40, and MAC2A) and healthy donor T cells and PBMCs with the indicated antibodies. (B) Western blot analysis performed on 293T cells transduced with a doxycycline-inducible lentivirus expressing PTPN1 or PTPN2. 293T-HEK cells were transfected with NPM-ALK and/or SHP2 vectors as indicated, induced with doxycycline for 48 hours, and then collected. Cell lysates were blotted with indicated antibodies. β-Actin was used as a loading control. (C) Competitive cell growth assay performed on TS and JB6 cells transduced with a retrovirus expressing empty vector, SHP2wt, and SHP2E76K or SHP2D61Y mutant vectors cultured in presence of 40 nM crizotinib for indicated time. Data are represented as means ± SD of technical triplicates; **P = .0061 ****P < .0001, 2-way ANOVA followed by Dunnett's multiple comparisons test.
Inhibition of SHP2 activation potentiates the activity of ALK inhibitors in sensitive and resistant ALCL cells
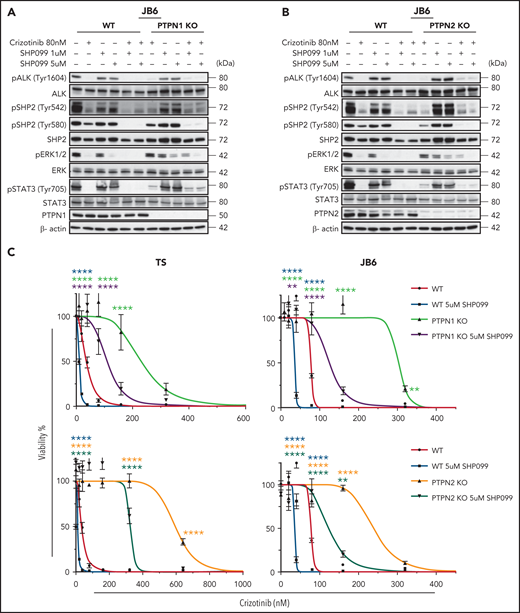
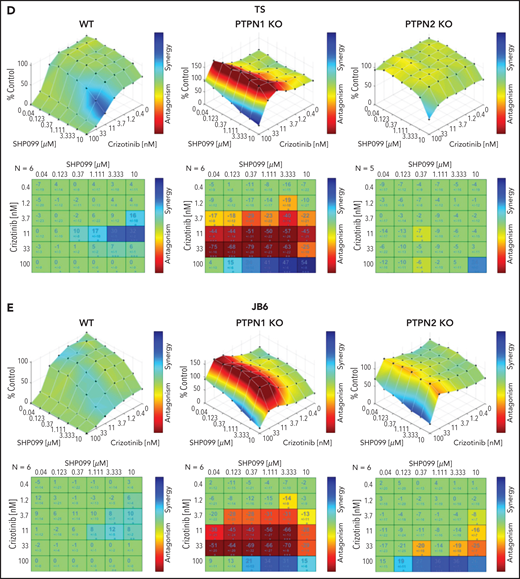
Allosteric inhibitors that block SHP2 activation by locking its autoinhibited confirmation43,44 have recently been developed and show promising activity against multiple cancers,45,46 including hematologic malignancies with mutated SHP2,47 solid tumors that develop resistance to MEK inhibitors,48 and lung cancers that become resistant to ALK TKIs.39 Given the strong and selective activation of SHP2 in ALK+ ALCL, we reasoned that inhibition of SHP2 could potentiate the efficacy of ALK TKI in both sensitive or resistant ALCL. We treated WT and PTPN1 or PTPN2 KO cell lines with combinations of crizotinib and the SHP2 inhibitor SHP099. In WT, PTPN1 or PTPN2 KO cell lines, only high concentrations (5 μM) of SHP099 alone reduced activation of the MAPK pathway as measured by phosphorylation of ERK1/2, with undetectable effects on STAT3 phosphorylation. Remarkably, addition of SHP099 to crizotinib restored the reduction of ERK1/2 phosphorylation in resistant PTPN1 or PTPN2 KO cell lines to levels comparable to WT cells treated with crizotinib alone (Figure 5A-B; supplemental Figure 10A-D). The combination of an ALK TKI with SHP099 increased sensitivity to crizotinib both in WT and PTPN1 or PTPN2 KO cell lines (Figure 5C; supplemental Figure 11A), suggesting that SHP2 inhibition could potentiate the effects of ALK TKI in both sensitive and resistant ALCL. Thus, we performed drug synergy studies to evaluate combinations of crizotinib with SHP099. Drug interaction plots showed that crizotinib and SHP099 acted synergistically to inhibit the growth of WT and PTPN1 or PTPN2 KO ALCL cells (Figure 5D-E). Intriguingly, PTPN1 KO cell fitness was dependent on optimal crizotinib concentration (∼80 nM), suggesting a likely drug holiday effect upon drug withdrawal. As previously reported,32,49 ALK+ ALCL were sensitive to STAT3 inhibition with STATTIC without synergistic effects with crizotinib (supplemental Figure 11B-C), confirming a univocal dependence of STAT3 signaling on ALK activation.
SHP2 inhibition overcomes crizotinib resistance in ALK+ ALCL. (A-B) Western blot analysis performed on WT, PTPN1 KO, and PTPN2 KO JB6 cells treated with 80 nM of crizotinib and 1 or 5 μM of SHP099 in single or in combination for 1 hour. Cell lysates were blotted with indicated antibodies. One representative experiment out of 3 is shown. (C) Dose response curves of WT, PTPN1, and PTPN2 KO TS and JB6 cells incubated in increasing concentration of crizotinib in single or combination with SHP099 inhibitor at the indicated concentration for 72 hours. Data are represented as mean ± SD of technical triplicates; **P < .01, ****P < .0001, 2-way ANOVA followed by Dunnett's multiple comparisons test. (D-E) Combenefit synergy plot and Bliss Synergy Score of combined crizotinib and SHP099 in WT, PTPN1 KO, and PTPN2 KO TS (D), or JB6 (E) cell lines. Blue: synergy, green: additivity, and red: antagonism.
SHP2 inhibition overcomes crizotinib resistance in ALK+ ALCL. (A-B) Western blot analysis performed on WT, PTPN1 KO, and PTPN2 KO JB6 cells treated with 80 nM of crizotinib and 1 or 5 μM of SHP099 in single or in combination for 1 hour. Cell lysates were blotted with indicated antibodies. One representative experiment out of 3 is shown. (C) Dose response curves of WT, PTPN1, and PTPN2 KO TS and JB6 cells incubated in increasing concentration of crizotinib in single or combination with SHP099 inhibitor at the indicated concentration for 72 hours. Data are represented as mean ± SD of technical triplicates; **P < .01, ****P < .0001, 2-way ANOVA followed by Dunnett's multiple comparisons test. (D-E) Combenefit synergy plot and Bliss Synergy Score of combined crizotinib and SHP099 in WT, PTPN1 KO, and PTPN2 KO TS (D), or JB6 (E) cell lines. Blue: synergy, green: additivity, and red: antagonism.
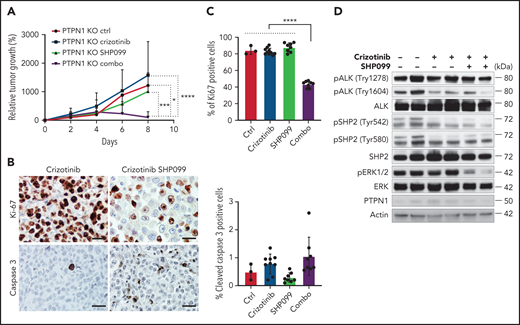
Finally, we tested whether a combination with SHP099 was able to reverse resistance to crizotinib observed in vivo in PTPN1 KO cells (Figure 1F). PTPN1 KO tumors were resistant to crizotinib alone, but the combination of crizotinib with SHP099 profoundly impaired tumor growth in vivo (Figure 6A). Cell proliferation was markedly impaired in tumors treated with a combination of crizotinib and SHP099 compared with crizotinib or SHP099 alone, whereas apoptosis was mildly increased (Figure 6B-C). Remarkably, the combination of crizotinib and SHP099 noticeably reduced ERK phosphorylation in tumors, thus confirming in vivo the synergistic activity of crizotinib and SHP099 (Figure 6D). We concluded that a combination with a SHP2 inhibitor potentiates the therapeutic activity of crizotinib against both sensitive or resistant ALCL.
A combination of crizotinib and SHP099 overcomes TKI resistance in ALK+ ALCL in vivo. (A) Growth curves of tumor xenografts of PTPN1 KO JB6 cells injected subcutaneously in NSG mice treated with crizotinib (75 mg/kg daily), SHP099 (75 mg/kg daily), or a combination of both drugs. Data are represented as means ± SD; *P < .05, ***P < .001, ****P < .0001, 2-way ANOVA followed by Tukey's multiple comparisons test; n = 3 mice for control group, n = 10 mice for crizotinib treated group, n = 8 mice for SHP099-treated group, and n = 9 mice for combo group. (B) Representative immunohistochemistry for Ki-67 and cleaved caspase-3 performed on crizotinib-treated or crizotinib + SHP099–treated PTPN1 KO tumors. Scale bar, 50 μm. (C) Quantification of Ki-67 or cleaved caspase-3+ cells in PTPN1 KO tumors treated as in Figure 6A. Significance was determined by unpaired, 2-tailed Student t test, **P < .01, ****P < .0001. (D) Western blot analysis performed on lysates from PTPN1 KO tumors obtained from mice treated with the indicated drugs shows marked downregulation of ERK phosphorylation in the crizotinib plus SHP099 treatment. Two representative tumors for each treatment are shown.
A combination of crizotinib and SHP099 overcomes TKI resistance in ALK+ ALCL in vivo. (A) Growth curves of tumor xenografts of PTPN1 KO JB6 cells injected subcutaneously in NSG mice treated with crizotinib (75 mg/kg daily), SHP099 (75 mg/kg daily), or a combination of both drugs. Data are represented as means ± SD; *P < .05, ***P < .001, ****P < .0001, 2-way ANOVA followed by Tukey's multiple comparisons test; n = 3 mice for control group, n = 10 mice for crizotinib treated group, n = 8 mice for SHP099-treated group, and n = 9 mice for combo group. (B) Representative immunohistochemistry for Ki-67 and cleaved caspase-3 performed on crizotinib-treated or crizotinib + SHP099–treated PTPN1 KO tumors. Scale bar, 50 μm. (C) Quantification of Ki-67 or cleaved caspase-3+ cells in PTPN1 KO tumors treated as in Figure 6A. Significance was determined by unpaired, 2-tailed Student t test, **P < .01, ****P < .0001. (D) Western blot analysis performed on lysates from PTPN1 KO tumors obtained from mice treated with the indicated drugs shows marked downregulation of ERK phosphorylation in the crizotinib plus SHP099 treatment. Two representative tumors for each treatment are shown.
PTPN1 and PTPN2 are downregulated in patient samples resistant to crizotinib
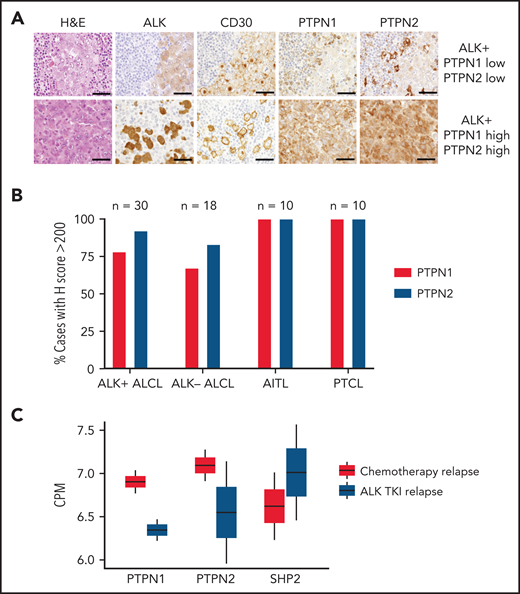
Next, we analyzed expression of PTPN1 and PTPN2 in primary human samples of ALK+ ALCL, ALK- ALCL, and other T-cell lymphomas including angioimmunoblastic T-cell lymphoma (AITL) and peripheral T-cell lymphoma not otherwise specified. The specificity of immunohistochemistry for PTPN1 and PTPN2 in formalin-fixed paraffin embedded tissues was validated using formalin-fixed WT and PTPN1 or PTPN2 KO cell lines (supplemental Figure 11D). Although the majority of ALK+ ALCL retained PTPN1 and PTPN2 expression, 12% showed reduced PTPN1, and 8% reduced PTPN2 expression (Figure 7A-B). Crizotinib or other ALK TKIs are currently in early clinical trials for the treatment of relapsed/refractory ALK+ ALCL,4,5 and only a few cases that developed resistance to crizotinib are available for analysis. We were able to analyze samples from 4 patients with ALK+ ALCL recruited to the MAPPYACTS trial (NCT02613962) who had relapsed on ALK TKIs or chemotherapy (supplemental Figure 12).50 Patient 1 harbored a missense mutation (ALK L1196M) at relapse on ALK TKI, whereas ALK was not mutated in patient 2 (also treated with ALK TKIs) as well as patients 3 and 4 that relapsed after standard chemotherapy. RNA-seq was performed for all 4 samples and showed that tumors relapsed under ALK TKIs displayed decreased expression of PTPN1 and PTPN2 concomitant with an increase in SHP2 expression compared with tumors relapsed after chemotherapy (Figure 7C), suggesting that modulation of phosphatase expression could contribute to the development of resistance to TKIs in ALK+ ALCL patients.
Patient samples resistant to ALK TKI show downregulation of PTPN1 and PTPN2 and upregulation of SHP2. (A) Representative hematoxylin-eosin and immunohistochemistry stainings of ALK, CD30, PTPN1, and PTPN2 in 1 ALK+ case expressing low PTPN1 and low PTPN2 (top) and 1 ALK+ ALCL case expressing high PTPN1 and high PTPN2 (bottom). Tumor cells are identified by ALK and CD30 stainings. High expression was determined by an H score >200. Scale bar, 100 μm. (B) Percentage of cases with high PTPN1 or PTPN2 protein expression of PTPN1 and PTPN2 evaluated by immunohistochemistry in human T-cell lymphoma subtypes: ALK+ ALCL (n = 30), ALK− ALCL (n = 18), AITL (n = 10), and peripheral T-cell lymphoma (n = 10). High expression was determined by an H score >200. (C) RNA-seq data from chemotherapy-relapsed/refractory (n = 2) and ALK TKI–resistant (n = 2) patients to evaluate mRNA expression of PTPN1, PTPN2, and PTPN11 (SHP2). ALK mutation status was analyzed by sequencing following a biopsy of relapsed lymphoma samples. The 2 patients that relapsed after chemotherapy showed WT ALK. Of the 2 patients relapsed during ALK TKI, 1 patient was WT, and 1 patient carried the L1196M mutation in ALK. See supplemental Figure 12 for treatment details. CPM, counts per million.
Patient samples resistant to ALK TKI show downregulation of PTPN1 and PTPN2 and upregulation of SHP2. (A) Representative hematoxylin-eosin and immunohistochemistry stainings of ALK, CD30, PTPN1, and PTPN2 in 1 ALK+ case expressing low PTPN1 and low PTPN2 (top) and 1 ALK+ ALCL case expressing high PTPN1 and high PTPN2 (bottom). Tumor cells are identified by ALK and CD30 stainings. High expression was determined by an H score >200. Scale bar, 100 μm. (B) Percentage of cases with high PTPN1 or PTPN2 protein expression of PTPN1 and PTPN2 evaluated by immunohistochemistry in human T-cell lymphoma subtypes: ALK+ ALCL (n = 30), ALK− ALCL (n = 18), AITL (n = 10), and peripheral T-cell lymphoma (n = 10). High expression was determined by an H score >200. (C) RNA-seq data from chemotherapy-relapsed/refractory (n = 2) and ALK TKI–resistant (n = 2) patients to evaluate mRNA expression of PTPN1, PTPN2, and PTPN11 (SHP2). ALK mutation status was analyzed by sequencing following a biopsy of relapsed lymphoma samples. The 2 patients that relapsed after chemotherapy showed WT ALK. Of the 2 patients relapsed during ALK TKI, 1 patient was WT, and 1 patient carried the L1196M mutation in ALK. See supplemental Figure 12 for treatment details. CPM, counts per million.
Discussion
Through a genome-wide loss-of-function screen, we identified PTPN1 and PTPN2 as 2 nonreceptor tyrosine phosphatases that regulate the phosphorylation of oncogenic ALK in ALCL. PTPN1 and PTPN2 were reproducibly found as the top candidate genes associated with ALK resistance in all 4 ALK+ ALCL lines tested. In contrast, our screens did not identify phosphatases that have been implicated in ALK+ ALCL biology, such as PTPN6 (also known as SHP-1) that has been reported to be an NPM-ALK phosphatase.51 Phosphatases known to regulate STAT3 phosphorylation, such as PTPRT52 and PTPRD,53 were also not identified, despite the known dependency of ALK+ ALCL on STAT3-mediated signaling30-32 and the robust expression of all of these phosphatases in ALK+ ALCL (supplemental Figure 1C). Possible explanations could be that loss of PTPRT or PTPRD does not further increase the already high STAT3 activation induced by NPM-ALK in ALCL or that a further increase in STAT3 activation would not be sufficient to compensate for the ALK signaling blockade induced by an ALK TKI.
Deletion of either PTPN1 or PTPN2 conferred resistance to multiple ALK TKIs, including crizotinib, alectinib, and lorlatinib, in all cell lines tested. As a result of these deletions, the MAPK and STAT3 pathways were hyperactivated, likely due to a combination of increased ALK activity and a direct effect on key mediators, such as SHP2, which we showed to be a target of PTPN1, but not PTPN2, in ALCL cells. Notably, we did not detect significant changes in JAK1 or JAK3 phosphorylation in PTPN1 or PTPN2 KO ALCL cells (data not shown). PTPN1 and PTPN2 appeared to be nonredundant in targeting ALK or downstream signaling substrates, as double KO cells displayed further increases in their resistance to crizotinib, similarly to the nonredundant phosphatase activity observed for PTPN1 and PTPN2 with MET.18 PTPN1 is a ubiquitously expressed phosphatase known to attenuate receptor tyrosine kinase signaling in solid tumors, including epidermal growth factor receptor (EGFR),54,55 MET,56 platelet-derived growth factor receptor54 and IGF-1R.57 Remarkably, PTPN1 has also been reported to regulate signaling of WT and mutated ALK receptors in neuroblastoma,58 and consensus target sequences in ALK have been predicted to be substrates for PTPN1 phosphatase activity.59 PTPN1 also targets other phosphorylated signaling proteins, including TYK2, JAK2,19,20 p130CAS,60 and pp60c-SRC.61 PTPN2 regulates several mediators of proximal T-cell receptor signaling that are implicated in T-cell development in the thymus and activation of peripheral T cells22-25 as well as T-cell exhaustion and anti-tumor immune response.62,63 PTPN2 also negatively regulates the JAK-STAT pathway by acting on several substrates including JAK1/3,26 STAT1,27 STAT3,28 and STAT5.29 Although EGFR and MET are not abundantly expressed in ALCL cells, platelet-derived growth factor receptor, IGF-1R, TYK2, JAK2, JAK3, p130CAS, and pp60c-SRC have all been described to mediate oncogenic ALK signaling.64-70 Therefore, it is likely that PTPN1 or PTPN2 loss in ALK+ ALCL cells might induce even broader effects beyond regulating ALK and SHP2 activity. Of note, PTPN1 loss, and to a minor extent PTPN2 loss, induced drug addiction in ALCL cells that paradoxically show enhanced growth in the presence of low doses of crizotinib (Figure 5D-E; supplemental Figure 11B-C). These data are consistent with recent findings that identified PTPN1 and PTPN2 as vulnerability targets in ALK+ ALCL in the absence of crizotinib treatment,14 implying that loss of PTPN1 or PTPN2 in untreated cells generates an excess of oncogenic signaling that decreases cell fitness.
Recurrent somatic mutations of PTPN1 are found in hematologic malignancies, including Hodgkin lymphoma, B-cell lymphoma,71,72 and breast implant–associated ALCL.73 PTPN2 is recurrently deleted or mutated in T-cell acute lymphoblastic leukemia, where it regulates ABL1 signaling,74,75 and in T-cell lymphoma.76 Loss of PTPN1 or PTPN2 expression is thought to contribute to the pathogenesis of lymphoma by regulating cytokine signaling.77 Besides genetic alterations, changes in expression levels of PTPN1 and PTPN2 also contribute to the pathogenesis of other tumors. For example, PTPN2 expression is decreased in a portion of aggressive breast cancers78 and metastatic liver cancer.79
In ALK+ ALCL cell lines and primary samples, a subset shows decreased protein expression of PTPN1 and/or PTPN2 (Figure 7A-B). Mutations or deletion of PTPN1 or PTPN2 have not been reported in ALK+ ALCL patient samples based on exome sequencing data. However, in a few ALK+ ALCL cases that developed resistance to crizotinib with RNA-seq data available after development of ALK TKI resistance, reduction of PTPN1 and PTPN2 expression was identified in patients that developed resistance to ALK TKI compared with standard multiagent chemotherapy (Figure 7C). Large cohorts of patients from ongoing clinical trials with ALK TKIs will be needed to consolidate this initial observation, including evaluation of expression levels and targeted sequencing of PTPN1 and PTPN2 in ALCL cases that develop resistance to ALK TKIs.
We showed that combination therapy of an ALK TKI with a SHP2 inhibitor could be a valuable approach, either to further potentiate crizotinib in sensitive ALCL or to overcome resistance generated by PTPN1 loss. Targeting SHP2 is a novel therapeutic approach currently under investigation in several cancer types.46,48,80 For ALK+ ALCL, this could be a particularly efficient approach because these lymphomas show strong and selective activation of SHP2 that we previously showed to depend directly on ALK activity.38 SHP2 activation is not a feature of ALK− ALCL, which is more frequently driven by activation of the JAK/STAT pathway.81 Notably, inhibition of SHP2 has been proposed as a therapeutic modality to restore sensitivity to ALK TKI in NSCLC that become resistant via bypass mechanisms driven by compensatory receptor tyrosine kinase signaling.39 Finally, it is intriguing that PTPN1 and PTPN2 loss could be implicated in some cases of ALK TKI resistance in other ALK-driven cancers, such as NSCLC, neuroblastoma, thyroid cancers, and inflammatory myofibroblastic tumors.
Acknowledgments
The authors thank Maria Stella Scalzo, Serena Germani, Jack Monahan, and Tiphaine Adam de Beaumais for their technical support in preparing histology samples and RNA samples. They thank the Italian Association for Cancer Research (AIRC) for supporting C. Mecca with AIRC Fellowship for Abroad 2019.
This work was supported by the following grants: National Institutes of Health, National Cancer Institute grant R01 CA196703-06 (R.C.); European Union Horizon 2020 Marie Sklodowska-Curie Innovative Training Network (ITN-ETN) Grant, Award 675712 for the European Research Initiative for ALK-Related Malignancies (ERIA) (N.P., S.D.T., I.M., C.G.-P., and R.C.); the MAPPYACTS trial by Institut National du Cancer grant PHRC-K14–175, the Foundation ARC grant MAPY201501241, and the Association Imagine for Margo (B.G.); the Giovanni Armenise–Harvard Foundation and the Lung Cancer Research Foundation (C.A.); and AIRC grant IG-23146 (C.V.).
Authorship
Contribution: E.K.A., C. Mecca, T.-C.C., C.A., G.L., J.H., A.P., G.M., and C. Martinengo performed experiments; E.K.A., T.-C.C., I.M., and E.P. performed mouse experiments; Q.W. performed bioinformatics analysis; E.K.A. and C.V. analyzed data; N.P., S.D.T., L.B., and B.G. provided ALK patient’s samples and data; L.M. and C.G.-P. provided sequencing data on ALCL patients; E.K.A., C.A., T.-C.C., and R.C. conceived the experiments; and E.K.A. and R.C. wrote the manuscript.
Conflict-of-interest disclosure: The authors declare no competing financial interests.
Correspondence: Roberto Chiarle, Department of Pathology, Boston Children’s Hospital, 320 Longwood Ave, Enders Building Room 1116.1, Boston, MA 02115; e-mail: roberto.chiarle@childrens.harvard.edu; and Taek-Chin Cheong, Department of Pathology, Boston Children’s Hospital, 320 Longwood Ave, Enders Building Room 1130, Boston, MA 02115; e-mail: taekchin.cheong@childrens.harvard.edu.
The Gene Expression Omnibus repository accession number for the CRISPR-Cas9 resistance screening is GSE152926 (token: cfsjkigyhponfmb). Gene expression profiling data for human T-cell lymphoma are deposited with Gene Expression Omnibus repository accession number GSE65823.82
Data may be shared after request to the corresponding author by e-mail roberto.chiarle@childrens.harvard.edu. or taekchin.cheong@childrens.harvard.edu.
The online version of this article contains a data supplement.
There is a Blood Commentary on this article in this issue.
The publication costs of this article were defrayed in part by page charge payment. Therefore, and solely to indicate this fact, this article is hereby marked “advertisement” in accordance with 18 USC section 1734.


This feature is available to Subscribers Only
Sign In or Create an Account Close Modal