

Key Points
YTHDC1 is critical for normal and malignant hematopoiesis.
The YTHDC1/m6A/MCM4/DNA replication axis plays a pivotal role in leukemogenesis.

Abstract
YTHDC1 has distinct functions as a nuclear N6-methyladenosine (m6A) reader in regulating RNA metabolism. Here we show that YTHDC1 is overexpressed in acute myeloid leukemia (AML) and that it is required for the proliferation and survival of human AML cells. Genetic deletion of Ythdc1 markedly blocks AML development and maintenance as well as self-renewal of leukemia stem cells (LSCs) in vivo in mice. We found that Ythdc1 is also required for normal hematopoiesis and hematopoietic stem and progenitor cell (HSPC) maintenance in vivo. Notably, Ythdc1 haploinsufficiency reduces self-renewal of LSCs but not HSPCs in vivo. YTHDC1 knockdown has a strong inhibitory effect on proliferation of primary AML cells. Mechanistically, YTHDC1 regulates leukemogenesis through MCM4, which is a critical regulator of DNA replication. Our study provides compelling evidence that shows an oncogenic role and a distinct mechanism of YTHDC1 in AML.
Introduction
N6-methyladenosine (m6A) is one of the most prevalent modifications of mammalian messenger RNA (mRNA).1,2 m6A regulates multiple stages of mRNA metabolism, including RNA folding, maturation, nuclear processing, and export, as well as mRNA translation and stability.3-5 RNA m6A modification is dynamically controlled by a methyltransferase complex (writer) and m6A demethylases (erasers).1,4,5 m6A sites can be recognized by a number of RNA-binding proteins, which serve as m6A readers and are the functional mediators of m6A.6-11 The YT521-B homology (YTH) domain family of proteins (YTHDF1, 2, 3, YTHDC2), insulin-like growth factor 2 mRNA-binding protein IGF2BPs (IGF2BP1, 2, 3), and proline-rich and coiled-coil-containing protein 2A (PRRC2A) are cytoplasmic proteins that bind preferentially to m6A-modified mRNA, which affects the stability and translation of mRNAs.7,8,11,12 A few nuclear RNA readers, including heterogeneous nuclear ribonucleoproteins A2/B1 (HNRNPA2B1) and YTHDC1, were identified.13 As the only YTH domain family member acting as a direct nuclear RNA m6A reader, YTHDC1 has distinct roles in regulating nuclear RNA splicing, alternative polyadenylation, nuclear export, and decay in an m6A-dependent manner.14-17 mRNA methylation has substantial roles in the regulation of cellular transitions between distinct states during development and differentiation.18 Tight regulation of m6A RNA modification is critical for normal hematopoiesis.19,20 Both Mettl3 and Mettl14 are required for hematopoietic stem cell (HSC) maintenance.21-23 As an m6A reader, Ythdf2 plays a critical role in the maintenance of HSCs by regulating the decay of transcripts responsible for HSC self-renewal. Knockout (KO) of Ythdf2 leads to expansion of functional HSCs.24-26 Notably, Alkbh5 loss only has a slight effect on HSC self-renewal under stress conditions.27
Dysregulation of dynamic m6A methylation contributes to cancer initiation, development, and maintenance, as well as cancer metastasis and relapse.28 In patients with acute myeloid leukemia (AML), METTL3 and METTL14 are upregulated and are required for AML cell survival and leukemia progression by inducing m6A deposition of its associated mRNAs.22,29,30 Interestingly, both FTO and ALKBH5 RNA demethylases are also upregulated in patients with AML and promote leukemogenesis.27,31 Ythdf2 as an m6A reader is critical for leukemia stem cell (LSC) maintenance and AML development.25 However, as a nuclear RNA reader, the precise role of YTHDC1 in leukemogenesis and normal hematopoiesis remains unknown. The current study thoroughly examines the role and mechanism of YTHDC1 as a nuclear m6A RNA reader in normal and malignant hematopoiesis.
Methods
Mice
Ythdc1fl/fl mice32 were mated to Mx1-Cre transgenic mice33 to generate Ythdc1fl/+ Mx1Cre and Ythdc1fl/fl Mx1Cre mice. Ythdc1fl/fl mice were generated from Ythdc1fl/fl chimeric mice crossing with flipper mice to excise the FRT flanked selection cassette.32 All animal research was approved by the University of Florida Institutional Animal Care and Use Committee (protocol 201810191).
Cell culture
All cell lines were purchased from American Type Culture Collection or DSMZ. CD34+ cells were purified from the umbilical cord blood. All patient samples were collected under University of Florida Institutional Review Board policies and protocols (201800547); karyotype information is listed in supplemental Table 1 (available on the Blood Web site).
Plasmid construction, retroviral infection, and colony-forming assay
Human YTHDC1 wild-type (WT) and mutant (W377A W428A)15 were cloned into PCDH vector and pLIX-402 inducible vector (41394; Addgene). Short hairpin RNA (shRNA) constructions are described in the supplemental Methods. Retroviral infection of hematopoietic cells and colony-forming assay of mouse hematopoietic stem and progenitor cells (HSPCs) and human CD34+, as well as primary AML patient samples, were performed as previously described.27,34
Transplantation
Leukemia cell transplantation and competitive repopulation were performed as we described in our previous article35 and in the supplemental Methods.
Flow cytometric analysis
LSC and HSPC population staining, in vivo 5-bromo-2′-deoxyuridine staining, HSPC quiescence, and apoptosis assay were performed as we previously described.34,36 All cells were analyzed by flow cytometry on a CytoFLEX S or CyAn benchtop analyzer (Beckman Coulter).
RNA-sequencing and real-time polymerase chain reaction analysis
Cells were harvested and RNA was extracted. Libraries were constructed and subjected to Illumina sequencers by Novogene. Quantitative real-time polymerase chain reaction (qRT-PCR) was performed on a QS3 0.2ML QPCR SYSTEM (Thermo Fisher Scientific). All primers are listed in supplemental Table 2; parts of them are from the Primer Bank database.37
MeRIP RT-qPCR and RIP RT-qPCR analysis
RNA stability assay
Cells were cultured in medium with 5 μg/mL of actinomycin D and harvested at indicted time points, which results in transcription inhibition. Gene expression was examined by using RT-qPCR, and half-life was analyzed by using GraphPad Prism5 (GraphPad Software).
Polysome profiling assay
Polysome profiling was performed as reported previously.8
DNA fiber analysis
Quantification and statistical analysis
Statistical significance was calculated by using the 2-tailed Student t test. Results are expressed as the mean ± standard deviation for at least triplicate experiments. P values were calculated by using Microsoft Excel or GraphPad Prism5, and a value of P < .05 was regarded as statistically significant. Kaplan-Meier survival curves were generated by using GraphPad Prism5.
Results
YTHDC1 is highly expressed in AML
To determine the role of YTHDC1 in AML, we first examined the YTHDC1 expression level in 2 independent data sets obtained from the Web sites GEPIA240 and BloodSpot.41 Compared with healthy donor cells, YTHDC1 exhibits significantly higher expression in AML cells (Figure 1A). In addition, we observed that YTHDC1 was expressed at a significantly higher level in various subtypes of AML compared with normal HSC controls (Figure 1B). Western blot and qRT-PCR showed that YTHDC1 exhibits ectopic high expression level in AML cells compared with CD34+ cells derived from healthy donors (Figure 1C; supplemental Figure 1A). However, YTHDC1 overexpression is not associated with a poor survival in patients with AML (P = .22).40
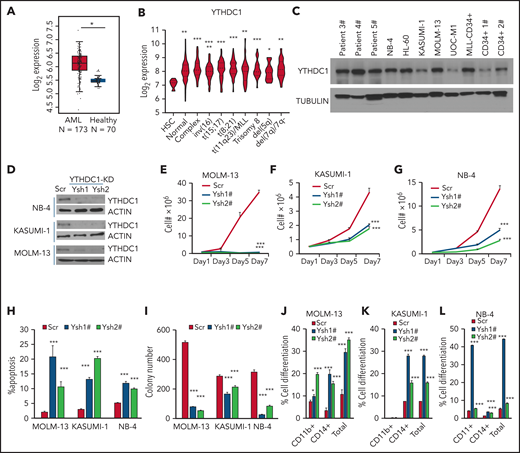
YTHDC1 regulates proliferation and survival of human AML cells in an m6A-dependent manner. (A) Comparison of the expression level of YTHDC1 in patients with primary AML vs healthy donors from The Cancer Genome Atlas database. (B) Comparison of the expression level of YTHDC1 in patients with primary AML bearing various chromosomal translocations vs those in BM HSCs collected from healthy donors. The expression values (detected by using Affymetrix exon arrays) were log2-transformed. The P value was detected by 1-way analysis of variance followed by multiple comparisons vs the HSC group. Normal: AML with normal karyotype; Complex: AML with complex karyotype. (C) Western blot showing protein level of YTHDC1 in AML patient cells, AML cell lines, and CD34+ cells from healthy donor. (D) Western blot indicating KD efficiency of YTHDC1 by specific shRNAs in NB-4, KASUMI-1, and MOLM-13 cells. Growth curve of MOLM-13 (E), KASUMI-1 (F), and NB-4 (G) cells expressed Scramble shRNA (Scr), YTHDC1 shRNA1# (Ysh1#), and YTHDC1 shRNA2# (Ysh2#); cells were counted every 2 days. (H) Flow cytometric analysis of apoptosis frequency of MOLM-13, KASUMI-1, and NB-4 cells expressed Scramble shRNA (Scr), YTHDC1 shRNA1# (Ysh1#), and YTHDC1 shRNA2# (Ysh2#). Annexin V+ indicated the apoptotic cells. (I) Colony-forming units of MOLM-13, KASUMI-1, and NB-4 cells expressed Scramble shRNA (Scr), YTHDC1 shRNA1# (Ysh1#), and YTHDC1 shRNA2# (Ysh2#). Colony number was counted 7 days after plating; 2000 cells per well for MOLM-13 and KASUMI-1 input; 1000 cells per well for NB-4 input. Flow cytometric analysis of differentiated cell frequency (CD11b+only, CD14+ only, and total) of MOLM-13 (J), KASUMI-1 (K), and NB-4 (L) cells expressed Scramble shRNA (Scr), YTHDC1 shRNA1# (Ysh1#), and YTHDC1 shRNA2# (Ysh2#). Data are presented as mean ± standard deviation; Student t test. *P < .05; **P < .01; ***P < .001.
YTHDC1 regulates proliferation and survival of human AML cells in an m6A-dependent manner. (A) Comparison of the expression level of YTHDC1 in patients with primary AML vs healthy donors from The Cancer Genome Atlas database. (B) Comparison of the expression level of YTHDC1 in patients with primary AML bearing various chromosomal translocations vs those in BM HSCs collected from healthy donors. The expression values (detected by using Affymetrix exon arrays) were log2-transformed. The P value was detected by 1-way analysis of variance followed by multiple comparisons vs the HSC group. Normal: AML with normal karyotype; Complex: AML with complex karyotype. (C) Western blot showing protein level of YTHDC1 in AML patient cells, AML cell lines, and CD34+ cells from healthy donor. (D) Western blot indicating KD efficiency of YTHDC1 by specific shRNAs in NB-4, KASUMI-1, and MOLM-13 cells. Growth curve of MOLM-13 (E), KASUMI-1 (F), and NB-4 (G) cells expressed Scramble shRNA (Scr), YTHDC1 shRNA1# (Ysh1#), and YTHDC1 shRNA2# (Ysh2#); cells were counted every 2 days. (H) Flow cytometric analysis of apoptosis frequency of MOLM-13, KASUMI-1, and NB-4 cells expressed Scramble shRNA (Scr), YTHDC1 shRNA1# (Ysh1#), and YTHDC1 shRNA2# (Ysh2#). Annexin V+ indicated the apoptotic cells. (I) Colony-forming units of MOLM-13, KASUMI-1, and NB-4 cells expressed Scramble shRNA (Scr), YTHDC1 shRNA1# (Ysh1#), and YTHDC1 shRNA2# (Ysh2#). Colony number was counted 7 days after plating; 2000 cells per well for MOLM-13 and KASUMI-1 input; 1000 cells per well for NB-4 input. Flow cytometric analysis of differentiated cell frequency (CD11b+only, CD14+ only, and total) of MOLM-13 (J), KASUMI-1 (K), and NB-4 (L) cells expressed Scramble shRNA (Scr), YTHDC1 shRNA1# (Ysh1#), and YTHDC1 shRNA2# (Ysh2#). Data are presented as mean ± standard deviation; Student t test. *P < .05; **P < .01; ***P < .001.
YTHDC1 is required for proliferation and survival of human AML cells in vitro
To determine the effects of YTHDC1 inhibition on human AML cell proliferation and survival, we knocked down YTHDC1 using YTHDC1-specific shRNAs in human AML cells. These included NB-4, KASUMI-1, and MOLM-13 cells, which are 3 common AML subtypes with abnormal cytogenetics: t(15;17), t(8;21), and t(11q23), respectively.
As determined by western blot, YTHDC1-specific shRNAs (Ysh1# and Ysh2#) inhibited YTHDC1 expression in all 3 cell lines tested (Figure 1D). The results showed that YTHDC1 knockdown (KD) led to substantially suppressed cell growth of AML cells and induced their apoptosis (Figure 1E-H; supplemental Figure 1B). Consistently, the colony-forming ability of the AML cells with YTHDC1 KD was notably decreased (Figure 1I; supplemental Figure 1C-E). Interestingly, differentiated cells, as determined by CD11b+ and CD14+, were accumulated after YTHDC1 KD (Figure 1J-L; supplemental Figure 1F). Notably, forced expression of YTHDC1 wild-type (YC1-wt) but not YTHDC1W377A/W428A (YC1-m), a mutant that has a markedly reduced m6A-binding ability15 by an inducible or noninducible lentiviral vector, promoted the cell growth and colony-forming ability of MOLM-13 and KASUMI-1 AML cells (supplemental Figure G-N). These data indicate that YTHDC1 promotes human AML cell growth in an m6A-dependent manner.
YTHDC1 is required for leukemogenesis in mice
To comprehensively understand the role of Ythdc1 in leukemogenesis, oncogenes were introduced to transform the Lin– bone marrow (BM) cells isolated from Ythdc1fl/+ (WT), Ythdc1fl/+Mx1Cre (Ythdc1 HET), and Ythdc1fl/flMx1Cre (Ythdc1 KO). The deletion of Ythdc1 was induced by 3 dosages of polyinosinic:polycytidylic acid (pIpC) injection, which was confirmed by semi-quantitative PCR analysis (Figure 2A). Four oncogenes, including MLL-AF9 [generated by t(11q23) translocation], AML1-ETO9a [generated by t(8;21) translocation], and PML-Rara [generated by t(15;17) translocation], as well as HOXA9, which is highly expressed in >50% of AMLs,42 were expressed by MSCV retroviral vectors at comparable levels in WT, HET, and KO cells (supplemental Figure 2A-D). Ythdc1 expression was confirmed in MLL-AF9–transformed WT, HET, and KO cells (supplemental Figure 2E-F). Compared with transformed WT BM cells, Ythdc1 HET and KO BM cells expressing oncogenes had a significantly lower cell growth rate in a dose-dependent manner (Figure 2B-E). Although oncogene-transformed Ythdc1 HET BM cells formed fewer colonies with a smaller size compared with the colonies generated by oncogene-transformed WT BM cells (Figure 2F-G; supplemental Figure 2G-I), oncogene-transformed Ythdc1 KO BM cells almost lost their ability to generate colonies. Genotyping showed that colonies derived from Ythdc1 KO BM cells escaped from excision induced by pIpC (supplemental Figure 2J).

Ythdc1 is required for AML development and maintenance in vivo. (A) Semi-quantitative PCR analysis of Cre and the deletion of Ythdc1, loxP-flanked Ythdc1 allele (loxP), and wild-type (wt) among genomic DNA in BM Lin– cells from Ythdc1fl/+ (WT), Ythdc1fl/+Mx1-Cre (Ythdc1 HET), and Ythdc1fl/flMx1-Cre (Ythdc1 KO) mice; deletion was induced by pIpC injection. Growth curve of Lin– BM cells from WT, Ythdc1 HET, and Ythdc1 KO mice expressed MLL-AF9 (B), AML1-ETO9a (C), PML-Rara (D), and HOXA9 (E). Colony-forming units of Lin– BM cells from WT, Ythdc1 HET, and Ythdc1 KO mice expressed MLL-AF9 (F); representative images of the colonies for the third round (WT and HET) or first round (KO) of plating are displayed (G). Cells were resuspended and replated weekly in MethoCult medium (STEMCELL Technologies) containing cytokines; scale bar, 100 μM. (H) Flow cytometric analysis of engraftment of yellow fluorescent protein (YFP)-positive cells in PB from MLL-AF9-WT (WT), MLL-AF9-Ythdc1 HET (HET), and MLL-AF9-Ythdc1 KO (KO) mice 1 month post-transplantation; n = 5 mice for each group. (I) Complete blood count analysis of WBCs in MLL-AF9-WT (WT), MLL-AF9-Ythdc1 HET (HET), and MLL-AF9-Ythdc1 KO (KO) mice 1 month post-transplantation; n = 5 mice for each group. (J) Kaplan-Meier survival analysis of MLL-AF9-WT (WT), MLL-AF9-Ythdc1 HET (HET), and MLL-AF9-Ythdc1 KO (KO) mice; n = 10 mice for the WT group, n = 8 mice for the HET group, n = 5 mice for the KO group. (K) Wright-Giemsa–stained PB and hematoxylin and eosin–stained spleen and liver of the MLL-AF9-WT (WT), MLL-AF9-Ythdc1 HET (HET), and MLL-AF9-Ythdc1 KO (KO) mice are shown. Scale bars, 20 μM for PB, 100 μM for spleen and liver. (L) Complete blood count analysis of WBCs in MLL-AF9-Ythdc1fl/fl ER Cre mice with or without TAM treatment. Mice were injected with 2 mg of TAM in 100 μL corn oil once a day for 5 consecutive days by intraperitoneal injection when the leukemia cell ratio reached up to 10% in PB; n = 5 mice for each group. (M) Flow cytometric analysis of apoptosis frequency of BM cells isolated from MLL-AF9-Ythdc1fl/fl ER Cre mice with or without TAM treatment 1 month postadministration; n = 4 mice for each group. (N) Wright-Giemsa–stained BM and PB and hematoxylin and eosin–stained liver of the MLL-AF9-Ythdc1fl/fl ER Cre mice with or without TAM treatment 1 month postadministration; Scale bars, 10 μM for BM and PB cells, 100 μM for liver sections. (O) Kaplan-Meier survival analysis of MLL-AF9-Ythdc1fl/fl ER Cre mice with or without TAM treatment; n = 10 mice for the non-treatment group, n = 6 mice for the TAM treatment group. Data are presented as mean ± standard deviation; Student t test or log-rank (Mantel-Cox) test for survival curve. *P < .05; **P < .01; ***P < .001.
Ythdc1 is required for AML development and maintenance in vivo. (A) Semi-quantitative PCR analysis of Cre and the deletion of Ythdc1, loxP-flanked Ythdc1 allele (loxP), and wild-type (wt) among genomic DNA in BM Lin– cells from Ythdc1fl/+ (WT), Ythdc1fl/+Mx1-Cre (Ythdc1 HET), and Ythdc1fl/flMx1-Cre (Ythdc1 KO) mice; deletion was induced by pIpC injection. Growth curve of Lin– BM cells from WT, Ythdc1 HET, and Ythdc1 KO mice expressed MLL-AF9 (B), AML1-ETO9a (C), PML-Rara (D), and HOXA9 (E). Colony-forming units of Lin– BM cells from WT, Ythdc1 HET, and Ythdc1 KO mice expressed MLL-AF9 (F); representative images of the colonies for the third round (WT and HET) or first round (KO) of plating are displayed (G). Cells were resuspended and replated weekly in MethoCult medium (STEMCELL Technologies) containing cytokines; scale bar, 100 μM. (H) Flow cytometric analysis of engraftment of yellow fluorescent protein (YFP)-positive cells in PB from MLL-AF9-WT (WT), MLL-AF9-Ythdc1 HET (HET), and MLL-AF9-Ythdc1 KO (KO) mice 1 month post-transplantation; n = 5 mice for each group. (I) Complete blood count analysis of WBCs in MLL-AF9-WT (WT), MLL-AF9-Ythdc1 HET (HET), and MLL-AF9-Ythdc1 KO (KO) mice 1 month post-transplantation; n = 5 mice for each group. (J) Kaplan-Meier survival analysis of MLL-AF9-WT (WT), MLL-AF9-Ythdc1 HET (HET), and MLL-AF9-Ythdc1 KO (KO) mice; n = 10 mice for the WT group, n = 8 mice for the HET group, n = 5 mice for the KO group. (K) Wright-Giemsa–stained PB and hematoxylin and eosin–stained spleen and liver of the MLL-AF9-WT (WT), MLL-AF9-Ythdc1 HET (HET), and MLL-AF9-Ythdc1 KO (KO) mice are shown. Scale bars, 20 μM for PB, 100 μM for spleen and liver. (L) Complete blood count analysis of WBCs in MLL-AF9-Ythdc1fl/fl ER Cre mice with or without TAM treatment. Mice were injected with 2 mg of TAM in 100 μL corn oil once a day for 5 consecutive days by intraperitoneal injection when the leukemia cell ratio reached up to 10% in PB; n = 5 mice for each group. (M) Flow cytometric analysis of apoptosis frequency of BM cells isolated from MLL-AF9-Ythdc1fl/fl ER Cre mice with or without TAM treatment 1 month postadministration; n = 4 mice for each group. (N) Wright-Giemsa–stained BM and PB and hematoxylin and eosin–stained liver of the MLL-AF9-Ythdc1fl/fl ER Cre mice with or without TAM treatment 1 month postadministration; Scale bars, 10 μM for BM and PB cells, 100 μM for liver sections. (O) Kaplan-Meier survival analysis of MLL-AF9-Ythdc1fl/fl ER Cre mice with or without TAM treatment; n = 10 mice for the non-treatment group, n = 6 mice for the TAM treatment group. Data are presented as mean ± standard deviation; Student t test or log-rank (Mantel-Cox) test for survival curve. *P < .05; **P < .01; ***P < .001.
To elucidate Ythdc1 function in vivo, MLL-AF9 (MA9)-WT, Ythdc1 HET, and Ythdc1 KO BM cells were transplanted into sublethally irradiated recipient C57BL/6 mice. As determined by flow cytometric analysis of peripheral blood (PB), Ythdc1 KO significantly inhibited AML cell growth in vivo (Figure 2H), and the recipient mice displayed normal white blood cell counts (WBCs) (Figure 2I) at 1 month post-transplantation. No differences were observed among WT and HET recipient mice. All MA9-WT and HET recipient mice died within 80 days (Figure 2J) with AML blast cell infiltration in the PB, liver, and spleen (Figure 2K). None of the MA9-KO recipient mice died within 100 days; no AML blast cells were detected in PB, liver, or spleen from these mice, and no hepatosplenomegaly was observed (supplemental Figure 2K-L). These data indicate that Ythdc1 is required for leukemogenesis.
We next evaluated the effects of Ythdc1 loss on established MA9-transformed leukemia in vivo. We expressed an inducible Cre–estrogen receptor (ER) fusion protein (Cre-ER)43 in MA9 Ythdc1fl/fl BM cells, followed by transplantation into recipient C57BL/6 mice. Induction of Ythdc1 deletion by 4-OHT treatment, which resulted in a significant decrease of Ythdc1 expression, markedly inhibited the proliferation and colony-forming ability of Cre-ER-MA9-Ythdc1fl/fl BM cells, whereas no influence was observed in MA9-Ythdc1fl/fl cells with 4-OHT treatment (supplemental Figure 3A-F). However, no obvious Ythdc1 deletion was detected by PCR analysis of genomic DNA from the 4-OHT–treated Cre-ER-MA9-Ythdc1fl/fl BM cell colonies, indicating that the cells which escaped from Ythdc1 excision dominated the cell population after first plating (supplemental Figure 3G).
To perform the in vivo experiments, Cre-ER-MA9-Ythdc1fl/fl cells were transplanted into sublethally irradiated C56BL/B6 recipient mice. When the AML was onset (leukemia cells >10% in PB) in recipient mice, the mice were administered tamoxifen (TAM) or vehicle control. One month post-TAM treatment, WBCs (Figure 2L), BM cellularity (supplemental Figure 3H), and spleen weights (supplemental Figure 3I) were significantly decreased, while the frequency of apoptotic BM cells (Figure 2M) was significantly increased in TAM-treated mice compared with vehicle-treated mice. TAM-treated mice had less infiltration in the PB and liver and more mature myeloid cells in BM (Figure 2N), as well as more red blood cells (RBCs) in spleen suspension (supplemental Figure 3J). Consistent with these observations, TAM-treated mice had more mature myeloid cells in BM as well as more RBCs in the BM and spleen (supplemental Figure 3K-N). Not surprisingly, AML mice administered TAM exhibited longer survival time (Figure 2O). The majority of cells isolated from the moribund TAM-treated mice were WT cells (supplemental Figure 3O), indicating that the cells which escaped from excision had a growth advantage, which finally caused the death of the mice.
Ythdc1 maintains leukemia stem cell pool
Because MLL-AF9 Ythdc1 KO BM cells hardly grew in vitro, we analyzed MA9-WT and MA9-Ythdc1 HET BM cells in vitro. Loss of one allele of Ythdc1 reduced Lin– and Lin–cKit+ cells, which had enriched LSCs in vitro (Figure 3A). In addition, an increased rate of apoptosis was detected in MA9-Ythdc1 HET Lin–c-Kit+ cells compared with MA9-WT Lin–c-Kit+ cells (Figure 3B). We next characterized the LSCs in primary recipient mice. As shown in Figure 3C, the leukemic granulocyte-monocyte progenitors (L-GMPs), which represent LSCs in MA9 leukemia mice,44 were significantly decreased in MA9-KO but not MA9-HET primary recipient mice compared with MA9-WT recipient mice. The G0 phase of the MA9-HET L-GMPs was decreased significantly compared with that of the MA9-WT L-GMPs (Figure 3D-E), suggesting that loss of 1 allele of Ythdc1 reduced the quiescence of the L-GMPs, which may impair LSC function.
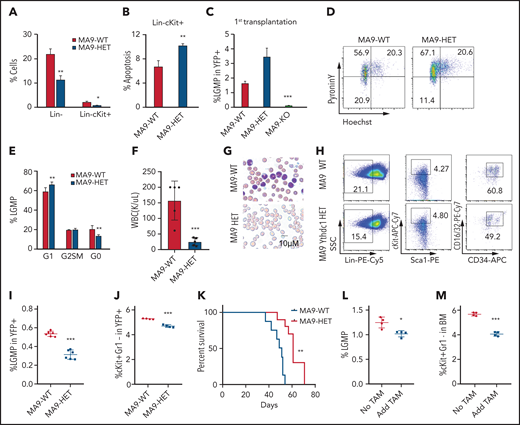
Ythdc1 plays a crucial role in leukemia stem cell maintenance. (A) Flow cytometric analysis of percentage of Lin– and Lin–cKit+ in MLL-AF9-WT and MLL-AF9-Ythdc1 HET cells, which were cultured in liquid medium with cytokines for 7 days. (B) Flow cytometric analysis of apoptosis percentage of Lin–cKit+ population from MLL-AF9-WT and MLL-AF9-Ythdc1 HET cells. (C) Flow cytometric analysis of percentage of L-GMP (Lin−c-Kit+Sca1−CD34+FcR-ϒ+) in BM cells from MLL-AF9-WT (MA9-WT), MLL-AF9-Ythdc1 HET (MA9-HET), and MLL-AF9-Ythdc1 KO (MA9-KO) leukemic mice. Mice were euthanized at the same time point, and BM cells were harvested for analysis when the mice (WT and HET) became moribund; n = 6 mice for the WT and HET groups, n = 4 mice for the KO group. (D-E) Flow cytometric analysis of LSC quiescence in MLL-AF9-WT (MA9-WT) and MLL-AF9-Ythdc1 HET (MA9-HET) primary mice. Gating strategy is shown in panel D. Cells were stained with DNA Dye Hoechst and RNA Dye Pyronin Y. Double-negative population indicated the G0 phase/quiescence; n = 6 mice for each group. (F) Complete blood cell count analysis of WBCs in the secondary recipient mice reconstituted with MLL-AF9-WT (MA9-WT) and MLL-AF9-Ythdc1 HET (MA9-HET) BM cells from the primary recipient mice; n = 5 mice for each group. (G) Wright-Giemsa–stained PB of the secondary MLL-AF9-WT (MA9-WT) and MLL-AF9-Ythdc1 HET (MA9-HET) mice. (H-I) Flow cytometric analysis of percentage of L-GMP (Lin−c-Kit+Sca1−CD34+FcR-ϒ+) in BM cells from the secondary recipient mice reconstituted with MLL-AF9-WT (MA9-WT) and MLL-AF9-Ythdc1 HET (MA9-HET) BM cells from the primary recipient mice. Gating strategy is shown in panel H. n = 6 mice for each group. (J) Flow cytometric analysis of percentage of cKit+Gr1– in BM cells of the secondary MLL-AF9-WT (MA9-WT) and MLL-AF9-Ythdc1 HET (MA9-HET) mice; n = 4 mice for each group. (K) Kaplan-Meier survival analysis of the secondary MLL-AF9-WT (MA9-WT) and MLL-AF9-Ythdc1 HET (MA9-HET) mice; n = 8 mice for the WT group, n = 10 mice for the HET group. Flow cytometric analysis of percentage of L-GMP (L) and cKit+Gr1– (M) in BM cells of the MLL-AF9-Ythdc1fl/fl ER Cre mice with or without TAM treatment; n = 4 mice for each group. Data are presented as mean ± standard deviation; Student t test or log-rank (Mantel-Cox) test for survival curve. *P < .05; **P < .01; ***P < .001.
Ythdc1 plays a crucial role in leukemia stem cell maintenance. (A) Flow cytometric analysis of percentage of Lin– and Lin–cKit+ in MLL-AF9-WT and MLL-AF9-Ythdc1 HET cells, which were cultured in liquid medium with cytokines for 7 days. (B) Flow cytometric analysis of apoptosis percentage of Lin–cKit+ population from MLL-AF9-WT and MLL-AF9-Ythdc1 HET cells. (C) Flow cytometric analysis of percentage of L-GMP (Lin−c-Kit+Sca1−CD34+FcR-ϒ+) in BM cells from MLL-AF9-WT (MA9-WT), MLL-AF9-Ythdc1 HET (MA9-HET), and MLL-AF9-Ythdc1 KO (MA9-KO) leukemic mice. Mice were euthanized at the same time point, and BM cells were harvested for analysis when the mice (WT and HET) became moribund; n = 6 mice for the WT and HET groups, n = 4 mice for the KO group. (D-E) Flow cytometric analysis of LSC quiescence in MLL-AF9-WT (MA9-WT) and MLL-AF9-Ythdc1 HET (MA9-HET) primary mice. Gating strategy is shown in panel D. Cells were stained with DNA Dye Hoechst and RNA Dye Pyronin Y. Double-negative population indicated the G0 phase/quiescence; n = 6 mice for each group. (F) Complete blood cell count analysis of WBCs in the secondary recipient mice reconstituted with MLL-AF9-WT (MA9-WT) and MLL-AF9-Ythdc1 HET (MA9-HET) BM cells from the primary recipient mice; n = 5 mice for each group. (G) Wright-Giemsa–stained PB of the secondary MLL-AF9-WT (MA9-WT) and MLL-AF9-Ythdc1 HET (MA9-HET) mice. (H-I) Flow cytometric analysis of percentage of L-GMP (Lin−c-Kit+Sca1−CD34+FcR-ϒ+) in BM cells from the secondary recipient mice reconstituted with MLL-AF9-WT (MA9-WT) and MLL-AF9-Ythdc1 HET (MA9-HET) BM cells from the primary recipient mice. Gating strategy is shown in panel H. n = 6 mice for each group. (J) Flow cytometric analysis of percentage of cKit+Gr1– in BM cells of the secondary MLL-AF9-WT (MA9-WT) and MLL-AF9-Ythdc1 HET (MA9-HET) mice; n = 4 mice for each group. (K) Kaplan-Meier survival analysis of the secondary MLL-AF9-WT (MA9-WT) and MLL-AF9-Ythdc1 HET (MA9-HET) mice; n = 8 mice for the WT group, n = 10 mice for the HET group. Flow cytometric analysis of percentage of L-GMP (L) and cKit+Gr1– (M) in BM cells of the MLL-AF9-Ythdc1fl/fl ER Cre mice with or without TAM treatment; n = 4 mice for each group. Data are presented as mean ± standard deviation; Student t test or log-rank (Mantel-Cox) test for survival curve. *P < .05; **P < .01; ***P < .001.
To further determine the function of MA9-HET LSCs, we performed secondary transplantation of BM cells from MA9-HET and MA9-WT primary recipient mice. Deletion of Ythdc1 in BM cells from primary MA9-HET recipient mice was confirmed by using PCR (supplemental Figure 4A). Six weeks’ post-transplantation, the recipient mice that received MA9-Ythdc1 HET BM cells had significantly low WBC counts (Figure 3F) and BM cellularity (supplemental Figure 4B) with reduced leukemic burden (Figure 3G) and weights of spleen and liver compared with MA9-WT recipient mice (supplemental Figure 4C-D). L-GMPs and cKit+Gr1– cells, which are also considered LSC-enriched populations,45 were decreased significantly in MA9-HET recipient mice (Figure 3H-J). MA9-Ythdc1 HET recipient mice also had more mature myeloid cells in BM and spleen and RBCs in spleen compared with MA9-WT recipient mice (supplemental Figure 4E-H). As shown in Figure 3K, MA9-Ythdc1 HET recipient mice had significantly longer survival time compared with MA9-WT mice. These data indicate that loss of one allele of Ythdc1 significantly impairs the LSC function in vivo.
Notably, Ythdc1 deletion in Cre-ER-MA9-Ythdc1fl/fl BM cells by 4-OHT in vitro reduced the frequency of Lin– and Lin–cKit+ cells (supplemental Figure 4I-K) and promoted cell apoptosis (supplemental Figure 4L) and differentiation (supplemental Figure 4M). No influence was observed when MA9-Ythdc1fl/fl cells were treated with 4-OHT (supplemental Figure 4N-Q), ruling out the possibility that 4-OHT affected the cell status. In addition, we found that TAM-treated mice had fewer L-GMPs and cKit+Gr1– cells compared with vehicle-treated recipient mice (Figure 3L-M). Together, these data suggest that Ythdc1 is required for the maintenance of MA9-LSC.
Ythdc1 is required for normal hematopoiesis and HSC maintenance
As determined by qRT-PCR, Ythdc1 has comparable expression level in HSPCs, and it is expressed at a relatively lower level in myeloid cells and RBCs than it is in B and T cells (supplemental Figure 5A). To determine the in vivo function of Ythdc1 in hematopoiesis, we generated cohorts of mice, including Ythdc1fl/+ (WT), Ythdc1fl/+Mx1Cre (Ythdc1 HET), and Ythdc1fl/flMx1Cre (Ythdc1 KO). Ythdc1 deletion was induced by pIpC, and the elimination of Ythdc1 in Ythdc1 KO cells was validated by real-time PCR and western blot (supplemental Figure 5B-E). Notably, Ythdc1 KO mice displayed markedly decreased complete blood cell counts, including WBC counts, RBC counts, and platelets (Figure 4A-D), and all mice died in 3 weeks (Figure 4E). No differences were observed between WT and Ythdc1 HET mice (Figure 4A-E). Furthermore, the Ythdc1 KO mice had a markedly lower BM cellularity than WT mice did, whereas Ythdc1 HET and WT mice had comparable BM cellularity (Figure 4F-G). Mature cells, including myeloid, B, and T cells, were decreased dramatically in Ythdc1 KO mice, whereas Ythdc1 HET and WT mice showed comparable number of mature cells (Figure 4H-J). Ythdc1 KO BM cells but not Ythdc1 HET BM significantly lost their ability to generate colonies (Figure 4K; supplemental Figure 5F). These data indicate that loss of Ythdc1 leads to rapid hematopoietic failure, but the haploinsufficiency of Ythdc1 does not affect normal hematopoiesis.
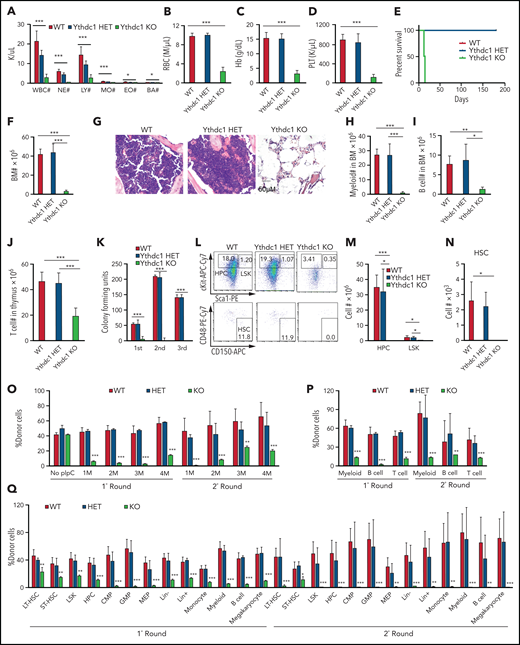
Ythdc1 is critical for normal hematopoiesis and HSC maintenance. Absolute number of WBCs, neutrophils (NE), lymphocytes (LY), monocytes (MO), eosinophils (EO), and basophils (BA) (A), as well as RBCs (B) and concentration of hemoglobin (C) and platelets (PLT) (D) in PB from Ythdc1fl/+ (WT), Ythdc1fl/+Mx1-Cre (Ythdc1 HET), and Ythdc1fl/flMx1-Cre (Ythdc1 KO) mice. Deletion was induced by pIpC injection; n = 4 mice for the WT and HET groups, n = 6 mice for the KO group. (E) Kaplan-Meier survival analysis of Ythdc1fl/+ (WT), Ythdc1fl/+Mx1-Cre (Ythdc1 HET), and Ythdc1fl/flMx1-Cre (Ythdc1 KO) mice. The graph starts from the first day after the third pIpC injection; n = 5 mice for the WT and HET groups, n = 6 mice for the KO group. (F) Total BM cell number in Ythdc1fl/+ (WT), Ythdc1fl/+Mx1-Cre (Ythdc1 HET), and Ythdc1fl/flMx1-Cre (Ythdc1 KO) mice; n = 4 mice for the WT and HET groups, n = 6 mice for the KO group. (G) Histologic analysis of hematoxylin and eosin–stained sternum from Ythdc1fl/+ (WT), Ythdc1fl/+Mx1-Cre (Ythdc1 HET), and Ythdc1fl/flMx1-Cre (Ythdc1 KO) mice; scale bar, 50 μM. Myeloid cell (Mac+Gr1+) number (H), B-cell (B220+) number (I) in BM, and T-cell number (J) in thymus in Ythdc1fl/+ (WT), Ythdc1fl/+Mx1-Cre (Ythdc1 HET), and Ythdc1fl/flMx1-Cre (Ythdc1 KO) mice; n = 4 mice for the WT and HET groups, n = 6 mice for the KO group. (K) Colony-forming units of BM cells from Ythdc1fl/+ (WT), Ythdc1fl/+Mx1-Cre (Ythdc1 HET), and Ythdc1fl/flMx1-Cre (Ythdc1 KO) mice; cells were resuspended and replated weekly in MethoCult medium containing cytokines, 10 000 cells for first input, 50 000 for second and third input. Number of LSK (M), HPCs (M), and HSC (N) in BM from Ythdc1fl/+ (WT), Ythdc1fl/+Mx1-Cre (Ythdc1 HET), and Ythdc1fl/flMx1-Cre (Ythdc1 KO) mice. Gating strategy is shown in panel L. HSC: Lin–c-Kit+Sca1+CD48–CD150+; LSK: Lin–c-Kit+Sca1+; HPC: Lin–cKit+Sca1–. n = 4 mice for the WT and HET groups, n = 3 mice for the KO group. (O) Flow cytometric analysis of the percentage of donor-derived cells in the first round and second round of recipient mice. pIpC was injected 1 month after transplantation; n = 4 mice for each group. (P) Flow cytometric analysis of the percentage of donor-derived myeloid cells, B and T cells in PB in the first round and second round of recipient mice 4 months after transplantation; n = 4 mice for each group. (Q) Flow cytometric analysis of the percentage of donor-derived cell populations in BM in the first round and second round of recipient mice, n = 4 mice for each group. Data are presented as mean ± standard deviation; Student t test or log-rank (Mantel-Cox) test for survival curve. *P < .05; **P < .01; ***P < .001. CMP, common myeloid progenitor; GMP, granulocyte-monocyte progenitor; LT-HSC, long-term HSC; MEP, megakaryocyte-erythroid progenitor; ST-HSC, short-term HSC.
Ythdc1 is critical for normal hematopoiesis and HSC maintenance. Absolute number of WBCs, neutrophils (NE), lymphocytes (LY), monocytes (MO), eosinophils (EO), and basophils (BA) (A), as well as RBCs (B) and concentration of hemoglobin (C) and platelets (PLT) (D) in PB from Ythdc1fl/+ (WT), Ythdc1fl/+Mx1-Cre (Ythdc1 HET), and Ythdc1fl/flMx1-Cre (Ythdc1 KO) mice. Deletion was induced by pIpC injection; n = 4 mice for the WT and HET groups, n = 6 mice for the KO group. (E) Kaplan-Meier survival analysis of Ythdc1fl/+ (WT), Ythdc1fl/+Mx1-Cre (Ythdc1 HET), and Ythdc1fl/flMx1-Cre (Ythdc1 KO) mice. The graph starts from the first day after the third pIpC injection; n = 5 mice for the WT and HET groups, n = 6 mice for the KO group. (F) Total BM cell number in Ythdc1fl/+ (WT), Ythdc1fl/+Mx1-Cre (Ythdc1 HET), and Ythdc1fl/flMx1-Cre (Ythdc1 KO) mice; n = 4 mice for the WT and HET groups, n = 6 mice for the KO group. (G) Histologic analysis of hematoxylin and eosin–stained sternum from Ythdc1fl/+ (WT), Ythdc1fl/+Mx1-Cre (Ythdc1 HET), and Ythdc1fl/flMx1-Cre (Ythdc1 KO) mice; scale bar, 50 μM. Myeloid cell (Mac+Gr1+) number (H), B-cell (B220+) number (I) in BM, and T-cell number (J) in thymus in Ythdc1fl/+ (WT), Ythdc1fl/+Mx1-Cre (Ythdc1 HET), and Ythdc1fl/flMx1-Cre (Ythdc1 KO) mice; n = 4 mice for the WT and HET groups, n = 6 mice for the KO group. (K) Colony-forming units of BM cells from Ythdc1fl/+ (WT), Ythdc1fl/+Mx1-Cre (Ythdc1 HET), and Ythdc1fl/flMx1-Cre (Ythdc1 KO) mice; cells were resuspended and replated weekly in MethoCult medium containing cytokines, 10 000 cells for first input, 50 000 for second and third input. Number of LSK (M), HPCs (M), and HSC (N) in BM from Ythdc1fl/+ (WT), Ythdc1fl/+Mx1-Cre (Ythdc1 HET), and Ythdc1fl/flMx1-Cre (Ythdc1 KO) mice. Gating strategy is shown in panel L. HSC: Lin–c-Kit+Sca1+CD48–CD150+; LSK: Lin–c-Kit+Sca1+; HPC: Lin–cKit+Sca1–. n = 4 mice for the WT and HET groups, n = 3 mice for the KO group. (O) Flow cytometric analysis of the percentage of donor-derived cells in the first round and second round of recipient mice. pIpC was injected 1 month after transplantation; n = 4 mice for each group. (P) Flow cytometric analysis of the percentage of donor-derived myeloid cells, B and T cells in PB in the first round and second round of recipient mice 4 months after transplantation; n = 4 mice for each group. (Q) Flow cytometric analysis of the percentage of donor-derived cell populations in BM in the first round and second round of recipient mice, n = 4 mice for each group. Data are presented as mean ± standard deviation; Student t test or log-rank (Mantel-Cox) test for survival curve. *P < .05; **P < .01; ***P < .001. CMP, common myeloid progenitor; GMP, granulocyte-monocyte progenitor; LT-HSC, long-term HSC; MEP, megakaryocyte-erythroid progenitor; ST-HSC, short-term HSC.
To investigate the effects of YTHDC1 overexpression on normal HSPCs, we expressed YTHDC1 in Lin– BM cells. As shown in supplemental Figure 5G, YTHDC1-overexpressing HSPCs grew more slowly at the first few days of cell culture compared with vector-overexpressing cells but gained significant growth advantage over vector-expressing cells after 8 days in liquid culture. Consistently, serial plating assay revealed that YTHDC1-overexpressing HSPCs also gave rise to fewer colonies at first plating but significantly more colonies at third plating compared with vector-expressing HSPCs (supplemental Figure 5H). According to flow cytometric analysis of the cells collected from first plating, we found that YTHDC1 overexpression significantly increased the frequency of Lin–cKit+ HSPCs and reduced the frequency of mature myeloid cells (supplemental Figure 5I-J). These data indicate that YTHDC1 overexpression blocks differentiation and increases proliferation/self-renewal of HSPCs, supporting an oncogenic role of YTHDC1 in HSPCs.
As expected, Ythdc1 KO mice but not Ythdc1 HET mice displayed much lower number and frequency of hematopoietic progenitor cells (HPCs), Lin–Sca1+cKit+(LSKs), and HSCs compared with WT mice (Figure 4L-N; supplemental Figure 5K-L). Two days after induction of Ythdc1 deletion by pIpC, the frequency of apoptosis was significantly increased in HSCs, LSKs, and HPCs but not Lin– from Ythdc1 KO mice compared with Ythdc1 control mice (supplemental Figure 5M). However, we failed to detect an HSC population 8 days after induction of Ythdc1 deletion by pIpC, indicating that Ythdc1 loss leads to a rapid exhaustion of HSCs. We also introduced an inducible ER Cre into Ythdc1fl/fl BM cells in vitro. Induction of Ythdc1 deletion by 4-OHT significantly increased the frequency of apoptosis of LSKs and HSCs (supplemental Figure 5N). These data suggest that Ythdc1 is required for HSPC survival.
To investigate whether Ythdc1 loss impairs HSC function in vivo, we performed the serial competitive repopulation assay. pIpC was administered 1 month after first transplantation; second transplantation was performed 4 months after pIpC injection. Before pIpC treatment, the donor-derived cells from WT, Ythdc1 HET, and KO BM cells (CD45.2+) exhibited percentages similar to those of WT competitor-derived cells (CD45.1+CD45.2+) in PB from recipient mice (supplemental Figure 5O). After pIpC administration, the percentage of Ythdc1 KO donor-derived cells (but not Ythdc1 HET donor-derived cells) was significantly decreased after the first and second transplantation (Figure 4O). Ythdc1 KO HSPCs had a significant decrease of repopulation ability in all 3 lineages, including myeloid, B, and T cells (Figure 4P). In addition, further analysis of donor-derived cell percentages in subpopulations of BMs in the first and second round of recipient mice revealed that Ythdc1 KO HSPCs gave rise to a significantly lower number of LT-HSCs and all subpopulations of myeloid progenitor cells and mature cells than Ythdc1 HET and WT HSPCs (Figure 4Q). We showed that all generated colonies (Figures 2F and 4K) derived from Ythdc1 KO cells on the first plating were escaped from pIpC-induced deletion (supplemental Figure 2J) (data not shown). Thus, the detected HSCs derived from donor KO mice in the recipient mice are likely escaped from Ythdc1 excision. These data suggest that Ythdc1 KO but not Ythdc1 haploinsufficiency has a significantly negative impact on HSC maintenance.
Ythdc1 regulates HSC function in an intrinsic manner
To determine whether Ythdc1 regulates HSC function in an intrinsic or extrinsic manner, we transplanted BM cells (CD45.2+) from WT, Ythdc1 HET, and Ythdc1 KO mice without pIpC treatment into lethally irradiated syngeneic WT recipients (CD45.1+). At 1 month post-transplantation, Ythdc1 deletion was induced by pIpC administration. The recipient mice reconstituted with Ythdc1 KO BM cells rapidly developed BM failure, as evidenced by a significant decrease in the hematopoietic parameters (supplemental Figure 6A-D), as well as BM cellularity (supplemental Figure 6E), and all mice died within 5 weeks while Ythdc1 HET and WT recipient mice survived well (supplemental Figure 6F). HPCs, LSKs, and HSCs as well as mature myeloid and B cells were all decreased dramatically in Ythdc1 KO recipient mice compared with Ythdc1 HET and WT recipient mice (supplemental Figure 6G-L), indicating that Ythdc1 intrinsically regulates hematopoiesis and HSC functions.
YTHDC1 stabilizes transcripts encoding subunits of MCM complex
We next performed RNA-sequencing analysis of MOLM-13 AML cells expressing YTHDC1 shRNAs (Ysh1# and Ysh2#) or a non-sense scrambled control shRNA. We identified 1222 differentially expressed genes (586 up and 636 down) (P < .05, fold change >1.5) upon YTHDC1 KD (Figure 5A). Pathway analysis revealed that the enriched gene sets of downregulated genes upon YTHDC1 KD were involved in the regulation of cell cycle, DNA replication, steroid biosynthesis, homologous recombination, and pyruvate metabolism, whereas the enriched gene sets of upregulated genes included pathways in lysosome, p53 signaling pathway, and apoptosis (Figure 5B-C). Among these genes, 265 genes have at least one m6A site in MOLM-13 cells29,30,46 with potential YTHDC1-binding sites according to published databases15,47 (Figure 5D). According to qRT-PCR analysis, we confirmed that MCM2, MCM4, MCM5, and RFC1, as well as CHAF1a (which play an essential role in DNA replication),48-51 were all significantly downregulated upon YTHDC1 KD in MOLM-13 cells (Figure 5E). In addition, BCL2 was also markedly downregulated in YTHDC1 KD MOLM-13 cells, providing molecular evidence supporting the role of YTHDC1 in regulating proliferation and survival of leukemia cells. MeRIP qPCR and YTHDC1RIP qPCR analyses were performed in MOLM-13 cells with or without YTHDC1 KD. The results showed that MCM2, MCM4, MCM5, and CHAF1a transcripts are m6A modified and are directly bound by YTHDC1. YTHDC1 KD did not affect m6A modification of MCM2, MCM4, MCM5, or CHAF1a transcripts (Figure 5F-I). These results suggest that YTHDC1 regulates the expression of MCM2, MCM4, MCM5, and CHAF1a genes through binding to the m6A sites on these transcripts (Figure 5F-G). However, we did not detect direct binding of YTHDC1 to BCL2 mRNA, indicating that YTHDC1 may not directly regulate BCL2 expression. Interestingly, we found that YTHDC1 KD notably reduced the stability of transcripts of MCM2, MCM4, MCM5, and CHAF1a (Figure 5J-K; supplemental Figure 7A-B). Analysis of ratio of transcripts in cell nucleus and cytoplasm by using qRT-PCR revealed that the expression ratios for nuclear and cytoplasmic MCM4 and MCM5 were not changed after YTHDC1 KD in leukemia cells (supplemental Figure 7C). We also performed polysome profiling assay in YTHDC1 KD leukemia cells. The results showed that the translation efficiency was not affected by YTHDC1 KD (supplemental Figure 7D-G). These data showed that YTHDC1 does not regulate exportation out of the nucleus as well as translation of MCM4 and MCM5 in leukemia cells.
![YTHDC1 regulates expressions of MCM genes by stabilizing their mRNAs. (A) Volcano plot showing fold changes for differentially expressed genes in MOLM-13 cells expressed Scramble shRNA, YTHDC1 shRNA1#, and YTHDC1 shRNA2#. The cells were collected 2 to 3 days after viral infection when different cell groups had a similar viability. The experiments were performed in duplicate. (B-C) The bar graph showing the pathways significantly affected in YTHDC1 KD MOLM-13 cells. Downregulated pathways are shown in panel B, and upregulated pathways are shown in panel C. RNA-sequencing analysis was performed by using Partek Flow software. (D) Analysis of RNA-sequencing data, m6A-sequencing data, and YTHDC1 RIP-sequencing data to define YTHDC1 direct target genes. (E) qRT-PCR validation of the selected target genes in MOLM-13 cells expressed Scramble shRNA (Scr), YTHDC1 shRNA1# (Ysh1#), and YTHDC1 shRNA2# (Ysh2#). (F) mRNA m6A methylation analyses of selected target genes (MCM2, MCM4, MCM5, CHAF1A, and BCL2) by MeRIP assay in MOLM-13 cells. (G) YTHDC1-RIP analyses showing YTHDC1 enrichments at mRNAs of the selected target genes in MOLM-13 cells. (H) mRNA m6A methylation analyses of selected target genes (MCM2, MCM4, MCM5, CHAF1A, and BCL2) by MeRIP assay in MOLM-13 cells expressed Scramble shRNA (Scr), YTHDC1 shRNA1# (Ysh1#), and YTHDC1 shRNA2# (Ysh2#). (I) YTHDC1-RIP analysis of YTHDC1 enrichments at mRNAs of the selected target genes in MOLM-13 cells expressed Scramble shRNA (Scr), YTHDC1 shRNA1# (Ysh1#), and YTHDC1 shRNA2# (Ysh2#). mRNA half-life of the selected target genes (MCM2 [J] and MCM4 [K]) in MOLM-13 cells with or without YTHDC1 KD. The P value was detected by 1-way analysis of variance followed by multiple comparisons vs the Scr group 16 hours after actinomycin D treatment. Data are presented as mean ± standard deviation; Student t test. Experiments were performed in triplicate and were repeated at least twice. *P < .05; **P < .01; ***P < .001.](https://ash.silverchair-cdn.com/ash/content_public/journal/blood/138/26/10.1182_blood.2021011707/4/m_bloodbld2021011707f5.png?Expires=1769810861&Signature=gQDS09hOEeCXeTjz3UXMJy6HU9yCofMoI0kOUAvg38JIheFqhmryq~NhJZWf712patDNvCL6ntY4733fcl6WedCxZhEmfo8mhWi2jhzWZorpd6WB-vcxicPzNENAVQxsetbLbAOnaUTTUeET6Wx1uUgdO0Azl6HRzYxwLdyM4bXEVKfCykjRM7WH~1SBLU1CgjWvl38XJgdfOlNEqJjJ7CLE4TTWjji2KJKT8xAIelZ8vzNF9EEW~isMHz9Ka-wfUxtma1f62Ui~0fEBIX9RbHbXT3Bjk596-HAcjoJmfEXS4Kf77GZkPFQiFXQARVppKPRUTfSW6wdLXZHAPnWYXQ__&Key-Pair-Id=APKAIE5G5CRDK6RD3PGA)
YTHDC1 regulates expressions of MCM genes by stabilizing their mRNAs. (A) Volcano plot showing fold changes for differentially expressed genes in MOLM-13 cells expressed Scramble shRNA, YTHDC1 shRNA1#, and YTHDC1 shRNA2#. The cells were collected 2 to 3 days after viral infection when different cell groups had a similar viability. The experiments were performed in duplicate. (B-C) The bar graph showing the pathways significantly affected in YTHDC1 KD MOLM-13 cells. Downregulated pathways are shown in panel B, and upregulated pathways are shown in panel C. RNA-sequencing analysis was performed by using Partek Flow software. (D) Analysis of RNA-sequencing data, m6A-sequencing data, and YTHDC1 RIP-sequencing data to define YTHDC1 direct target genes. (E) qRT-PCR validation of the selected target genes in MOLM-13 cells expressed Scramble shRNA (Scr), YTHDC1 shRNA1# (Ysh1#), and YTHDC1 shRNA2# (Ysh2#). (F) mRNA m6A methylation analyses of selected target genes (MCM2, MCM4, MCM5, CHAF1A, and BCL2) by MeRIP assay in MOLM-13 cells. (G) YTHDC1-RIP analyses showing YTHDC1 enrichments at mRNAs of the selected target genes in MOLM-13 cells. (H) mRNA m6A methylation analyses of selected target genes (MCM2, MCM4, MCM5, CHAF1A, and BCL2) by MeRIP assay in MOLM-13 cells expressed Scramble shRNA (Scr), YTHDC1 shRNA1# (Ysh1#), and YTHDC1 shRNA2# (Ysh2#). (I) YTHDC1-RIP analysis of YTHDC1 enrichments at mRNAs of the selected target genes in MOLM-13 cells expressed Scramble shRNA (Scr), YTHDC1 shRNA1# (Ysh1#), and YTHDC1 shRNA2# (Ysh2#). mRNA half-life of the selected target genes (MCM2 [J] and MCM4 [K]) in MOLM-13 cells with or without YTHDC1 KD. The P value was detected by 1-way analysis of variance followed by multiple comparisons vs the Scr group 16 hours after actinomycin D treatment. Data are presented as mean ± standard deviation; Student t test. Experiments were performed in triplicate and were repeated at least twice. *P < .05; **P < .01; ***P < .001.
YTHDC1 regulates expressions of MCM genes by stabilizing their mRNAs. (A) Volcano plot showing fold changes for differentially expressed genes in MOLM-13 cells expressed Scramble shRNA, YTHDC1 shRNA1#, and YTHDC1 shRNA2#. The cells were collected 2 to 3 days after viral infection when different cell groups had a similar viability. The experiments were performed in duplicate. (B-C) The bar graph showing the pathways significantly affected in YTHDC1 KD MOLM-13 cells. Downregulated pathways are shown in panel B, and upregulated pathways are shown in panel C. RNA-sequencing analysis was performed by using Partek Flow software. (D) Analysis of RNA-sequencing data, m6A-sequencing data, and YTHDC1 RIP-sequencing data to define YTHDC1 direct target genes. (E) qRT-PCR validation of the selected target genes in MOLM-13 cells expressed Scramble shRNA (Scr), YTHDC1 shRNA1# (Ysh1#), and YTHDC1 shRNA2# (Ysh2#). (F) mRNA m6A methylation analyses of selected target genes (MCM2, MCM4, MCM5, CHAF1A, and BCL2) by MeRIP assay in MOLM-13 cells. (G) YTHDC1-RIP analyses showing YTHDC1 enrichments at mRNAs of the selected target genes in MOLM-13 cells. (H) mRNA m6A methylation analyses of selected target genes (MCM2, MCM4, MCM5, CHAF1A, and BCL2) by MeRIP assay in MOLM-13 cells expressed Scramble shRNA (Scr), YTHDC1 shRNA1# (Ysh1#), and YTHDC1 shRNA2# (Ysh2#). (I) YTHDC1-RIP analysis of YTHDC1 enrichments at mRNAs of the selected target genes in MOLM-13 cells expressed Scramble shRNA (Scr), YTHDC1 shRNA1# (Ysh1#), and YTHDC1 shRNA2# (Ysh2#). mRNA half-life of the selected target genes (MCM2 [J] and MCM4 [K]) in MOLM-13 cells with or without YTHDC1 KD. The P value was detected by 1-way analysis of variance followed by multiple comparisons vs the Scr group 16 hours after actinomycin D treatment. Data are presented as mean ± standard deviation; Student t test. Experiments were performed in triplicate and were repeated at least twice. *P < .05; **P < .01; ***P < .001.
MCM4 mRNA is a key downstream effector of YTHDC1 in regulating leukemogenesis
Analysis of a public database41 revealed that MCM4 is highly expressed in various subtypes of AML compared with normal HSC controls (Figure 6A). MCM4 expression level correlates with YTHDC1 expression level (P < .003) in patients with AML (supplemental Figure 8A). In addition, we showed that YTHDC1 KD resulted in downregulation of MCM4 in primary leukemia cells from patients with AML (supplemental Figure 8B). To determine whether MCM4 serves as an important downstream effector of YTHDC1 in leukemogenesis, we examined the consequences of MCM4 KD in AML cells. Similar to YTHDC1 KD, MCM4 KD by MCM4-specific shRNAs (supplemental Figure 8C) suppressed cell growth and colony-forming ability, while promoting cell apoptosis and differentiation of MOLM-13 cells (Figure 6B-E). Notably, forced expression of YTHDC1 markedly upregulated MCM4 expression, whereas YTHDC1W377A/W428A (YC1-m) with a reduced m6A-binding activity had a moderate effect on MCM4 expression in MOLM-13 cells (Figure 6F). In addition, YTHDC1 but not YTHDC1W377A/W428A overexpression significantly increased MCM4 mRNA half-life (Figure 6G), suggesting that YTHDC1 regulates MCM4 expression by stabilizing its mRNA in an m6A-dependent manner.

MCM4 mediates YTHDC1 functions in AML cells. (A) Comparison of the expression level of MCM4 in patients with primary AML bearing various chromosomal translocations vs those in BM HSCs collected from healthy donors. The expression values (detected by using Affymetrix exon arrays) were log2-transformed. The P value was detected by 1-way analysis of variance followed by multiple comparisons vs the HSC group. Normal: AML with normal karyotype; Complex: AML with complex karyotype. (B) Growth curve of MOLM-13 cells expressed Scramble shRNA (Scr), MCM4 shRNA1# (M4sh1#), and MCM4 shRNA2# (M4sh2#); cells were counted every 2 days. The P value was detected by 1-way analysis of variance followed by multiple comparisons vs the Scr group at day 7. (C) Flow cytometric analysis of apoptosis frequency of MOLM-13 cells expressed Scramble shRNA (Scr), MCM4 shRNA1# (M4sh1#), and MCM4 shRNA2# (M4sh2#). Annexin V+ indicated the apoptotic cells. (D) Flow cytometric analysis of differentiated cell frequency of MOLM-13 expressed Scramble shRNA (Scr), MCM4 shRNA1# (M4sh1#), and MCM4 shRNA2# (M4sh2#). (E) Colony-forming units of MOLM-13 cells expressed Scramble shRNA (Scr), MCM4 shRNA1# (M4sh1#), and MCM4 shRNA2# (M4sh2#). Colony number was counted after 7 days of plating. (F) qRT-PCR analysis of MCM4 expression in MOLM-13 cells expressed empty vector control, YTHDC1 WT (YTHDC1 wt), or YTHDC1 W377A W428A mutant (YTHDC1 mut). (G) The mRNA half-life of MCM4 in MOLM-13 cells expressed empty vector control, YTHDC1 WT (YTHDC1 wt), or YTHDC1 W377A W428A mutant (YTHDC1 mut). The P value was detected by using the Student t test between vector and YTHDC1 wt or YTHDC1 wt and mut 8 hours after actinomycin D treatment. (H) Cell growth curve of MOLM-13 cells expressed Scramble shRNA (Scr) or YTHDC1 shRNA2# (Ysh2#) with or without MCM4 expression. The P value was detected by using the Student t test between Scr+vector and Ysh2#+vector or Ysh2#+vector and Ysh2#+MCM4 at day 7. (I) Flow cytometric analysis of apoptosis frequency of MOLM-13 cells expressed Scramble shRNA (Scr) or YTHDC1 shRNA2# (Ysh2#) with or without MCM4 expression. (J) Flow cytometric analysis of differentiated cell frequency of MOLM-13 cells expressed Scramble shRNA (Scr) or YTHDC1 shRNA2# (Ysh2#) with or without MCM4 expression. (K) Colony-forming units of MOLM-13 cells expressed Scramble shRNA (Scr) or YTHDC1 shRNA2# (Ysh2#) with or without MCM4 expression. (L-M) Flow cytometric analysis of cell cycle in MOLM-13 cells expressed Scramble shRNA (Scr) or YTHDC1 shRNA2# (Ysh2#) with or without MCM4 expression. Gating strategy is shown in panel L. Cells were stained with 5-bromo-2′-deoxyuridine (BrdU) (to determine the S phase) and 4′,6-diamidino-2-phenylindole (DAPI) (to determine the DNA content). (N) Flow cytometric analysis of the percentage of p-γH2AX+ cells in MOLM-13 cells expressed Scramble shRNA (Scr) or YTHDC1 shRNA2# (Ysh2#) with or without MCM4 expression. (O) Western blot analysis of p-γH2AX expression in MOLM-13 cells expressed Scramble shRNA (Scr), YTHDC1 shRNA1# (Ysh1#), or YTHDC1 shRNA2# (Ysh2#) with or without MCM4 expression. ACTIN was served as an inner control. (P-Q) Flow cytometric analysis of the percentage of PCNA+ cells in MOLM-13 cells expressed Scramble shRNA (Scr) or YTHDC1 shRNA2# (Ysh2#) with or without MCM4 expression. Gating strategy is shown in panel P. Data are presented as mean ± standard deviation; Student t test. **P < .01; ***P < .001. (R) DNA fiber assay. Distributions of the iodo-deoxyuridine (IdU) track length were determined on IdU-labeled DNA fibers from MOLM-13 cells expressed Scramble shRNA (Scr) or YTHDC1 shRNA2# (Ysh2#) with or without MCM4 expression. (S) The IdU track lengths of 3 different groups were compared. (****P < .0001, Mann-Whitney U test). Mean lines in the boxes indicate the median value of at least 150 tracks per experimental condition. Scale bar, 5 μm. (T) DNA fiber assay. Distributions of the IdU track length were determined on IdU-labeled DNA fibers from KASUMI-1 cells expressed Scramble shRNA (Scr) or YTHDC1 shRNA2# (Ysh2#) with or without MCM4 expression. (U) The IdU track length of 3 different groups were compared. ****P < .0001, Mann-Whitney U test. Mean lines in the boxes indicate the median value of at least 80 tracks per experimental condition. Scale bar, 5 μm.
MCM4 mediates YTHDC1 functions in AML cells. (A) Comparison of the expression level of MCM4 in patients with primary AML bearing various chromosomal translocations vs those in BM HSCs collected from healthy donors. The expression values (detected by using Affymetrix exon arrays) were log2-transformed. The P value was detected by 1-way analysis of variance followed by multiple comparisons vs the HSC group. Normal: AML with normal karyotype; Complex: AML with complex karyotype. (B) Growth curve of MOLM-13 cells expressed Scramble shRNA (Scr), MCM4 shRNA1# (M4sh1#), and MCM4 shRNA2# (M4sh2#); cells were counted every 2 days. The P value was detected by 1-way analysis of variance followed by multiple comparisons vs the Scr group at day 7. (C) Flow cytometric analysis of apoptosis frequency of MOLM-13 cells expressed Scramble shRNA (Scr), MCM4 shRNA1# (M4sh1#), and MCM4 shRNA2# (M4sh2#). Annexin V+ indicated the apoptotic cells. (D) Flow cytometric analysis of differentiated cell frequency of MOLM-13 expressed Scramble shRNA (Scr), MCM4 shRNA1# (M4sh1#), and MCM4 shRNA2# (M4sh2#). (E) Colony-forming units of MOLM-13 cells expressed Scramble shRNA (Scr), MCM4 shRNA1# (M4sh1#), and MCM4 shRNA2# (M4sh2#). Colony number was counted after 7 days of plating. (F) qRT-PCR analysis of MCM4 expression in MOLM-13 cells expressed empty vector control, YTHDC1 WT (YTHDC1 wt), or YTHDC1 W377A W428A mutant (YTHDC1 mut). (G) The mRNA half-life of MCM4 in MOLM-13 cells expressed empty vector control, YTHDC1 WT (YTHDC1 wt), or YTHDC1 W377A W428A mutant (YTHDC1 mut). The P value was detected by using the Student t test between vector and YTHDC1 wt or YTHDC1 wt and mut 8 hours after actinomycin D treatment. (H) Cell growth curve of MOLM-13 cells expressed Scramble shRNA (Scr) or YTHDC1 shRNA2# (Ysh2#) with or without MCM4 expression. The P value was detected by using the Student t test between Scr+vector and Ysh2#+vector or Ysh2#+vector and Ysh2#+MCM4 at day 7. (I) Flow cytometric analysis of apoptosis frequency of MOLM-13 cells expressed Scramble shRNA (Scr) or YTHDC1 shRNA2# (Ysh2#) with or without MCM4 expression. (J) Flow cytometric analysis of differentiated cell frequency of MOLM-13 cells expressed Scramble shRNA (Scr) or YTHDC1 shRNA2# (Ysh2#) with or without MCM4 expression. (K) Colony-forming units of MOLM-13 cells expressed Scramble shRNA (Scr) or YTHDC1 shRNA2# (Ysh2#) with or without MCM4 expression. (L-M) Flow cytometric analysis of cell cycle in MOLM-13 cells expressed Scramble shRNA (Scr) or YTHDC1 shRNA2# (Ysh2#) with or without MCM4 expression. Gating strategy is shown in panel L. Cells were stained with 5-bromo-2′-deoxyuridine (BrdU) (to determine the S phase) and 4′,6-diamidino-2-phenylindole (DAPI) (to determine the DNA content). (N) Flow cytometric analysis of the percentage of p-γH2AX+ cells in MOLM-13 cells expressed Scramble shRNA (Scr) or YTHDC1 shRNA2# (Ysh2#) with or without MCM4 expression. (O) Western blot analysis of p-γH2AX expression in MOLM-13 cells expressed Scramble shRNA (Scr), YTHDC1 shRNA1# (Ysh1#), or YTHDC1 shRNA2# (Ysh2#) with or without MCM4 expression. ACTIN was served as an inner control. (P-Q) Flow cytometric analysis of the percentage of PCNA+ cells in MOLM-13 cells expressed Scramble shRNA (Scr) or YTHDC1 shRNA2# (Ysh2#) with or without MCM4 expression. Gating strategy is shown in panel P. Data are presented as mean ± standard deviation; Student t test. **P < .01; ***P < .001. (R) DNA fiber assay. Distributions of the iodo-deoxyuridine (IdU) track length were determined on IdU-labeled DNA fibers from MOLM-13 cells expressed Scramble shRNA (Scr) or YTHDC1 shRNA2# (Ysh2#) with or without MCM4 expression. (S) The IdU track lengths of 3 different groups were compared. (****P < .0001, Mann-Whitney U test). Mean lines in the boxes indicate the median value of at least 150 tracks per experimental condition. Scale bar, 5 μm. (T) DNA fiber assay. Distributions of the IdU track length were determined on IdU-labeled DNA fibers from KASUMI-1 cells expressed Scramble shRNA (Scr) or YTHDC1 shRNA2# (Ysh2#) with or without MCM4 expression. (U) The IdU track length of 3 different groups were compared. ****P < .0001, Mann-Whitney U test. Mean lines in the boxes indicate the median value of at least 80 tracks per experimental condition. Scale bar, 5 μm.
To determine whether MCM4 largely mediates YTHDC1 function in AML cells, we expressed MCM4 in YTHDC1 KD MOLM-13 cells using a lentivirus. MeRIP assay showed that exogenously expressed MCM4 transcripts had an m6A modification (supplemental Figure 8D). As shown in Figure 6H-K and supplemental Figure 8E, restoration of MCM4 expression fully reversed YTHDC1 KD–induced growth inhibition, cell apoptosis and differentiation, and the colony-forming ability defect in MOLM-13 cells. MCM4 is a key subunit of the MCM2-7 complex, a putative replicative helicase involved in formation of replication forks, and lack of MCM4 causes cell cycle arrest before S-phase entry as well as DNA damage.52-54 Interestingly, we found that YTHDC1 KD significantly blocked G1/S transition and prevented S-phase entry (Figure 6L-M), and induced DNA damage, as determined by an increased expression of γH2AX (Figure 6N-O; supplemental Figure 8F). Proliferation cell nuclear antigen (PCNA) is a key cofactor participating in DNA replication and nonreplicative DNA synthesis.55 We found that the percentage of PCNA-positive cells was significantly reduced in YTHDC1 KD cells, suggesting that YTHDC1 KD inhibited cell proliferation (Figure 6P-Q). Notably, restoration of MCM4 expression rescued YTHDC1 KD–induced blockage of cell proliferation and DNA damage (Figure 6L-Q). Not surprisingly, MCM4 can also partially rescue the YTHDC KD–induced defects in cell proliferation and survival of KASUMI-1 and mouse AML cells (supplemental Figure 8G-Q). To determine the effect of YTHDC1 on DNA replication, we performed a DNA fiber assay.38 As shown in Figure 6R-U, the average DNA fiber length was significantly shorter in YTHDC1 KD MOLM-13 and KASUMI-1 cells compared with the control cells, suggesting that YTHDC1 KD slows DNA replication. Notably, MCM4 re-expression partially rescued YTHDC1 KD–induced blockage of DNA replication. Collectively, these data suggest that YTHDC1 is involved in DNA replication by regulating MCM4 expression.
To investigate whether MCM4, MCM5, or Chaf1a mediates the function of YTHDC1 in HSPCs, we re-expressed MCM4, MCM5, and Chaf1a in Ythdc1 KO Lin– BM cells. To our surprise, none of these genes rescued functional defects of Ythdc1 KO HSPCs in proliferation and colony-forming ability (supplemental Figure 8R-T).
YTHDC1 KD inhibits growth of primary AML cells from patients while sparing human normal HSPCs
We next determined the possibility of YTHDC1 serving as a therapeutic target in patients with AML. We assessed the effects of YTHDC1 KD on primary cells derived from 4 patients with AML as well as CD34+ cells derived from healthy individuals. In line with the results in MOLM-13, YTHDC1 KD in primary AML cells caused a dramatic inhibition of cell proliferation (Figure 7A-D; supplemental Figure 9A) but only a slight inhibition of growth of CD34+ cells (Figure 7E). YTHDC1 KD significantly increased the apoptotic rate of the LSC-enriched population (CD34+) as well as total primary AML cells but not CD34+ cells from healthy individuals (Figure 7F; supplemental Figure 9B-C). Moreover, YTHDC1 KD had a significantly higher inhibitory effect on the colony-forming ability of primary AML cells than that of CD34+ cells from healthy individuals (Figure 7G). Notably, YTHDC1 KD markedly increased the frequency of CD11b+CD34– and reduced the frequency of the LSC-enriched cell population (CD11b–CD34+) in YTHDC1 KD primary AML cells while marginally affecting the frequency of CD11b in CD34+ cells from healthy donors (Figure 7H-L). As shown by morphology of the cells, there were more differentiated cells with a reduced nucleus to cytoplasm ratio in YTHDC1 KD AML cells compared with the control AML cells (Figure 7M). Consistent with observations in mouse AML cells, these results suggest that YTHDC1 KD induces differentiation of primary AML cells but has no effect on differentiation of CD34+ cells from healthy individuals. To determine the effect of YTHDC1 KD on growth of human AML cells in vivo, MOLM-13 AML cells expressed with YTHDC1 shRNAs were transplanted into irradiated NSG mice (NOD scid γ mouse). As shown in Figure 7N-O, the recipient mice reconstituted with YTHDC1 KD MOLM-13 cells had a significantly reduced leukemia burden and survived for a longer time compared with the mice transplanted with Scramble expressed MOLM-13 cells.

YTHDC1 KD inhibits leukemic potentials of human primary AML cells. Growth curve of primary AML cells from 4 different patients (A-D) and CD34+ cells (E) from healthy donors expressed Scramble shRNA (Scr), YTHDC1 shRNA1# (Ysh1#), and YTHDC1 shRNA2# (Ysh2#). CD34+ cells are mixed cells from 3 healthy donors. The experiments were performed in triplicate. The P value was detected by 1-way analysis of variance followed by multiple comparisons vs the Scr group at day 10 (for patient cells) or day 7 (for CD34+ cells). (F) Flow cytometric analysis of apoptosis frequency of CD34+ cells in patients with AML and CD34+ cells from healthy donor expressed Scramble shRNA (Scr), YTHDC1 shRNA1# (Ysh1#), and YTHDC1 shRNA2# (Ysh2#). (G) Colony-forming units of AML patient cells and CD34+ cells from healthy donor expressed Scramble shRNA (Scr), YTHDC1 shRNA1# (Ysh1#), and YTHDC1 shRNA2# (Ysh2#). A total of 50 000 cells per well were used for patient cell input and 2500 cells per well for healthy donor CD34+ cell input. Flow cytometric analysis of differentiated cell frequency of AML patient cells (H-J) and CD34+ (L) cells from healthy donor expressed Scramble shRNA (Scr), YTHDC1 shRNA1# (Ysh1#), and YTHDC1 shRNA2# (Ysh2#). (K) Gating strategy. (M) Wright-Giemsa–stained AML cell morphology, with differentiated cells indicated by red arrows; bar = 20 μM. (N) Flow cytometric analysis of the percentage of human leukemia cells (CD45+) in NSG mice–transplanted MOLM-13 cells expressed Scramble shRNA (Scr), YTHDC1 shRNA1# (Ysh1#), and YTHDC1 shRNA2# (Ysh2#). (O) Kaplan-Meier survival analysis of NSG mice–transplanted MOLM-13 cells expressed Scramble shRNA (Scr), YTHDC1 shRNA1# (Ysh1#), and YTHDC1 shRNA2# (Ysh2#). Data are presented as mean ± standard deviation; Student t test or log-rank (Mantel-Cox) test for survival curve. Experiments were performed in triplicate. *P < .05; **P < .01; ***P < .001.
YTHDC1 KD inhibits leukemic potentials of human primary AML cells. Growth curve of primary AML cells from 4 different patients (A-D) and CD34+ cells (E) from healthy donors expressed Scramble shRNA (Scr), YTHDC1 shRNA1# (Ysh1#), and YTHDC1 shRNA2# (Ysh2#). CD34+ cells are mixed cells from 3 healthy donors. The experiments were performed in triplicate. The P value was detected by 1-way analysis of variance followed by multiple comparisons vs the Scr group at day 10 (for patient cells) or day 7 (for CD34+ cells). (F) Flow cytometric analysis of apoptosis frequency of CD34+ cells in patients with AML and CD34+ cells from healthy donor expressed Scramble shRNA (Scr), YTHDC1 shRNA1# (Ysh1#), and YTHDC1 shRNA2# (Ysh2#). (G) Colony-forming units of AML patient cells and CD34+ cells from healthy donor expressed Scramble shRNA (Scr), YTHDC1 shRNA1# (Ysh1#), and YTHDC1 shRNA2# (Ysh2#). A total of 50 000 cells per well were used for patient cell input and 2500 cells per well for healthy donor CD34+ cell input. Flow cytometric analysis of differentiated cell frequency of AML patient cells (H-J) and CD34+ (L) cells from healthy donor expressed Scramble shRNA (Scr), YTHDC1 shRNA1# (Ysh1#), and YTHDC1 shRNA2# (Ysh2#). (K) Gating strategy. (M) Wright-Giemsa–stained AML cell morphology, with differentiated cells indicated by red arrows; bar = 20 μM. (N) Flow cytometric analysis of the percentage of human leukemia cells (CD45+) in NSG mice–transplanted MOLM-13 cells expressed Scramble shRNA (Scr), YTHDC1 shRNA1# (Ysh1#), and YTHDC1 shRNA2# (Ysh2#). (O) Kaplan-Meier survival analysis of NSG mice–transplanted MOLM-13 cells expressed Scramble shRNA (Scr), YTHDC1 shRNA1# (Ysh1#), and YTHDC1 shRNA2# (Ysh2#). Data are presented as mean ± standard deviation; Student t test or log-rank (Mantel-Cox) test for survival curve. Experiments were performed in triplicate. *P < .05; **P < .01; ***P < .001.
Discussion
Here, we report a critical role of YTHDC1 in normal hematopoiesis and AML pathogenesis. Previous studies showed that reduced m6A methylation level as a consequence of Mettl3/Mettl14 depletion has a moderately negative impact on HSC self-renewal, whereas Alkbh5 deletion–caused m6A upregulation does not affect HSC maintenance in the steady state.21-23,27,29,56 Loss of Ythdf2 results in HSC and myeloid expansion.24-26 In contrast, we showed that complete loss of Ythdc1 led to BM failure due to a rapid HSC exhaustion in mice (Figure 4E, L, N; supplemental Figure 5L-M), whereas Ythdc1 haploinsufficiency did not affect the survival and repopulation of HSCs in mice. In addition, YTHDC1 KD did not significantly affect human CD34+ HSPC survival and proliferation either. These data suggest that Ythdc1 is critical for HSC maintenance and normal hematopoiesis. Complete deletion of Ythdc1 is lethal for HSPCs, and a minimal amount of YTHDC1/Ythdc1 may be sufficient for HSPC survival. However, whether YTHDC1/Ythdc1 has a different or identical role in the maintenance of human and mouse HSPCs remains to be determined by future studies. YTHDC1, as an m6A reader, mediates the functional role of m6A methylation of nuclear RNAs. Our data show the significance of nuclear RNA m6A modification in normal hematopoiesis and HSC maintenance.
We found that YTHDC1 is upregulated in patients with AML and is required for leukemogenesis. However, we failed to detect upregulation of Ythdc1 in MLL-AF9, PML-RARA, or AE9a transformed murine Lin– BM cells a few days after infection (data not shown), suggesting that these oncogenes may not directly upregulate Ythdc1 gene in mouse HSPCs. Our results showed that YTHDC1 regulates DNA replication, survival, and differentiation of AML cells, at least partially, through controlling the expression of the MCM4 gene, which encodes the key component of the MCM complex, in an m6A-dependent manner. MCM4 plays a vital role in DNA replication and S-phase entry.53,54 Upregulation of MCM4 was observed in proliferating cells, which retain the potential to become malignant. Loss of MCM4 causes DNA damage and genome instability, thereby potentially promoting development of cancer.52,57 High MCM4 expression was founded in a variety of solid cancers, including lung triple-negative adenocarcinomas,58 laryngeal squamous cell carcinoma,59 ovarian cancer,60 and cervical cancer.61 MCM4 loss could significantly inhibit laryngeal squamous cell carcinoma cell proliferation and induce apoptosis.59 Mutations of MCM4 have been found to be associated with various cancers.62 Here, we show that MCM4 mediates the role of YTHDC1 in leukemogenesis by regulating DNA replication and repair and cell differentiation in AML cells. In addition to MCM4, YTHDC1 regulates expression of transcripts that encode other subunits of the MCM complex, including MCM2 and MCM5, suggesting that downregulation of MCM genes as a result of YTHDC1 KD may have a synergistic effect on MCM complex–mediated DNA replication and DNA repair. Other downstream targets of YTHDC1, as defined by global gene expression profiling, may also contribute to the function of YTHDC1 in AML cells. Taken together, our studies suggest that YTHDC1 as a nuclear m6A reader promotes leukemogenesis through distinct mechanisms, consolidating the concept that m6A readers also have a critical role in AML pathogenesis.
Previous studies showed that YTHDC1 regulates RNA splicing, nuclear export, and chromosome-associated regulatory RNA decay in the nucleus.14-17 YTHDC1 can competitively bind with SRSF3 and SRSF10 to regulate mRNA splicing.15 However, YTHDC1 KD in leukemia cells did not affect MCM4 splicing as determined by RNA-sequencing analysis (data not shown). We also showed that YTHDC1 KD did not affect the nuclear export and translation efficiency of MCM4 and MCM5 in AML cells. To our surprise, we found that YTHDC1 regulates MCM2, MCM4, and MCM5 expression through controlling stability of these transcripts in AML cells.
Although Ythdc1 is required for survival and self-renewal of both HSCs and LSCs in mice, we found that YTHDC1 KD had a dramatic inhibition of proliferation and survival and promoted differentiation of human leukemia cell lines carrying different subtypes of chromosome abnormalities as well as primary leukemia cells; YTHDC1 KD, however, had minor effects on CD34+ human HSPCs from healthy donors. These data suggest AML blast cells with YTHDC1 overexpression likely are more sensitive to YTHDC1 inhibition compared with normal HSPCs. However, whether there is a therapeutic window for targeting YTHDC1 in patients with AML remains to be determined by future studies.
Acknowledgments
This work was partially supported by grants from the National Institutes of Health, National Heart, Lung, and Blood Institute (RO1 HL131444 [Z.Q.]), the National Institute of Diabetes and Digestive and Kidney Diseases (RO1 DK107615 [Z.Q.]), and the National Human Genome Research Institute (RM1 HG008935 [C.H.]). Z.Q. is a Leukemia & Lymphoma Society Scholar. S.B.-M. is a Children’s Miracle Network Scholar. C.H. is an investigator of the Howard Hughes Medical Institute.
Authorship
Contribution: Z.Q. and C.H. conceived the project and designed the experiments; Y.S., J.W., F.Y., H.X., C.Y., Q.W., and Y.L. performed experiments; Z.Q., Y.S., H.X., Y.W., L.L., and X.-L.C. analyzed data; Z.Q. and Y.S. wrote the manuscript; B.S., X.G., W.L.,Y.H., and S.B.-M. provided advice and new reagents/analytic tools; and all authors provided critical review of the manuscript.
Conflict-of-interest disclosure: C.H. is a scientific founder and a scientific advisory board member of Accent Therapeutics, Inc and a shareholder of Epican Genentech. The remaining authors declare no competing financial interests.
Correspondence: Chuan He, Department of Chemistry, University of Chicago, 929 E 57th St, Chicago, IL 60637; email: chuanhe@uchicago.edu; and Zhijian Qian, Department of Medicine, UF Health Cancer Center, University of Florida, 2033 Mowry Rd, Room 257, Gainesville, FL 32610; email: zhijian.qian@medicine.ufl.edu.
The RNA-sequencing data reported in this article have been deposited in the Gene Expression Omnibus database (accession number GSE178859).
There is a Blood Commentary on this article in this issue.
The online version of this article contains a data supplement.
The publication costs of this article were defrayed in part by page charge payment. Therefore, and solely to indicate this fact, this article is hereby marked “advertisement” in accordance with 18 USC section 1734.

This feature is available to Subscribers Only
Sign In or Create an Account Close Modal