

Key Points
In this systematic review, incidence and mortality rates of intracranial hemorrhage in hemophilia were pooled for more precise estimates.
Incidence and mortality rates of intracranial hemorrhage are higher in patients with hemophilia compared with the general population.

Abstract
Intracranial hemorrhage (ICH) is a severe complication that is relatively common among patients with hemophilia. This systematic review aimed to obtain more precise estimates of ICH incidence and mortality in hemophilia, which may be important for patients, caregivers, researchers, and health policy makers. PubMed and EMBASE were systematically searched using terms related to “hemophilia” and “intracranial hemorrhage” or “mortality.” Studies that allowed calculation of ICH incidence or mortality rates in a hemophilia population ≥50 patients were included. We summarized evidence on ICH incidence and calculated pooled ICH incidence and mortality in 3 age groups: persons of all ages with hemophilia, children and young adults younger than age 25 years with hemophilia, and neonates with hemophilia. Incidence and mortality were pooled with a Poisson-Normal model or a Binomial-Normal model. We included 45 studies that represented 54 470 patients, 809 151 person-years, and 5326 live births of patients with hemophilia. In persons of all ages, the pooled ICH incidence and mortality rates were 2.3 (95% confidence interval [CI], 1.2-4.8) and 0.8 (95% CI 0.5-1.2) per 1000 person-years, respectively. In children and young adults, the pooled ICH incidence and mortality rates were 7.4 (95% CI, 4.9-11.1) and 0.5 (95% CI, 0.3-0.9) per 1000 person-years, respectively. In neonates, the pooled cumulative ICH incidence was 2.1% (95% CI, 1.5-2.8) per 100 live births. ICH was classified as spontaneous in 35% to 58% of cases. Our findings suggest that ICH is an important problem in hemophilia that occurs among all ages, requiring adequate preventive strategies.
Introduction
Hemophilia A and B are bleeding disorders that are characterized by an X-linked inherited deficiency of coagulation factor VIII (FVIII) or IX (FIX). The clinical phenotype is dominated by the residual endogenous factor level, resulting in severe (<1 IU/dL), moderate (1-5 IU/dL), and mild (6-40 IU/dL) forms.1 Although joint and muscle bleeds are the hallmark of hemophilia, intracranial hemorrhage (ICH) can be considered the most severe complication. Intracranial bleeds may form serious life-threatening events and have been associated with considerable neurological sequelae in survivors.2-4
Various studies have assessed the occurrence of ICH in hemophilia, reporting wide ranges in incidence and mortality among different cohorts. In 2008, a literature review concluded that ∼3% to 10% of patients with hemophilia experience an intracranial bleed during life. These numbers are based on patients who have primarily been treated on demand.5 In childhood, ICH seems to occur relatively frequently, which is illustrated by a recent study that reported an incidence of 6 events per 1000 person-years in children with hemophilia.6 Newborns seem to face an even higher risk for ICH. A systematic review estimated that neonates with hemophilia are 44 times more likely to experience an ICH compared with the general population.7 Regarding disease severity, patients with severe hemophilia are at increased risk for ICH compared with patients with nonsevere hemophilia. Nonetheless, a study in nonsevere hemophilia demonstrated that this group still has an increased standardized mortality rate of 3.5 from ICH compared with the general population.8 These findings indicate that ICH remains an important problem in all patients with hemophilia and that strategies to prevent this complication are crucial. Comprehensive knowledge on ICH in this population is needed to raise awareness and to support initiatives on prevention and treatment.
Diversity in study settings and small patient populations give rise to a wide range of reported incidences of ICH in hemophilia. Few pooled and precise estimates of ICH incidence and its associated mortality are available for the population with hemophilia. A systematic literature review with meta-analyses of ICH epidemiology in hemophilia may provide insight into the burden of ICH and guide future prevention and management.
In this systematic review and meta-analysis we aimed to summarize currently available evidence on ICH incidence and to obtain more precise estimates of ICH incidence and mortality rates in 3 groups: persons with hemophilia of all ages, children and young adults with hemophilia who are younger than 25 years of age, and neonates with hemophilia.
Methods
This systematic review is reported in accordance with the Preferred Reporting Items for Systematic Reviews and Meta-Analysis statement.9 The protocol was written in advance and registered in PROSPERO (record ID 100278).
Study eligibility
Type of studies
Eligible for inclusion were cross-sectional, longitudinal observational, and randomized studies reporting on incidence or mortality of ICH in congenital hemophilia, published as an article in a peer-reviewed journal. Studies had to provide sufficient data to enable calculation or reliable estimation of an incidence or mortality rate. No restrictions on publication dates or language were applied.
Type of patients
Study populations had to include ≥50 patients who were representative of the hemophilia population in general, irrespective of hemophilia type, severity, or age limits. Studies that primarily evaluated patients with HIV, hepatitis C virus, hepatitis B virus, inhibitors against FVIII or FIX, acquired hemophilia, or any other bleeding disorder were excluded.
Type of outcome measures
Studies had to report on ICH, defined as any intracranial bleed (including intraventricular, intraparenchymal, subarachnoid, subdural, and epidural bleeds), or mortality due to ICH. Studies that did not clearly differentiate between intra- and extracranial bleeds or ischemic and hemorrhagic strokes were excluded.
Search strategy
PubMed and EMBASE were searched using key terms related to “hemophilia” and either “intracranial hemorrhage” or “mortality” (full search strategy in supplemental Table 1, available on the Blood Web site). The search was developed under the supervision of a medical information specialist from the Amsterdam University Medical Center (Amsterdam UMC), Amsterdam, The Netherlands (René Spijker). Reference lists of included studies and other reviews were searched to identify any additional studies that were not retrieved through the literature search. The primary search was run on 12 April 2018, and an update of the search was performed on 12 May 2020.
Study selection
Two independent reviewers (A.-F.Z. and either J.S.J. or C.V.) screened titles and abstracts and full texts for eligibility. Any doubts about eligibility or disagreements were discussed with a senior author (S.C.G.). To avoid duplicate inclusion of individuals, studies were evaluated for recruitment periods and catchment areas. In case of overlapping patient cohorts, the study with the longest follow-up or the study that provided the most comprehensive data was included.
Data extraction
Data were extracted from included studies using a standardized data collection form. The following data were extracted: study characteristics (ie, publication year, observation period, design, geographic location), population characteristics (ie, distribution of age, type and severity of hemophilia, treatment, comorbidities), information on ICH (incidence and mortality of ICH, number of ICH-related deaths out of total number of deaths), nature of ICH (ie, location of hemorrhage, cause of bleeding), and the number of person-years of follow-up of the hemophilia study population. When the exact number of person-years was not reported, we estimated the number based on the available data, if possible. Otherwise, investigators of the original studies were requested to provide additional information on the number of person-years. Supplemental Table 3 summarizes the reported and estimated person-years of included studies.
Quality assessment
The methodological quality of studies was assessed by 2 reviewers independently (A.-F..Z. and either J.S.J. or C.V.) and discussed with a senior author (S.C.G.) in case of disagreement. We adapted the version of the Joanna Briggs Institute checklist for studies on prevalence data and added items derived from the Joanna Briggs Institute checklist for cohort studies specific for incidence data (supplemental Table 2).10,11
Data synthesis
We performed analyses considering 3 groups: lifetime cohorts, children and young adults, and neonates.
Group 1: lifetime
First, data were summarized for study populations including all ages or adults only. The pooled data were presented as single-event incidence rate and mortality rate per 1000 person-years.
Group 2: children and young adults
Second, we analyzed study populations representing children or young adults younger than 25 years of age. The pooled data were presented as single-event incidence rate and mortality rate per 1000 person-years.
Group 3: neonatal period
Third, we included study populations reporting on the neonatal period. The pooled data were presented as single-event cumulative incidence and mortality per 100 live births.
Statistical analyses
Heterogeneity between studies was explored by assessing the between-study variance (τ2) and by visually estimating the extent to which confidence intervals (CIs) of studies overlapped. Because of acceptable heterogeneity, we pooled the results in a meta-analysis. Single-event incidence and mortality rates were pooled using a random-effects Poisson-Normal model. Proportions including single-event cumulative incidence and mortality were pooled using a random-effects Binomial-Normal model. These generalized linear mixed models are more appropriate than conventional methods for meta-analysis in the event of sparse or no event data and avoid the use of continuity corrections.12 Exact 95% CIs for the studies with no events were calculated using Episheet (version 2015).13 Case fatality was calculated as the percentage of fatal ICH events out of all single ICH events in a population. Spontaneous ICH was calculated as the proportion of ICH events classified as spontaneous out of all ICH events in a population and pooled as proportions. Analyses were performed in R (version 3.6.1) with the metafor package.
Data evaluation
Forest plots were arranged by their sample size to visually assess small-study data trends. Sensitivity analyses were performed for studies that reported the exact numbers of person-years of follow-up, as well as for studies that met ≥80% of the evaluated methodological quality items. In addition, separate analyses were performed for studies of children and young adults younger than 25 years excluding neonatal ICH events, and for study setting according to country income level based on the World Bank classification 2020 to 2021.
Results
Our search yielded 2229 unique hits that resulted in 220 studies that were identified as potentially relevant after title and abstract screening (Figure 1). After additional full-text review, a total of 45 studies were included. Study details are shown in Tables 1 and 2. We classified studies as reporting on lifetime populations (n = 23), children and young adults younger than 25 years of age (n = 16), and the neonatal period (n = 12). Two studies were lifetime cohorts with pediatric-specific data,8,14 and 4 studies were pediatric cohorts with neonatal data.6,15-17 The investigators of 21 studies were contacted to request additional information about the number of person-years. Six investigators provided this information, resulting in 18 studies that reported the exact numbers of person-years and 19 studies for which the number of person-years was estimated. Supplemental Table 4 summarizes the studies that appeared to meet the inclusion criteria but were excluded on further inspection.
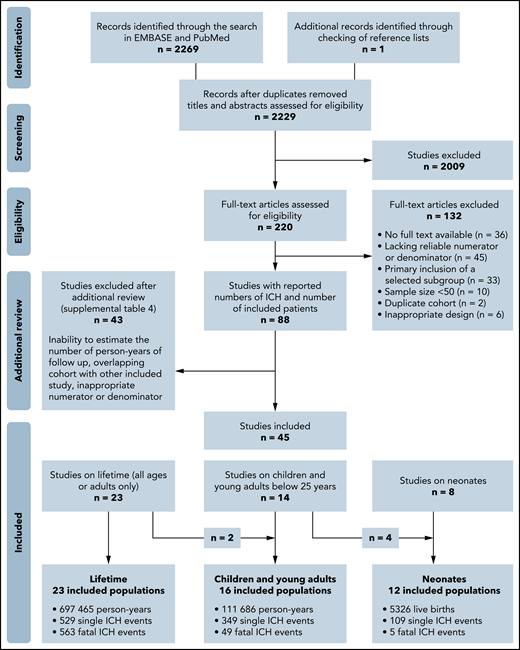
Flowchart of the search strategy. The presented number of single ICH events does not include cases from studies that reported on fatal ICH events only. These fatal events were solely used for the ICH mortality analyses.
Flowchart of the search strategy. The presented number of single ICH events does not include cases from studies that reported on fatal ICH events only. These fatal events were solely used for the ICH mortality analyses.
Study and population characteristics
| Study | Setting | Period | Age limits, (mean, y) | Total, N | Type A, n | Type B, n | Disease severity, n (%) | Proph. n (%) | Inhib. n (%) | HIV+ n (%) | HCV+ n (%) | Study details | ||
|---|---|---|---|---|---|---|---|---|---|---|---|---|---|---|
| Severe | Moderate | Mild | ||||||||||||
| Lifetime | ||||||||||||||
| Khair et al54 | AHEAD* | 2011-2016 | No (21) | 522 | 522 | 0 | 299 (57) | 221 (42) | 0 | 406 (78) | 22 (4) | NR | NR | Prospective multicenter postauthorization study, patient diaries |
| Zanon et al19 | Italy | 1987-2008 | No | 3683 | NR | NR | NR | NR | NR | NR | NR | NR | NR | Survey among HTCs over 1987-2008, prospective follow-up over 2003-2008 |
| Fransen van de Putte et al18 | Netherlands | ≤2010 | ≥18 y (54) | 408 | 365 | 43 | 204 (50) | 204 nonsevere (50) | NR | NR | 49 (12) | 229 (56) | Retrospective single-center study | |
| Loomans et al8 | INSIGHT† | 1980-2010 | No | 2709 | 2709 | 0 | 0 | 719 (27) | 1990 (73) | NR | NR | NR | NR | Retrospective multicenter study |
| Koumbarelis et al41 | Greece | 1972-1993 | No | 531 | 460 | 71 | 319 (60) | 92 (17) | 227 (43) | 0 | 38 (7) | 156 (29) | NR | Single-center registry |
| Plug et al45 | Netherlands | 1992-2001 | No (32) | 967 | 796 | 171 | 386 (40) | 167 (17) | 414 (43) | NR | 50 (5) | 53 (5) | NR | National survey, medical files and municipal registries |
| Rosendaal et al44 | Netherlands | 1973-1986 | No (23) | 717 | 616 | 101 | 321 (45) | 169 (24) | 227 (32) | 129 (18) | 30 (4) | NR | NR | National survey, medical files and municipal registries |
| Triemstra et al46 | Netherlands | 1986-1992 | No (30) | 919 | 796 | 123 | 381 (41) | 172 (19) | 366 (40) | 200 (22) | 22 (2) | 35 (4) | NR | National survey, medical files and municipal registries |
| Nuss et al21 | USA | 1993-1997 | No | 3269 | 2579 | 690 | 1371 (42) | 779 (24) | 1028 (31) | 82 (3) | 146 (4) | 827 (25) | 1346 (41) | Case-control in HSS database, ICD codes & medical files |
| Yoo et al55 | Korea | 1991-2012 | No | 2048 | 1675 | 373 | 1354 (66) | 452 (22) | 226 (11) | NR | 79 (4) | 25 (1) | NR | National registry |
| Darby et al14 | UK | 1977-1998 | <85 y | 6018 | 4874 | 1144 | 1320 (22) | 1476 (25) | 3222 (54) | NR | NR | 0 | NR | UKHCDO, all patients registered at UK HTCs |
| Witmer et al22 | USA | 1998-2008 | >2 y | 10 262 | 8087 | 2175 | 5581 (54) | 2398 (24) | 2283 (22) | 3052 (30) | 586 (6) | 1311 (13) | 4107 (40) | Prospective case-control UDC database |
| Shih et al56 | Taiwan | 1997-2013 | No (33) | 795 | 658 | 137 | 795 (100) | 0 | 0 | NR | 0 | 218 (27) | 29 (4) | Retrospective national insurance database |
| Fransen van de Putte et al57 | Netherlands & UK | ≤2011 | ≥30 y (50) | 709 | 594 | 113 | 344 (48) | 365 nonsevere (52) | 223 (31) | NR | 76 (11) | 228 (32) | Retrospective study into lifetime CVD events of a living cohort | |
| Lövdahl et al58 | Sweden | 1968-2009 | No | 1431 | NR | NR | 384 (41) | 145 (16) | 405 (43) | NR | NR | 96 (7) | NR | Hemophilia registry and death, migration, and medical birth registries, ICD codes |
| Reitter et al59 | Austria | 1983-2006 | No (28) | 226 | 207 | 19 | 128 (57) | 14 (6) | 84 (37) | NR | 21 (9) | 74 (33) | 136 (60) | Retrospective survival analysis, death registry, medical files, ICD codes |
| Sharathkumar et al60 | USA | ≤2008 | ≥35 y (53) | 185 | 102 | 83 | 47 (25) | 57 (31) | 81 (44) | 0 | 8 (4) | 27 (15) | 125 (68) | Retrospective study into lifetime CVD events of a living cohort |
| Rizza and Spooner61 | UK | 1976-1980 | <85 y | 5098 | 4321 | 777 | 2179 (43) | 2491 nonsevere (49) | NR | 265 (5) | NR | NR | UKHCDO, all patients registered at UK HTCs | |
| Rizza et al62 | UK | 1981-1996 | <85 y | 5890 | 4826 | 1064 | 1878 (32) | 3723 nonsevere (63) | NR | 261 (4) | NR | NR | UKHCDO, all patients registered at UK HTCs | |
| Kim et al63 | Korea | ≤1987 | No | 498 | 425 | 73 | 273 (55) | 182 (37) | 43 (9) | NR | NR | 2 (0) | 11 (3) | Survey among all HTCs in Korea |
| Chuansumrit et al20 | Thailand | 1971-2000 | No (17) | 164 | 138 | 26 | 64 (39) | 81 (49) | 19 (16) | 0 | NR | 7 (1) | 43 (26) | Retrospective survival analysis |
| Okolo et al64 | USA | ≤2013 | No (30) | 704 | 456 | 248 | 233 (33) | 185 (26) | 267 (38) | 201 (29) | 16 (2) | 28 (4) | 134 (19) | Surveillance study (IHSS), vital statistics, medical files, birth registry, claims |
| Fukutake et al65 | Japan | 2007-2012 | ≥1 y (26) | 352 | 352 | 0 | 266 (76) | 63 (18) | 21 (6) | 195 (55) | 9 (3) | NR | NR | Retrospective and prospective multicenter postauthorization study |
| Children and young adults | ||||||||||||||
| Andersson et al3 | PedNet‡ | 2011-2015 | 1 mo to 22 y (9) | 1515 | 1250 | 265 | 1515 (100) | 0 | 0 | NR | 0 | NR | NR | Registry with 5-y retrospective data and 4-y prospective data (2011-2015) |
| Traivaree et al23 | Canada | 1996-2004 | 1 mo to 18 y (10) | 275 | 218 | 57 | 116 (42) | 159 nonsevere (58) | 88 (32) | 12 (4) | NR | NR | Retrospective single-center study | |
| Hu et al24 | China | 2009-2014 | Children | 126 | 126 | 0 | 42 (33) | 64 (51) | 20 (16) | 36 (29) | 2 (2) | NR | NR | Retrospective study of all patients receiving treatment during study period |
| Haque et al66 | China | 2005-2017 | Children | 226 | 170 | 56 | 91 (40) | 88 (39) | 47 (21) | NR | 9 (0) | NR | NR | Retrospective single-center study |
| Loomans et al8 | INSIGHT† | 1980-2010 | ≤19 y | NR | NR | 0 | 0 | NR | NR | NR | NR | NR | NR | Retrospective multicenter study |
| Darby et al14 | UK | 1977-1998 | ≤24 y | NR | NR | NR | NR | NR | NR | NR | NR | NR | NR | UKHCDO, all patients registered at UK HTCs |
| Chalmers et al6 | UK | 2003-2015 | ≤16 y | 1321 | 1096 | 225 | 655 (50) | 666 nonsevere (50) | NR | NR | NR | NR | UKHCDO, retrospective study of database | |
| Bladen et al17 | UK | 1987-2013 | Children | 431 | 364 | 67 | 283 (66) | 34 (8) | 107 (25) | NR | NR | NR | NR | Retrospective single-center study |
| Revel-Vilk et al16 | Canada | 1984-2000 | ≤18 y (9§) | 172 | NR | NR | NR | NR | NR | NR | 0 | NR | NR | Retrospective study into lifetime ICH of a living cohort |
| Carneiro et al67 | Brazil | NR | NR (13) | 50 | 38 | 12 | 35 (70) | 15 (30) | 0 | 33 (66) | 5 (10) | NR | NR | Cross-sectional random sample of a living cohort with retrospective ICH assessment |
| Canada | NR (12) | 50 | 41 | 9 | 35 (70) | 15 (30) | 0 | 38 (76) | 6 (12) | |||||
| Nelson et al68 | USA | 1989-1994 | ≤19 y (12§) | 309ǁ | 273 | 50 | 246 (74) | 63 (19) | 23 (7) | NR | NR | 207 (67) | NR | Retrospective study of living children enrolled in HGDS study |
| Poonnoose et al69 | Musfih¶ | 2005-2010 | 5-17 y | 255 | 220 | 35 | 255 (100) | 0 | 0 | 39 (15) | 0 | NR | NR | Prospective multicenter study |
| Klinge et al15 | Germany | 1975-1998 | Children | 744 | 602 | 142 | 507 (68) | 235 nonsevere (32) | NR | NR | NR | NR | Survey among HTCs over children born 1975-1997, retrospective ICH assessment | |
| Meunier et al70 | France | <2012 | ≤25 y | 209 | 183 | 26 | 171 (82) | 38 (18) | 0 | 169 (81) | 0 | NR | NR | Retrospective multicenter study of a living cohort |
| Öner et al71 | Turkey | 1985-2017 | <18 y | 135 | 113 | 22 | 64 (47) | 41 (30) | 30 (22) | NR | 17 (13) | NR | NR | Retrospective single-center study |
| Kulkarni et al25 | USA | 2004-2011 | <2 y | 547 | 450 | 97 | 326 (60) | 131 (24) | 89 (16) | NR | 109 (20) | NR | NR | UDC database enrolling babies with ≥1 visit between 24 and 30 mo of age |
| Neonates | ||||||||||||||
| Ljung et al26 | Sweden | 1970-1990 | Perinatal | 117 | 101 | 16 | 89 (76) | 28 (24) | 0 | NR | NR | NR | NR | National retrospective analysis |
| MacLean et al72 | Netherlands | 1985-2002 | Postnatal | 73 | 60 | 13 | 25 (34) | 9 (12) | 39 (53) | NR | NR | NR | NR | Retrospective analysis of a living cohort |
| Kenet et al27 | USA | 2003-2010 | <1 mo | 633 | NR | NR | NR | NR | NR | NR | 5 (1) | NR | NR | UDC database enrolling babies diagnosed within 1 mo of age |
| Richards et al28 | EHTSB# | 1990-2008 | ≤28 d | 508 | 429 | 78 | 257 (51) | 101 (20) | 149 (29) | NR | NR | NR | NR | Retrospective multicenter study |
| Nazir et al29 | Gulf region** | 1998-2015 | <2 wk | 163 | 163 | 0 | 163 (100) | 0 | 0 | NR | NR | NR | NR | Study with retrospective data (1998-2013) and prospective data (2013-2015) |
| Palomo Bravo et al73 | Spain | 2000-2012 | Perinatal | 88 | 80 | 8 | 42 (48) | 12 (14) | 34 (39) | NR | NR | NR | NR | Retrospective study of consecutively born children followed up for ≥1 y |
| Andersson et al30 | PedNet†† | 2000-2015 | ≤28 d | 926 | 803 | 123 | 786 (85) | 140 (15) | 0 | NR | NR | NR | NR | Prospective study of children consecutively born with ≥1 follow-up visit |
| Yoffe and Buchanan74 | USA | 1977-1987 | Neonatal | 150 | 119 | 31 | NR | NR | NR | NR | NR | NR | NR | Retrospective analysis of a living cohort |
| Klinge et al15 | Germany | 1975-1997 | <1 wk | 744 | 602 | 142 | 507 (68) | 129 (17) | 108 (15) | NR | NR | NR | NR | Survey among HTCs over children born 1975-1997, retrospective ICH assessment |
| Revel-Vilk et al16 | Canada | 1984-2000 | <1 mo | 172 | NR | NR | NR | NR | NR | NR | NR | NR | NR | Retrospective study into lifetime ICH among a living cohort |
| Bladen et al17 | UK | 1987-2013 | Neonatal | 431 | 364 | 67 | 283 (66) | 34 (8) | 107 (25) | NR | NR | NR | NR | Retrospective single-center study |
| Chalmers et al6 | UK | 2003-2015 | <1 mo | 1321 | 1096 | 225 | 655 (50) | 666 nonsevere (50) | NR | NR | NR | NR | UKHCDO, retrospective study of database | |
CVD, cardiovascular disease; HCV, hepatitis C virus; HGDS, Hemophilia Growth and Development Study; HSS, Haemophilia Surveillance System; HTC, hemophilia treatment center; ICD, International Classification of Disease; IHSS, Indiana Haemophilia Surveillance System; Inhib., inhibitor positive; NR, not reported; Proph., prophylaxis; UDC, Universal Data Collection surveillance system; UK, United Kingdom, UKHCDO, United Kingdom Haemophilia Centre Doctors' Organisation.
Austria, Australia, Belgium, Brazil, Canada, Denmark, France, Germany, Greece, Italy, Spain, Sweden, Switzerland, UK, Colombia, Czech Republic, Hungary, Poland, Portugal, Russia, and Slovenia.
Austria, Australia, Belgium, Finland, Germany, Italy, Netherlands, Spain, Sweden, and UK.
Austria, Australia, Belgium, Canada, China, Denmark, Finland, France, Germany, Greece, Ireland, Italy, Netherlands, Spain, Sweden, Switzerland, UK, USA, Israel, and Turkey.
Median instead of mean.
A total of 333 patients were included, history of ICH was available for 309 patients. Numbers for severity and type do not add up because of missing data.
Argentina, Brazil, South Africa, Thailand, Egypt, Singapore, Venezuela, and Iran.
Finland, France, Germany, Italy, Netherlands, Spain, UK, and Slovakia.
Oman, United Arab Emirates, Kuwait, and Saudi Arabia.
Austria, Belgium, Canada, Denmark, Finland, France, Germany, Greece, Ireland, Italy, Netherlands, Norway, Spain, Sweden, Switzerland, UK, Israel, and Portugal.
Study characteristics
The studies reporting over lifetime described 48 105 patients and 697 465 person-years over 6 decades (study period: 1968-2016). The studies reporting on children and young adults younger than 25 years described 111 686 person-years over 5 decades (study period: 1975-2017). The studies reporting on the neonatal period described 5326 neonates over 5 decades (study period: 1970-2015). Figure 1 shows further details on the number of events in the different groups. The populations in this review were included in 43 countries (22 Europe, 4 East Asia, 2 Southeast Asia, 6 West Asia, 1 Australia, 2 North America, 4 South America, 2 Africa). The majority of studies were conducted in high-income settings, especially for lifetime and neonatal populations. In 51 265 patients for whom the disease severity was reported, 23 830 (46%) and 27 435 (54%) patients had severe and nonsevere hemophilia, respectively (Table 1).
Methodological quality
The critical appraisal of the included 45 studies can be found in supplemental Table 5. Six studies were included in multiple population groups and, therefore, were evaluated twice, which resulted in 51 evaluated studies. At least 80% of the quality items were met in 19 of these 51 studies. Reasons for not meeting quality items were most frequently related to a lack of description of diagnostic methods and unclear or inadequate handling of loss to follow-up.
ICH incidence
Figure 2 represents the pooled analyses of ICH incidence among the 3 age groups. Over lifetime, the pooled ICH incidence rate was 2.3 (95% CI, 1.2-4.8) per 1000 person-years, calculated over 11 studies. In children and young adults younger than 25 years, the pooled ICH incidence rate was 7.4 (95% CI, 4.9-11.1) per 1000 person-years, calculated over 12 studies. These findings suggest that ICH occurrence in hemophilia can be estimated at 0.23% and 0.74% per year for lifetime populations and children and young adults, respectively. When restricted to 7 pediatric studies without neonatal ICH, the pooled ICH incidence rate was 4.5 (95% CI, 2.7-7.5) per 1000 person-years (supplemental Figure 1E). In 1 pediatric study reporting incidence among different age categories, the highest ICH incidence rates were observed in children aged 0 to 4 years with 16.4, 18.4, 7.5, and 8.0 events per 1000 person-years per 1-year stratum, respectively (Table 2; supplemental Figure 3).3 In neonates, the pooled ICH cumulative incidence was 2.1% (95% CI, 1.5-2.8) per 100 live births, calculated over 12 studies. Hence, ∼2.1% of newborns with hemophilia are expected to experience an ICH in the neonatal period.
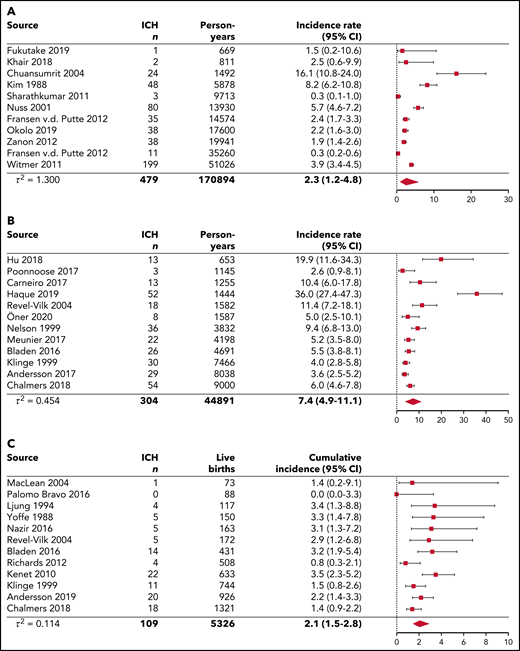
Pooled analyses of single-event ICH incidence for lifetime, children and young adults younger than age 25 years, and neonates. The diamond represents the pooled estimate. (A) Pooled single-event ICH incidence rates per 1000 person-years for lifetime cohorts. The results from the prospective follow-up from Zanon et al (2012)19 were used in this analysis instead of the results from retrospective and prospective follow-up. (B) Pooled single-event ICH incidence rates per 1000 person-years for children and young adults younger than 25 years of age. The study by Traivaree et al (2007)23 was excluded from the analysis because of overlap in the catchment area and population with the study by Revel-Vilk et al (2004)16, which had a longer follow-up period. The study by Kulkarni et al (2017)25 was excluded from the analysis because it concerned a specific cohort of infants <2 years of age. The studies by Andersson et al (2017)3, Hu et al (2018),23 and Poonnoose et al (2017)69 did not include neonatal ICH. (C) Pooled single-event ICH cumulative incidence per 100 live births for neonates.
Pooled analyses of single-event ICH incidence for lifetime, children and young adults younger than age 25 years, and neonates. The diamond represents the pooled estimate. (A) Pooled single-event ICH incidence rates per 1000 person-years for lifetime cohorts. The results from the prospective follow-up from Zanon et al (2012)19 were used in this analysis instead of the results from retrospective and prospective follow-up. (B) Pooled single-event ICH incidence rates per 1000 person-years for children and young adults younger than 25 years of age. The study by Traivaree et al (2007)23 was excluded from the analysis because of overlap in the catchment area and population with the study by Revel-Vilk et al (2004)16, which had a longer follow-up period. The study by Kulkarni et al (2017)25 was excluded from the analysis because it concerned a specific cohort of infants <2 years of age. The studies by Andersson et al (2017)3, Hu et al (2018),23 and Poonnoose et al (2017)69 did not include neonatal ICH. (C) Pooled single-event ICH cumulative incidence per 100 live births for neonates.
ICH incidence and mortality rates, case fatality and proportions of ICH-related deaths in patients with hemophilia
| Study | Persons with ICH, n | Total ICH events, n | Fatal ICH, n | Person-y | ICH single-event incidence rate per 1000 person-y | ICH multiple-event incidence rate per 1000 person-y | ICH mortality rate per 1000 person-y | Case fatality, % | Deaths caused by ICH/total deaths, n/N (%) |
|---|---|---|---|---|---|---|---|---|---|
| Lifetime: reported person-y | |||||||||
| Khair et al54 | 2 | 2 | NR | 811 | 2.5 | 2.5 | NR | NR | NR |
| Zanon et al 19 | |||||||||
| 1987-2008 | 88 | 112 | 22 | 130692 | 0.7 | 0.9 | 0.2 | 25 | NR |
| 2003-2008 | 38 | NR | NR | 19941 | 1.9 | NR | NR | NR | NR |
| Fransen van de Putte et al18 | 35 | 39 | 9 | 14574 | 2.4 | 2.7 | 0.6 | 25 | 9/78 (12) |
| Loomans et al8 | NR | NR | 17 | 64208 | NR | NR | 0.3 | NR | 17/148 (11) |
| 0-9 | 2 | 831 | 0.2 | ||||||
| 10-19 | 1 | 122 | 0.1 | ||||||
| 20-29 | 1 | 932 | 0.1 | ||||||
| 30-39 | 0 | 208 | 0 | ||||||
| 40-49 | 2 | 8713 | 0.2 | ||||||
| 50-59 | 4 | 6368 | 0.6 | ||||||
| 60-69 | 5 | 3892 | 1.3 | ||||||
| 70-79 | 2 | 1699 | 1.2 | ||||||
| >79 | 0 | 444 | 0 | ||||||
| Koumbarelis et al41 | NR | NR | 16 | 8641 | NR | NR | 1.9 | NR | 16/78 (21) |
| Plug et al45 | NR | NR | 4 | 8868 | NR | NR | 0.5 | NR | 4/94 (4) |
| Rosendaal et al44 | NR | NR | 3 | 7788 | NR | NR | 0.4 | NR | 3/43 (7) |
| Triemstra et al46 | NR | NR | 9 | 5753 | NR | NR | 1.6 | NR | 9/45 (20) |
| Nuss et al21 | 80 | 88 | 16 | 13930 | 5.7 | 6.3 | 1.2 | 20 | NR |
| Yoo et al55 | NR | NR | 50 | 29434 | NR | NR | 1.7 | NR | 50/137 (36) |
| Darby et al14 | NR | NR | 168 | 98750 | NR | NR | 1.7 | NR | 168/706 (24) |
| 0-4 | 14 | 6308 | 2.2 | ||||||
| 5-14 | 2 | 15000 | 0.1 | ||||||
| 15-24 | 7 | 20714 | 0.3 | ||||||
| 25-34 | 10 | 14737 | 0.7 | ||||||
| 35-44 | 19 | 13529 | 1.4 | ||||||
| 45-54 | 23 | 10655 | 2.2 | ||||||
| 55-64 | 37 | 7477 | 4.9 | ||||||
| 65-74 | 41 | 4674 | 8.8 | ||||||
| 75-84 | 14 | 1750 | 8.6 | ||||||
| Witmer et al22 | 199 | NR | 39 | 51026 | 3.9 | NR | 0.8 | 20 | NR |
| Shih et al56 | NR | 90 | NR | 11140 | NR | 8.1 | NR | NR | NR |
| >18 | 58 | 7184 | 8.1 | ||||||
| Lifetime: estimated person-y | |||||||||
| Fransen van de Putte et al57 | 11 | NR | NR | 35260 | 0.3 | NR | NR | NR | NR |
| Lövdahl et al58 | NR | NR | 15 | 63250 | NR | NR | 0.2 | NR | 15/382 (4) |
| Reitter et al59 | NR | NR | 7 | 4272 | NR | NR | 1.6 | NR | 7/96 (7) |
| Sharathkumar et al60 | 3 | 3 | NR | 9713 | 0.3 | 0.3 | NR | NR | NR |
| Rizza and Spooner61 | NR | NR | 30 | 25754 | NR | NR | 1.2 | NR | 30/107 (28) |
| Rizza et al62 | NR | NR | 148 | 87962 | NR | NR | 1.7 | NR | 148/1298 (11) |
| Kim et al63 | 48 | NR | 3 | 5878 | 8.2 | NR | 0.5 | 6 | NR |
| Chuansumrit et al20 | 24 | 41 | 7 | 1492 | 16.1 | 27.5 | 4.7 | 29 | 7/25 (28) |
| Okolo et al64 | 38 | NR | NR | 17600 | 2.2 | NR | NR | NR | NR |
| Fukutake et al65 | 1 | 1 | 0 | 669 | 1.5 | 1.5 | 0 | 0 | 0/0 |
| Children and young adults: reported person-y | |||||||||
| Andersson et al3 | 29* | 29* | 2* | 8038 | 3.6* | 3.6* | 0.3* | 7 | NR |
| 0 to <1 | 4 | 244 | 16.4 | ||||||
| 1 to <2 | 9 | 489 | 18.4 | ||||||
| 2 to <3 | 4 | 535 | 7.5 | ||||||
| 3 to <4 | 4 | 499 | 8.0 | ||||||
| 4 to <5 | 2 | 508 | 3.9 | ||||||
| 5 to <6 | 1 | 494 | 2.0 | ||||||
| 6 to <13 | 2 | 3247 | 0.6 | ||||||
| 13 to <19 | 3 | 1878 | 1.6 | ||||||
| 19 to <22 | 0 | 145 | 0 | ||||||
| Traivaree et al23 | 8* | 11* | 0* | 1584 | 5.0* | 7.3* | 0* | 0 | NR |
| Hu et al24 | 13* | 13* | 0* | 653 | 19.9* | 19.9* | 0* | NR | NR |
| Haque et al66 | 52 | 61 | 5 | 1444 | 36.0 | 42.2 | 3.5 | 10 | NR |
| Loomans et al8 | NR | NR | 3 | 21953 | NR | NR | 0.1 | NR | NR |
| 0-9 | 2 | 10831 | 0.2 | ||||||
| 10-19 | 1 | 11122 | 0.1 | ||||||
| Darby et al14 | NR | NR | 23 | 42164 | NR | NR | NR | 23/51 (45) | |
| 0-4 | 14 | 6450 | 0.5 | ||||||
| 5-14 | 2 | 15000 | 2.2 | ||||||
| 15-24 | 7 | 714 | 0.1 | ||||||
| Chalmers et al6 | 54 | 59 | 8 | 9000 | 6.0 | 6.6 | 0.9 | 15 | NR |
| 36* | 41* | 4.0* | 4.6* | ||||||
| Children and young adults: estimated person-y | |||||||||
| Bladen et al17 | 26 | 30 | 4 | 4691 | 5.5 | 6.4 | 0.9 | 15 | NR |
| 12* | 16* | 0* | 2.6* | 3.4* | 0* | 0* | |||
| Revel-Vilk et al16 | 18 | 25 | NR | 1582 | 11.4 | 15.8 | NR | NR | NR |
| 13* | 20* | 8.2* | 12.6* | ||||||
| Carneiro et al67 | |||||||||
| Brazil | 9 | 9 | NR | 650 | 13.8 | 13.8 | NR | NR | NR |
| Canada | 4 | 4 | 605 | 6.6 | 6.6 | ||||
| Nelson et al68 | 36 | 48 | NR | 3832 | 9.4 | 12.5 | NR | NR | 2/45 (0)† |
| Poonnoose et al69 | 3* | 3* | 1* | 1145 | 2.6* | 2.6* | 0.9* | 33 | 1/2 (50) |
| Klinge et al 15 | 30 | NR | 1 | 7466 | 4.0 | NR | 0.1 | 3 | NR |
| 19* | 2.5* | ||||||||
| Meunier et al70 | 22 | NR | NR | 4198 | 5.2 | NR | NR | NR | NR |
| Öner et al71 | 8 | 8 | 2 | 1587 | 5.0 | 5.0 | 1.3 | 25 | 2/2 (100) |
| Kulkarni et al25 | 37 | 46 | NR | 1094 | 33.8 | 42.0 | NR | NR | NR |
| Neonates | |||||||||
| Ljung et al26 | 4 | NR | NR | 117 | 3.4 | NR | NR | NR | NR |
| MacLean et al72 | 1 | NR | NR | 73 | 1.4 | NR | NR | NR | NR |
| Kenet et al27 | 22 | NR | NR | 633 | 3.5 | NR | NR | NR | NR |
| Richards et al28 | 4 | NR | 0 | 508 | 0.8 | NR | 0 | 0 | NR |
| Nazir et al29 | 5 | 5 | NR | 163 | 3.1 | 3.1 | NR | NR | NR |
| Palomo Bravo et al73 | 0 | 0 | NR | 88 | 0 | 0 | NR | NR | NR |
| Andersson et al30 | 20 | NR | 1 | 926 | 2.2 | NR | 0.1 | 5 | NR |
| Yoffe and Buchanan74 | 5 | 5 | NR | 150 | 3.3 | 3.3 | NR | NR | NR |
| Klinge et al15 | 11 | NR | NR | 744 | 1.5 | NR | NR | NR | NR |
| Revel-Vilk et al16 | 5 | 5 | NR | 172 | 2.9 | 2.9 | NR | NR | NR |
| Bladen et al17 | 14 | NR | 4 | 431 | 3.2 | NR | 0.9 | 29 | NR |
| Chalmers et al6 | 18 | NR | NR‡ | 1321 | 1.4 | NR | NR | NR | NR |
Studies are categorized according to group (lifetime; children and young adults; neonates) and how person-y of follow-up were retrieved (reported or estimated). The number of persons with ICH was used to calculate the ICH single-event incidence rate. The number of ICH events was used to calculate the ICH multiple-event incidence rate.
NR, not reported.
Neonatal ICH not included, specified for studies within the group “children and young adults.”
This number was retrieved from a subset of patients who entered a prospective 4-y follow-up. All 45 deaths occurred in HIV+ patients.
The total number of deceased patients in this pediatric cohort was known, but neonates were not distinguished from older children.
ICH mortality
Figure 3 represents the pooled analyses of ICH mortality among the 3 age groups. Over lifetime, the pooled ICH mortality rate was 0.8 (95% CI, 0.5-1.2) per 1000 person-years, calculated over 16 studies. Case fatality ranged from 0% to 29%. A total of 3237 deaths were reported, of which 483 were related to intracranial bleeding (range, 4-36% of all deaths). In children and young adults younger than 25 years, the pooled ICH mortality rate was 0.5 (95% CI, 0.3-0.9) per 1000 person-years, calculated over 11 studies. When restricted to 5 pediatric studies without neonatal ICH, the pooled ICH mortality rate was 0.2 (95% CI, 0.1-0.6) per 1000 person-years (supplemental Figure 2E). Case fatality ranged from 0% to 33%. In neonates, the pooled ICH cumulative mortality was 0.2% (95% CI, 0.0-1.2) per 100 live births, calculated over 3 studies. Case fatality ranged from 0% to 29%. In 2 studies reporting mortality among different age categories, the highest ICH mortality rates were observed in children 0 to 4 years of age and in adults from age 40 to 50 years onward (Table 2; supplemental Figure 3).8,14
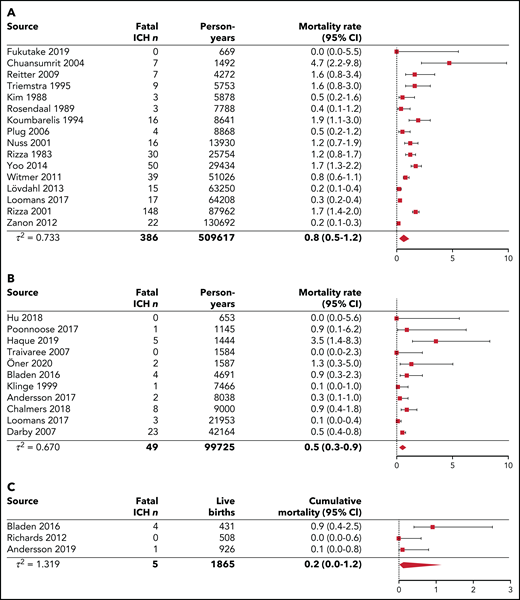
Pooled analyses of ICH mortality for lifetime, children and young adults younger than 25 years, and neonates. The diamond represents the pooled estimate. (A) Pooled ICH mortality rates per 1000 person-years for lifetime cohorts. The study of Fransen van de Putte (2012)18 was excluded from the analysis because of overlap in the catchment area and population with the studies from Rosendaal et al (1989),44 Triemstra et al (1995),46 and Plug et al (2006).45 The study by Darby et al (2007)14 (HIV−) was excluded from the analysis because of overlap in the catchment area and population with the studies by Rizza and Spooner (1983)61 and Rizza et al (2001)62 (including HIV+ and HIV− patients). The results from the complete follow-up period (retrospective and prospective follow-up) from Zanon et al (2012)19 were used in this analysis because fatal events were not described for the prospective follow-up period only. (B) Pooled ICH mortality rates per 1000 person-years for children and young adults younger than 25 years. The studies by Andersson et al (2017),3 Traivaree et al (2007),23 Hu et al (2018),23 and Poonnoose et al (2017)69 did not include neonatal ICH. (C) Pooled ICH cumulative mortality per 100 live births for neonates.
Pooled analyses of ICH mortality for lifetime, children and young adults younger than 25 years, and neonates. The diamond represents the pooled estimate. (A) Pooled ICH mortality rates per 1000 person-years for lifetime cohorts. The study of Fransen van de Putte (2012)18 was excluded from the analysis because of overlap in the catchment area and population with the studies from Rosendaal et al (1989),44 Triemstra et al (1995),46 and Plug et al (2006).45 The study by Darby et al (2007)14 (HIV−) was excluded from the analysis because of overlap in the catchment area and population with the studies by Rizza and Spooner (1983)61 and Rizza et al (2001)62 (including HIV+ and HIV− patients). The results from the complete follow-up period (retrospective and prospective follow-up) from Zanon et al (2012)19 were used in this analysis because fatal events were not described for the prospective follow-up period only. (B) Pooled ICH mortality rates per 1000 person-years for children and young adults younger than 25 years. The studies by Andersson et al (2017),3 Traivaree et al (2007),23 Hu et al (2018),23 and Poonnoose et al (2017)69 did not include neonatal ICH. (C) Pooled ICH cumulative mortality per 100 live births for neonates.
Spontaneous ICH and locations
Over lifetime, 6 studies reported on ICH causes. A total of 231 of 447 events (52%) were classified as spontaneous, with a weighted pooled proportion of 0.58 (95% CI, 0.40-0.73).8,18-22 In children and young adult populations, 6 studies reported on ICH causes. A total of 53 of 151 events (35%) were classified as spontaneous, with a weighted pooled proportion of 0.35 (95% CI, 0.28-0.43).3,15,16,23-25 In neonates, 5 studies reported on ICH related to mode of delivery. An ICH occurred after 32 of 1488 (2%) spontaneous vaginal deliveries, 7 of 514 (1%) caesarean sections, and 14 of 140 (10%) assisted vaginal deliveries.26-30 The most frequently reported locations of ICH were intraparenchymal and subdural hemorrhages in all age groups (Table 3).
Locations of ICH
| Lifetime (2 studies)19,21 | Children & young adults (5 studies)15,23-25,68 | Neonates (4 studies)27-29,74 | |
|---|---|---|---|
| Reported bleeds, total (%) | 200 | 148 | 36 |
| Intraparenchymal | 82 (41) | 33 (22) | 9 (25) |
| Subdural | 60 (30) | 50 (34) | 21 (58) |
| Subarachnoid | 17 (9) | 10 (7) | 1 (3) |
| Epidural | 11 (6) | 13 (9) | 1 (3) |
| Intraventricular | 12 (6)* | 12 (8) | 2 (6) |
| Unknown | 18 (9) | 9 (6) | 0 (0) |
| Multiple sites | 0 (0) | 21 (14) | 2 (6) |
Intraventricular bleeds were not reported by Nuss et al.21
Sensitivity analyses
The results of all pooled analyses and sensitivity analyses are summarized in Table 4. The forest plots of the sensitivity analyses can be found in supplemental Figures 1 and 2. For lifetime and neonatal cohorts, the sensitivity analyses produced similar ICH incidence and mortality rates. For children and young adults, the sensitivity analyses yielded higher ICH incidence rates when studies with reported exact number of person-years were included and lower ICH incidence rates when studies that met ≥80% of the quality items were included. Similar ICH mortality rates were found. No consistent differences in ICH rates were observed between hemophilia A and B (supplemental Table 6). Higher ICH rates were reported for adult and pediatric populations in nonhigh-income settings compared with high-income countries (supplemental Table 7).
Overview of pooled analyses of ICH incidence and mortality
| Lifetime | Children and young adults | Neonates* | ||
|---|---|---|---|---|
| All studies | Studies without neonatal ICH | |||
| Pooled ICH single-event incidence rate per 1000 person-years (95% CI) | ||||
| All included studies | 2.3 (1.2-4.8) | 7.4 (4.9-11.1) | 4.5 (2.7-7.5) | 2.1 (1.5-2.8) |
| Sensitivity analysis: only studies with reported person-years | 3.2 (2.1-4.7) | 9.4 (4.3-20.6) | 5.9 (3.0-11.3) | NA |
| Sensitivity analysis: only studies that met ≥80% of the quality items | 3.2 (2.1-4.9) | 5.0 (3.8-6.4) | 3.5 (2.8-4.4) | 1.7 (1.1-2.7) |
| Pooled ICH mortality rate per 1000 person-years (95% CI) | ||||
| All included studies | 0.8 (0.5-1.2) | 0.5 (0.3-0.9) | 0.2 (0.1-0.6) | 0.2 (0.0-1.2) |
| Sensitivity analysis: only studies with reported person-years | 0.8 (0.4-1.3) | 0.4 (0.2-1.1) | 0.2 (0.1-0.8) | NA |
| Sensitivity analysis: only studies that met ≥ 80% of the quality items | 0.6 (0.4-1.1) | 0.6 (0.4-1.1) | 0.2 (0.0-0.6) | 0.2 (0.0-1.2) |
All forest plots of the presented pooled data can be found in supplemental material.
NA, not applicable for studies on the neonatal period, as all included studies on neonates report exact numbers of live births.
Cumulative incidence and mortality presented per 100 live births (95% CI) for pooled analyses of studies on neonates.
Discussion
In this systematic review, we summarized the data from 45 studies to obtain more precise estimates of ICH incidence and mortality rates in hemophilia. We observed peak incidences among neonates, with a decline in childhood, and a lower ICH incidence found for the lifetime cohorts. For half of the included studies the exact number of observed person-years was reported, and 37% of all studies met ≥80% of the methodological quality items. Still, the sensitivity analyses yielded robust pooled estimates for the majority of the evaluations. An exception formed the inconclusive results of the sensitivity analyses for ICH incidence rates in children and young adults younger than 25 years. This may be explained by greater differences in setting and the different proportions of neonates among studies. Indeed, heterogeneity of data was considerable because of the diversity in settings and populations. The most important source of heterogeneity seemed to be the large geographic variation in ICH risk, because studies conducted in nonhigh-income countries reported substantially higher ICH incidences compared with studies from high-income countries. In addition, it is likely that other factors, including age, disease severity, and treatment, contributed to clinical heterogeneity.
ICH incidence and mortality
The observed ICH rates in hemophilia were higher compared with the general populations among all age groups addressed in this review. Neonates have the highest risk of ICH, which is confirmed by recent work from the PedNet group in severe hemophilia demonstrating that neonates were at 11.2 times higher risk for ICH compared with 1- to 12-month-old children.4 Moreover, the risk of ICH in neonates with hemophilia is strongly increased compared with neonates in the general population. A large study of term infants reported 361 intracranial bleeding episodes per 583 340 live births (0.062% per 100 live births).31 Comparing this with our pooled estimate of 2.1% per 100 live births, hemophilic neonates have a 33-fold higher risk for ICH than do newborns in the general population.
Despite the decrease in ICH risk after the neonatal period, ICH remains relatively common in children and young adults with hemophilia. This risk seems most profound in the group of infants and toddlers, which is supported by previous work reporting a median age at ICH of 2 years (interquartile range, 0.6-7.3) in a pediatric hemophilia population.32 Our pooled estimate of 7.4 cases per 1000 person-years for children and young adults with hemophilia decreased to a pooled estimate of 4.5 cases per 1000 person-years when neonatal ICH was excluded. This reflects the important contribution of neonatal bleeds to the high ICH incidence in patients up to 25 years of age. Nonetheless, the pooled ICH incidence rates in both groups are considerably higher than the risk for intraparenchymal and subarachnoid hemorrhage in the general pediatric population, which is estimated at 0.01 cases per 1000 person-years.33,34 For subdural hematoma, the incidence was 0.13 per 1000 person-years for infants aged 0 to 2 years in the general population.35 Additionally, the estimated death rate for childhood hemorrhagic stroke in the Global Burden of Disease study 2013 was 0.01 cases per 1000.36 These data suggest that young children with hemophilia are a vulnerable group, and increased counseling and protection may be required.
Additionally, our pooled ICH incidence rate of 2.3 per 1000 person-years in patients with hemophilia over lifetime is higher compared with the general population, in which the incidences of intracerebral hemorrhage, subarachnoid hemorrhage, and chronic subdural hematoma were estimated at 0.25, 0.09, and 0.17 cases per 1000 person-years, respectively.37-39 Also for mortality rates, our pooled ICH estimate of 0.8 per 1000 person-years in hemophilia is increased compared with the age-adjusted mortality rates in developed countries (0.22 per 1000 person-years) and globally (0.53 per 1000 person-years).40 Because mortality risk is associated with ICH type, different distributions of ICH types among studies complicate direct comparisons of ICH mortality rates between cohorts. In addition, it needs to be emphasized that our lifetime ICH estimates act as cumulative lifetime risks on a population level rather than risks applicable to an individual of a specific age. Although it is well known that ICH risk increases with advancing age in hemophilia and in the general population,37 this ICH risk seems to follow an U-shaped curve over lifetime in hemophilia. Previous studies observed peak incidences in neonates, young children aged 0 to 4 years, and in older patients from age 40 to 50 years onward.14,19,22 Only 3 studies provided age-stratified ICH rates in our review, which hampered a robust assessment for particular groups of interest, such as elderly patients and young children. The scarcity of evidence on age-specific ICH incidences highlights the need for age stratification in future studies.
Determinants of ICH
Several determinants have been described to increase ICH risk in populations with hemophilia, including age, severe hemophilia, HIV infection, inhibitors, prior ICH, on demand therapy, and African American ethnicity.3,21,22,41 We did not find any clear difference in ICH rates between hemophilia A and B, which is in line with previous reports.14,21,22 The influence of potential determinants of ICH risk was beyond the scope of the current study and warrants more detailed evaluation in future reviews. To gain insight into the characteristics of ICH in this population, we investigated the occurrence of spontaneous ICH and locations of intracranial bleeds. We observed that spontaneous hemorrhages were relatively common, with pooled proportions of 0.58 for lifetime ICH and 0.35 for ICH in children and young adults with hemophilia. However, trivial head trauma without clear impact may easily lead to misclassification as spontaneous hemorrhage. Especially for subdural hematomas, the majority of bleeds are preceded by trauma and true spontaneous bleeds seem to be rare.42,43 In neonates, we found a higher percentage of ICH events after assisted vaginal delivery, which is a well-known risk factor for intracranial bleeds.7,31 It has yet to be determined how improved care and life expectancy of patients with hemophilia will influence the incidence of ICH in the coming decades. Better care and fewer HIV infections may reduce ICH risk, whereas, on the other hand, age-related comorbidities provoking ICH may become more common. We included 3 consecutive cohort studies in The Netherlands in our review, which reported ICH mortality rates of 0.4, 1.6, and 0.5 cases per 1000 person-years in the periods from 1973 to 1986, 1986 to 1992, and 1992 to 2001, respectively.44-46 However, the most recent study from this group reported an increase in the ICH mortality rate to 1.3 cases per 1000 person-years in the period from 2001 to 2018.47 It is uncertain to what extent comorbidities may have contributed to this risk, and it highlights the need for further research into (preventable) determinants to mitigate the occurrence of intracranial bleeding in hemophilia.
Clinical implications
Our findings suggest that adequate follow-up and monitoring of patients are warranted among all ages, especially in the presence of risk factors. Prophylaxis seems to halve ICH risk in children and adults with severe hemophilia,3,22 which supports existing recommendations encouraging early initiation of prophylactic treatment.48 Future studies are required to evaluate to what extent novel nonreplacement and gene therapies reduce ICH risk. In particular, there is an urgent need to investigate the benefits of novel therapies in young children. Furthermore, research should focus on the role of established ICH risk factors, such as hypertension, and the concomitant use of antithrombotic agents,49,50 which may become increasingly prevalent in the ageing hemophilia population as comorbidities increase. In light of the observed higher prevalence of hypertension in patients with hemophilia compared with the general population and the associated risk of bleeding, the recently published World Federation of Hemophilia guidelines recommend regular hypertension screening in all patients with hemophilia.51 The potential effect of this pragmatic approach has yet to be established. Other practical suggestions may include adequate counseling of patients with hemophilia and their families on ICH risks and symptoms. In case of a suspected brain hemorrhage or head trauma, clinical management should take place at a hemophilia treatment facility. In neonates, our data support the need for an active pedigree approach for genetic testing and comprehensive counseling of pregnant carriers. When an affected infant is expected, invasive procedures should be avoided, as recommended.52 However, it should be noted that ∼50% of affected neonates are born without a known family history, hampering any precautionary perinatal measures. We reported ICH incidences of 0.062% in neonates in the general population and 2.1% in neonates with hemophilia. Because hemophilia occurs in ∼1 per 5000 live male births,53 it can be estimated that 1 in every 150 male neonates presenting with ICH is affected with hemophilia. This encourages early diagnostic work-up for bleeding disorders in newborns with unexplained ICH.
Strengths and limitations
To our knowledge, this is the first systematic review of lifetime ICH incidence and mortality rates in hemophilia. The strengths of our review are the quality assessments and calculation and estimation of rates taking time under observation into account, which made inclusion of many studies possible. Furthermore, because standard meta-analysis methods may give biased results in the event of sparse or no event data, we applied random-effects generalized linear mixed models.12 Our study also had several limitations. Accurate capture of the true frequency of ICH is challenged by considerable clinical heterogeneity. Included studies were heterogeneous in terms of setting, time period, population characteristics, and types of ICH, limiting precision and generalizability of the pooled estimates. Most studies used a retrospective design, increasing the chance of survivor bias. Thus, undiagnosed neonates who died from ICH may have been missed. In addition, some studies evaluated ICH in cohorts that consisted of living patients only; as a consequence, they lacked fatal ICH events. Consequently, incidence is likely to be underestimated. Future reviews are needed to robustly assess how established risk factors contribute to ICH occurrence in this population. Other limitations arise from limited data on person-years. For 19 studies, we estimated the number of person-years, because it was not reported in the original article; this might have differed from the actual number of person-years. However, the sensitivity analyses that included studies with exact person-years demonstrated similar ICH rates for most populations. In spite of these limitations, this study is a systematic compilation of available evidence on ICH incidence and mortality rates in hemophilia.
Conclusions
In this systematic review and meta-analysis, we found high ICH incidence and mortality rates in patients with hemophilia. Our findings suggest that ICH is still an important problem in hemophilia requiring adequate counseling of patients of all ages.
Acknowledgments
The authors thank René Spijker (Amsterdam University Medical Center [Amsterdam UMC], Amsterdam, The Netherlands) for expert support in designing the literature search, and Mike Soucie Division of Blood Disorders, Centers for Disease Control and Prevention, Atlanta, GA, Evelien Mauser-Bunschoten (Van Creveldkliniek, University Medical Center Utrecht, Utrecht, The Netherlands), and Amanda Okolo (Indiana Hemophilia and Thrombosis Center, Indianapolis, IN) for providing clarifying details for their studies.
This work was supported by a grant from Sobi.
Authorship
Contribution: A.F.-Z., S.C.G., M.C., J.G.V.d.B., and K.F. designed the research; Q.H., X.F., and S.K.K. contributed data; A.-F.Z., J.S.J., C.V., and S.C.G. collected and interpreted data; A.F.-Z. analyzed data; A.F.-Z., S.C.G., and K.F. wrote the manuscript; and all authors approved the final version of the manuscript.
Conflict-of-interest disclosure: S.C.G. has received an unrestricted research grant from Sobi. M.C. has received financial research support from Bayer, CSL Behring, Daiichi Sankyo, Portola/Alexion, Roche, Sanquin Blood Supply Foundation, and uniQure and consultancy or lecture fees from Bayer, CSL Behring, MEDCON International, MEDtalks, Novo Nordisk, Pfizer, and Sobi. J.G.V.d.B. has received unrestricted institutional research grants from Novo Nordisk and her institution received consultancy/lecturing fees from Bayer. K.F. has received unrestricted institutional research grants from Sobi, Pfizer, CSL Behring, and Novo Nordisk and her institution has consultancy fees from Grifols, Takeda, Novo Nordisk, and Roche. The remaining authors declare no competing financial interests.
Correspondence: Karin Fijnvandraat, Department of Pediatric Hematology, Amsterdam UMC, Meibergdreef 9, 1105 AZ Amsterdam, The Netherlands; e-mail: c.j.fijnvandraat@amsterdamumc.nl.
All data analyzed for this study can be derived from the tables and supplemental material.
The online version of this article contains a data supplement.
There is a Blood Commentary on this article in this issue.
The publication costs of this article were defrayed in part by page charge payment. Therefore, and solely to indicate this fact, this article is hereby marked “advertisement” in accordance with 18 USC section 1734.

This feature is available to Subscribers Only
Sign In or Create an Account Close Modal