

Key Points
IFNα targets homozygous JAK2V617F HSPCs more efficiently than heterozygous JAK2V617F HSPCs.
Heterozygous JAK2V617F HSPCs are more rapidly depleted by high doses than low doses of IFNα.

Abstract
Classical BCR-ABL–negative myeloproliferative neoplasms (MPNs) are clonal disorders of hematopoietic stem cells (HSCs) caused mainly by recurrent mutations in genes encoding JAK2 (JAK2), calreticulin (CALR), or the thrombopoietin receptor (MPL). Interferon α (IFNα) has demonstrated some efficacy in inducing molecular remission in MPNs. To determine factors that influence molecular response rate, we evaluated the long-term molecular efficacy of IFNα in patients with MPN by monitoring the fate of cells carrying driver mutations in a prospective observational and longitudinal study of 48 patients over more than 5 years. We measured the clonal architecture of early and late hematopoietic progenitors (84 845 measurements) and the global variant allele frequency in mature cells (409 measurements) several times per year. Using mathematical modeling and hierarchical Bayesian inference, we further inferred the dynamics of IFNα-targeted mutated HSCs. Our data support the hypothesis that IFNα targets JAK2V617F HSCs by inducing their exit from quiescence and differentiation into progenitors. Our observations indicate that treatment efficacy is higher in homozygous than heterozygous JAK2V617F HSCs and increases with high IFNα dose in heterozygous JAK2V617F HSCs. We also found that the molecular responses of CALRm HSCs to IFNα were heterogeneous, varying between type 1 and type 2 CALRm, and a high dose of IFNα correlates with worse outcomes. Our work indicates that the long-term molecular efficacy of IFNα implies an HSC exhaustion mechanism and depends on both the driver mutation type and IFNα dose.
Introduction
Classical BCR-ABL–negative myeloproliferative neoplasms (MPNs), including polycythemia vera (PV), essential thrombocythemia (ET), and primary myelofibrosis (PMF), are clonal hematologic malignancies in which 1 or several mature blood cell types are overproduced. These diseases favor thrombohemorrhagic events and may transform into secondary acute myeloid leukemia. MPN occurrence is mostly associated with gain-of-function somatic mutations in genes encoding JAK2 (JAK2V617F), calreticulin (CALRm; type 1 CALRdel52 and type 2 CALRins5), or the thrombopoietin receptor (MPLm) that occur in hematopoietic stem cells (HSCs).1-4 Several additional somatic mutations involved in epigenetic regulation, splicing, and transcription factors can modify disease phenotype.5
Interferon α (IFNα), especially pegylated IFNα (eg, Peg-IFNα2a), induces hematologic responses in ET, PV, and some early PMF,6-10 as recently evidenced in a phase 2 clinical trial performed in hydroxyurea (HU)-refractory/intolerant patients with JAK2V617F and CALRm MPNs.11 Phase 3 randomized clinical trials demonstrated that another pegylated IFN, Ropeg-IFNα2b, increased the hematologic response rate compared with HU12 or to phlebotomy13 in patients with PV. Importantly, IFNα, contrary to cytoreductive therapies or JAK inhibitors, can decrease the JAK2V617F variant allele frequency (VAF) in blood cells of approximately 60% of patients, including complete molecular responses in 20% of cases,6,11,12 whereas its impact on CALRm VAF is more debated.11,14-16
However, it remains unknown which factors impact the IFNα-induced long-term molecular response rate. To unravel these determinants, we performed a prospective longitudinal analysis of the long-term dynamics of JAK2V617F, CALRm, and MPLm in hematopoietic stem and progenitor cells (HSPCs) of patients with MPN treated with IFNα. Over 5 years, we collected a rich dataset from 48 patients with early and late progenitors together with the VAF in mature cells. Results from these investigations have permitted us to: (1) investigate how IFNα targets HSPCs differently according to mutation type, zygosity, and dose and (2) build a mathematical model linked to a hierarchical Bayesian inference method that allows us to infer the dynamics of mutated HSCs and their response to IFNα therapy.
Materials and methods
Patients, cell purification, and progenitor cultures
Peripheral blood samples and bone marrow were collected from patients with their written informed consent in accordance with the Declaration of Helsinki, and the study was approved by the Ethics Committee from Centre Hospitalier Universitaire (CHU) Dijon, Saint Louis Hospital, and Gustave Roussy; from Comité de Protection des Personnes Ile de France IV Institutional Review Board (IRB) (agreement from US Department of Health and Human Services IRB 00003835-protocol 2015/59-NICB) and Commission Nationale de l’Informatique et des Libertés (authorization 915663).
Mononuclear cells and granulocytes were purified by a Ficoll density gradient. Granulocytes were isolated, and CD34+ cells were purified by a double-positive magnetic cell sorting system (AutoMACS; Miltenyi Biotec). CD34+ cells were labeled with anti-CD90, -CD34, and -CD38 antibodies (Becton Dickinson), and CD90+CD34+CD38−, CD90−CD34+CD38−, and CD90−CD34+CD38+ cell fractions were sorted at 1 progenitor per well in 96-well plates with a BD Influx cell sorter. Clones were expanded in serum-free medium with a cocktail of human recombinant cytokines containing 1 U/mL erythropoietin (Amgen), 20 ng/mL thrombopoietin (generous gift from Kirin), 10 ng/mL Fms-related tyrosine kinase 3- ligand (Celldex Therapeutics), 10 ng/mL interleukin-3, 20 ng/mL granulocyte colony-stimulating factor, 10 ng/mL interleukin-6 (Miltenyi Biotech), 25 ng/mL stem cell factor, and 5 µg/mL granulocyte-macrophage colony-stimulating factor (Peprotech). Fourteen days later, individual colonies corresponding to the progeny of each progenitor were lysed, and DNA was genotyped for homozygous, heterozygous or wild-type (WT) status as previously described.1,15,17,18
Inclusion, response criteria, and IFNα doses
This prospective, longitudinal, and observational study included 48 patients with ET, PV, or PMF diagnosis according to the 2016 iteration of the World Health Organization classification19 with JAK2V617F, CALRm, or MPLm. These patients were included and followed for ≥3 months after starting Peg-IFNα therapy. Hematologic response was assessed according to the European LeukemiaNet criteria for ET and PV. Prior treatments with other cytoreductive drugs were not excluded.
As indicated in Figure 1A, we first determined the effect of genotype and dose in progenitor and mature cells for the 48 patients. Second, to evaluate the IFNα-induced dynamics of mutated HSCs, we used a mathematical model. Several inclusion criteria were used for the parameter estimation of the mathematical model and the statistical analyses. In our population-based hierarchical framework, even patients with few data points bring information to estimate the population parameters. Thus, to calibrate the model, we included 40 patients for which we have at least 3 data time points. However, the estimation of individual parameters for patients with few data points suffers from overfitting. Therefore, to conduct hypothesis testing between subpopulations (mutation type, dose) that relies on individual parameters, we excluded patients with fewer than 5 progenitor measurements for JAK2V617F (mainly corresponding to intolerant patients). No further CALRm patient was excluded because the model was less complex. Moreover, patients may carry heterozygous and/or homozygous subclones in different proportions. When we analyzed the impact of the zygosity on the response to IFNα and thus studied separately the homozygous and heterozygous subclones, as permitted by our model, it was necessary to exclude the data of patients whose subclones exhibited low clonal fraction (CF; <7%). In our cohort, most CALRm patients carried only heterozygous mutated subclones (10 of 12 cases). For JAK2V617F patients, we defined 2 overlapped subgroups: patients carrying sufficient proportion of heterozygous subclones (17 patients) or homozygous subclones (10 patients) with several patients harboring both (Figure 1B).
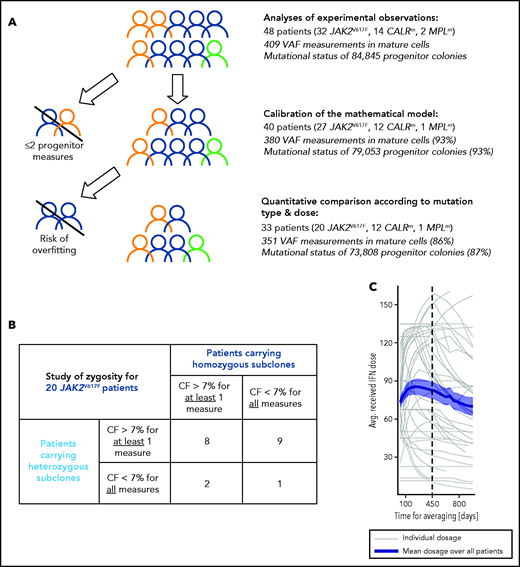
Inclusion criteria for various steps of analyses and IFNα dose. (A) Strategy of analysis and inclusion. Experimental observations were analyzed from progenitor and mature cells of the 48 patients of the cohort. We then excluded patients who had <2 data points (in progenitors and after the start of the therapy) for mathematical model calibration because there is no rationale to try to fit only 2 data points. To rigorously statistically analyze how IFNα doses differently impact molecular response according to the mutation type and zygosity in HSCs, we still had to exclude patients with no more than 5 progenitor type measurements from the start of the therapy for JAK2V617F patients. No CALRm patient was excluded because the model was less complex. The number in parentheses corresponds to the percentage of data used for the analyses. (B) To study the effect of IFNα on HSCs depending on the zygosity, it was necessary to exclude JAK2V617F patients whose clones exhibited too low CF over time. This analysis was not performed for CALRm MPN because only 2 of 12 patients had homozygous mutated cells. For our statistical analyses, a JAK2V617F patient was labeled as carrying homozygous (respectively heterozygous) subclones when CF >7% of homozygous (respectively heterozygous) progenitors were identified from ≥1 of the collected samples. Following this definition, some patients (8) could be considered carrying both heterozygous and homozygous subclones. Using this criterium, 17 patients carry heterozygous subclones and 10 patients carry homozygous subclones. (C) Averaged IFNα dose received over time by the 48 patients. Gray lines, individual dose; blue line, mean dose received by the 48 patients; shaded areas surrounding the curve, standard error of the mean.
Inclusion criteria for various steps of analyses and IFNα dose. (A) Strategy of analysis and inclusion. Experimental observations were analyzed from progenitor and mature cells of the 48 patients of the cohort. We then excluded patients who had <2 data points (in progenitors and after the start of the therapy) for mathematical model calibration because there is no rationale to try to fit only 2 data points. To rigorously statistically analyze how IFNα doses differently impact molecular response according to the mutation type and zygosity in HSCs, we still had to exclude patients with no more than 5 progenitor type measurements from the start of the therapy for JAK2V617F patients. No CALRm patient was excluded because the model was less complex. The number in parentheses corresponds to the percentage of data used for the analyses. (B) To study the effect of IFNα on HSCs depending on the zygosity, it was necessary to exclude JAK2V617F patients whose clones exhibited too low CF over time. This analysis was not performed for CALRm MPN because only 2 of 12 patients had homozygous mutated cells. For our statistical analyses, a JAK2V617F patient was labeled as carrying homozygous (respectively heterozygous) subclones when CF >7% of homozygous (respectively heterozygous) progenitors were identified from ≥1 of the collected samples. Following this definition, some patients (8) could be considered carrying both heterozygous and homozygous subclones. Using this criterium, 17 patients carry heterozygous subclones and 10 patients carry homozygous subclones. (C) Averaged IFNα dose received over time by the 48 patients. Gray lines, individual dose; blue line, mean dose received by the 48 patients; shaded areas surrounding the curve, standard error of the mean.
Patients received variable Peg-IFNα doses over their follow-up (ie, doses were commonly increased within the first months of therapy and then decreased after about 450 days; Figure 1C). Peg-IFNα doses used throughout the article are averages computed over the first 450 days of therapy (supplemental Table 1 available on the Blood Web site). To test the dose effect on the response, we divided patients into high- (HD) and low -dose (LD) groups according to whether the average dose was above or below the median and performed Mann-Whitney U tests. To complement our analyses and avoid this binary distinction between HD and LD, we also considered the dose as a continuous quantity, performed linear regressions (response factor against dose), and tested the nullity of the linear regression coefficients.
Mathematical model
From the absolute numbers of cells, we obtain corresponding clonal fractions by normalization. We assume that IFNα modifies some parameter values after the start of the therapy. These modified parameters are marked with an asterisk.
Statistical inference method
We distinguish 3 populations of patients based on their disease mutation (JAK2V617F, CALRm, or MPLm). Within each population, we estimate patient-specific parameters using a Bayesian hierarchical framework. This population-based approach adds robustness to the results and reduces overfitting. We provide more details about the inference models and their validation in the supplemental Methods.
Results
Study of MPN prospective cohort treated with IFNα
In a prospective observational study performed over 5 years, we included 48 patients with MPN and analyzed their blood samples either before and during IFNα treatment or only during treatment (supplemental Table 1). This cohort includes 21 PV (44%), 22 ET (46%), and 5 PMF (10%). We detected 32 patients with MPN with JAK2V617F, 12 with CALRm (7 type 1 and 5 type 2), 2 with MPLW515K/R, 1 having both JAK2V617F and CALRdel46, and 1 having JAK2V617F, CALRdel52, and MPLS505N (Figure 2A-B). We classified the last 2 cases as CALRm MPN because the CALRm VAF > 0.4 was clearly dominant21 and because the JAK2V617F and CALRm were mutually exclusive in progenitors (supplemental Figure 1). Next-generation sequencing (NGS) of a myeloid-focused panel of 77 genes using genomic DNA isolated from granulocytes identified additional mutations in 31% of these cases (Figure 2C). The median age before treatment was 53 years (range, 25-71 years). The median dose was 71 µg/wk (range, 11-157 µg/wk). Hematologic response was observed in 78% of JAK2V617F, 72% of CALRm, and in the 2 MPLm cases. Side effects leading to treatment discontinuation were observed in 16% and 21% of patients having JAK2V617F and CALRm MPN, respectively. We found 6% to 7% hematologic nonresponders in both JAK2V617F and CALRm cases (Figure 2D).
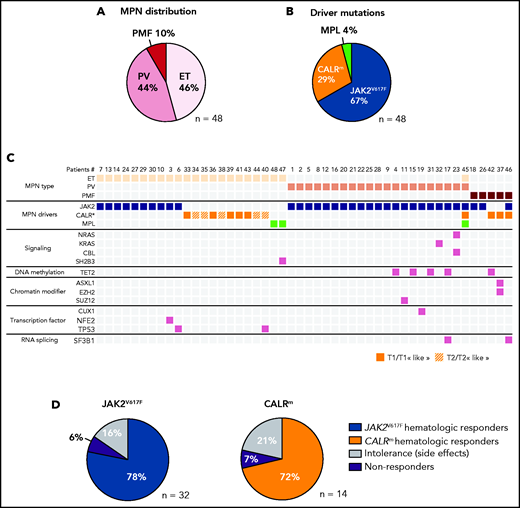
Characterization of the IFNα-treated MPN patient cohort. (A) Distribution of MPN diseases. (B) Distribution of MPN driver mutations. (C) Diseases and the molecular profile determined using an NGS myeloid panel of 77 genes of the first sample collected from the 48 patients in the studied cohort. P45 presented 2 diseases, ET/PV, based on its molecular profile (JAK2V617F and CALRm) and its high platelets count and hematocrit (75%) (D) Percent of hematologic response, nonresponse, or intolerance among patients with JAK2V617F or CALRm MPNs.
Characterization of the IFNα-treated MPN patient cohort. (A) Distribution of MPN diseases. (B) Distribution of MPN driver mutations. (C) Diseases and the molecular profile determined using an NGS myeloid panel of 77 genes of the first sample collected from the 48 patients in the studied cohort. P45 presented 2 diseases, ET/PV, based on its molecular profile (JAK2V617F and CALRm) and its high platelets count and hematocrit (75%) (D) Percent of hematologic response, nonresponse, or intolerance among patients with JAK2V617F or CALRm MPNs.
IFNα targets hematopoietic progenitors differently according to mutation type, zygosity, and dose
Samples were collected longitudinally several times per year, and 5 different cell populations were purified from the peripheral blood for each time point. These cell populations included mature cells (granulocytes and platelets) and different types of progenitors including HSC-enriched progenitors (CD90+CD34+CD38−), immature progenitors (CD90−CD34+CD38−), and committed progenitors (CD90−CD34+CD38+). On the one hand, we performed the global allele burden in granulocytes (409 measures), in platelets (102 measures), and in CD34+ progenitors (175 measures). We observed that, at a given time point, the JAK2V617F VAF correlated in platelets and granulocytes and was similar among all progenitor types (supplemental Figure 2). On the other hand, we performed single-cell colony assay using progenitors for 395 time points. The median number of genotyped progenitor-derived colonies was 226 per time point, and the median clonogenicities were 67%, 71%, and 79% for CD90+CD34+CD38−, CD90−CD34+CD38−, and CD90−CD34+CD38+, respectively. Altogether, we analyzed the genotypes of 84 845 progenitor-derived colonies for the whole cohort (supplemental Figure 3A-D). We observed a significant correlation between the VAF measured from the genotype of progenitor-derived colonies and from the CD34+ progenitor bulk (supplemental Figure 2). For 2 patients, we observed a very close JAK2V617F VAF in progenitors and in granulocytes both in the bone marrow and peripheral blood at a given time point (supplemental Figure 3E).
Using the VAF from the experimental data in granulocytes and progenitors, we monitored the dynamics of JAK2V617F, CALRm, and MPLm cells during IFNα treatment in the 48 patients. Although CALRm VAF remained stable during treatment, the JAK2V617F VAF decreased over time in both mature hematopoietic cells and progenitors. CALRm and JAK2V617F VAF became substantially different after 600 days of treatment. The 2 MPLm cases demonstrated a clear molecular response over time (Figure 3; supplemental Figure 4).
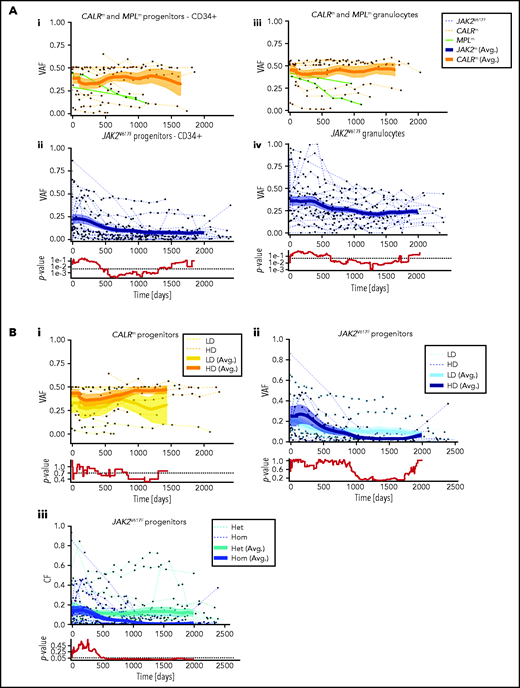
Hematopoietic progenitors are targeted differently according to the driver mutation type or zygosity and the IFNα dose. (A) Effect of IFNα in different hematopoietic compartments during the clinical survey of the 48 patients. Graph lines indicate the VAF calculated in CD34+ progenitors (i-ii) and measured in granulocytes (iii-iv) for CALRm and MPLm patients (i-iii) and JAK2V617F patients (ii-iv). Thin lines, data from each patient harboring JAK2V617F (dotted blue), CALRm (dotted orange), or MPLm (green); thick curves, smoothed averages (floating averages ±100 days) from the 32 JAK2V617F (blue) or 14 CALRm (orange) patient data; surrounding shaded areas, standard error of the mean. P values were calculated between CALRm and JAK2V617F data. Within the first 300 days, there was no significant difference between CALRm and JAK2V617F patient VAF. Significant differences between CALRm and JAK2V617F cases were observed starting from 600 days of treatment in the progenitor compartment using a Mann-Whitney U test (P < .0005). Less difference between CALRm and JAK2V617F VAF was observed in mature cells (P < .025 after 650 days). (B) Effect of IFNα according to driver mutation type or zygosity and the IFNα dose during the clinical survey. The VAF were computed by pooling the data from each of the 3 progenitor compartments for (i) patients with CALRm MPN treated with IFNα at high doses (HD, >78 µg/wk on average) or low doses (LD, <78 µg/wk); (ii) patients with JAK2V617F MPN treated with IFNα at HD (>96.5 µg/wk) or LD (<96.5 µg/wk); and (iii) JAK2V617F heterozygous or homozygous progenitors independently of the doses. Thin line, data from a single patient; thick curves, smoothed averages (floating averages ±100 days) from the JAK2V617F (blue) or CALRm (orange) patient data; shaded areas surrounding the curve, standard error of the mean. Differences were calculated between heterozygous and homozygous JAK2V617F progenitors after 600 days of treatment (Mann-Whitney U test, P < .03) and were significant after 1000 days of treatment (Mann-Whitney U test, P < .003).
Hematopoietic progenitors are targeted differently according to the driver mutation type or zygosity and the IFNα dose. (A) Effect of IFNα in different hematopoietic compartments during the clinical survey of the 48 patients. Graph lines indicate the VAF calculated in CD34+ progenitors (i-ii) and measured in granulocytes (iii-iv) for CALRm and MPLm patients (i-iii) and JAK2V617F patients (ii-iv). Thin lines, data from each patient harboring JAK2V617F (dotted blue), CALRm (dotted orange), or MPLm (green); thick curves, smoothed averages (floating averages ±100 days) from the 32 JAK2V617F (blue) or 14 CALRm (orange) patient data; surrounding shaded areas, standard error of the mean. P values were calculated between CALRm and JAK2V617F data. Within the first 300 days, there was no significant difference between CALRm and JAK2V617F patient VAF. Significant differences between CALRm and JAK2V617F cases were observed starting from 600 days of treatment in the progenitor compartment using a Mann-Whitney U test (P < .0005). Less difference between CALRm and JAK2V617F VAF was observed in mature cells (P < .025 after 650 days). (B) Effect of IFNα according to driver mutation type or zygosity and the IFNα dose during the clinical survey. The VAF were computed by pooling the data from each of the 3 progenitor compartments for (i) patients with CALRm MPN treated with IFNα at high doses (HD, >78 µg/wk on average) or low doses (LD, <78 µg/wk); (ii) patients with JAK2V617F MPN treated with IFNα at HD (>96.5 µg/wk) or LD (<96.5 µg/wk); and (iii) JAK2V617F heterozygous or homozygous progenitors independently of the doses. Thin line, data from a single patient; thick curves, smoothed averages (floating averages ±100 days) from the JAK2V617F (blue) or CALRm (orange) patient data; shaded areas surrounding the curve, standard error of the mean. Differences were calculated between heterozygous and homozygous JAK2V617F progenitors after 600 days of treatment (Mann-Whitney U test, P < .03) and were significant after 1000 days of treatment (Mann-Whitney U test, P < .003).
We investigated whether the dynamics of JAK2V617F and CALRm progenitors vary with different IFNα doses. Although we did not detect any significant effect of IFNα dose on CALRm progenitors (Figure 3Bi), JAK2V617F VAF decreased in progenitors with a better response on detected from day 1000 (Figure 3Bii). Typically, in some individuals with JAK2V617F MPN treated with high IFNα doses, we observed an increase in the JAK2V617F VAF at the beginning of treatment followed by a substantial decrease and spikes in total numbers of progenitor cells, granulocytes, and platelets (bell curves; supplemental Figure 4). In contrast, a progressive and continuous VAF decrease was seen in patients treated with IFNα LD. Finally, progenitors carrying homozygous JAK2V617F were significantly more sensitive to IFNα than those carrying heterozygous JAK2V617F starting from 600 days of treatment (Figure 3Biii).
In aggregate, these results identify a slow clearing of JAK2V617F progenitors over time in IFNα-treated patients, whereas CALRm progenitors are less responsive on average. Moreover, IFNα targets JAK2V617F progenitors faster at HD and is more efficient against homozygous than heterozygous cells.
Inferring IFNα-induced dynamics of mutated HSCs using mathematical and statistical modeling
Potential weaknesses in the analysis of experimental data are a lack of pretreatment evaluation in several patients and the heterogeneity within the most purified HSC fraction (here CD34+CD38−CD90+). To precisely characterize IFNα-induced dynamics of mutated HSCs, progenitors, and mature cells and to infer long-term treatment effects on mutated HSCs, we designed a compartmental mathematical model20 (Figure 4A). This model was used as a rigorous mathematical framework to leverage information from our data. It is based on the hypothesis that IFNα induces latent and unobserved HSC dynamics that impact progenitor cells and granulocytes.22 Cell populations were divided into compartments according to genotype and maturity: inactive HSCs (compartment 1) or active HSCs (compartment 2) that can generate differentiated progenitors (compartment i) that in turn will give rise to mature cells (compartment m). This type of model with 2 HSC compartments could explain the bell curves observed on IFNα treatment in several JAK2V617F patients. The model potentially includes many patient-specific parameters that can lead to risks of overfitting and nonidentifiability. Because it is particularly challenging to infer the parameter values of human HSCs, we made several hypotheses (supplemental Table 2). Because chronic, in contrast to acute, IFNα exposure induces transient proliferation of mouse HSCs followed by a rapid return to quiescence,23-25 we assumed that IFNα barely influences the parameters of normal human HSCs. In addition, we simplified the model to 1 HSC compartment in CALRm patients to avoid overfitting based on reports showing a high clonal advantage of mutated CALRm in the HSPC compartment compared with the JAK2V617F HSCs, suggesting that CALRm HSCs are more active.18,26
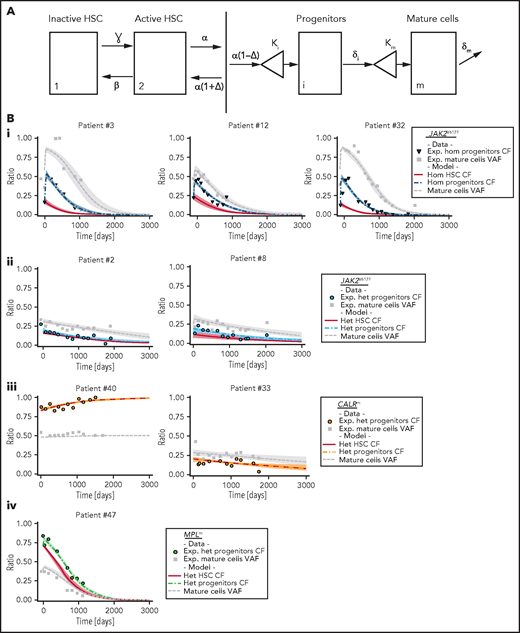
Mathematical model and inferred dynamics of JAK2V617F, CALRm, and MPLm cells. (A) Design of the mathematical model. Mature and fully differentiated cells no longer divide and die at a rate δm. We modeled progenitor cells as originating from active HSCs that divide and encounter several divisions (modeled by the parameter κi). Progenitors exit their compartment at the differentiation rate δi and proliferate (modeled by the parameter κm) before entering the mature compartment. We also introduced 2 stem cell compartments depending on whether the HSC is considered active or inactive (quiescent), parameters ɣ and β model the exchanges between these 2 compartments. We assumed that the active HSCs might be recruited to differentiate at a rate α to contribute to hematopoiesis. Parameter Δ models the propensity of the stem cell pool to be depleted (if Δ < 0) or to expand (if Δ > 0). (B) Examples of dynamics of inferred mutated progenitor, HSC (CF), and mutated mature cells (VAF) are presented. Dynamics focusing on (i) homozygous JAK2V617F cells for 3 patients, (ii) heterozygous JAK2V617F cells from 2 patients, (iii) heterozygous CALRm cells from 2 patients, and (iv) heterozygous MPLm cells from a patient. Dots, square, and triangles, experimental data values; curves, median values determined from the mathematical model; red line, inferred dynamics of mutated HSCs (overlaid with the heterozygous progenitor CF for CALRm cases); shaded areas surrounding each curve, 95% confidence intervals. When comparing mature cells dynamics to heterozygous progenitor dynamics, we must keep in mind that the VAF in progenitor cells would be half the CF.
Mathematical model and inferred dynamics of JAK2V617F, CALRm, and MPLm cells. (A) Design of the mathematical model. Mature and fully differentiated cells no longer divide and die at a rate δm. We modeled progenitor cells as originating from active HSCs that divide and encounter several divisions (modeled by the parameter κi). Progenitors exit their compartment at the differentiation rate δi and proliferate (modeled by the parameter κm) before entering the mature compartment. We also introduced 2 stem cell compartments depending on whether the HSC is considered active or inactive (quiescent), parameters ɣ and β model the exchanges between these 2 compartments. We assumed that the active HSCs might be recruited to differentiate at a rate α to contribute to hematopoiesis. Parameter Δ models the propensity of the stem cell pool to be depleted (if Δ < 0) or to expand (if Δ > 0). (B) Examples of dynamics of inferred mutated progenitor, HSC (CF), and mutated mature cells (VAF) are presented. Dynamics focusing on (i) homozygous JAK2V617F cells for 3 patients, (ii) heterozygous JAK2V617F cells from 2 patients, (iii) heterozygous CALRm cells from 2 patients, and (iv) heterozygous MPLm cells from a patient. Dots, square, and triangles, experimental data values; curves, median values determined from the mathematical model; red line, inferred dynamics of mutated HSCs (overlaid with the heterozygous progenitor CF for CALRm cases); shaded areas surrounding each curve, 95% confidence intervals. When comparing mature cells dynamics to heterozygous progenitor dynamics, we must keep in mind that the VAF in progenitor cells would be half the CF.
We calibrated the model based on the data of 27 JAK2V617F, 12 CALRm, and 1 MPLm cases and chose a hierarchical Bayesian framework to increase robustness. Assuming that patients with the same driver mutation would have comparable parameter values, we considered 3 independent subpopulations (ie, 3 independent parameter distributions in the hierarchical framework; supplemental Figure 5). With relatively few degrees of freedom, our simple model can fit the longitudinal molecular data (supplemental Figure 6) and describe JAK2V617F, CALRm, and MPLm progenitor and mature cell dynamics in patients for up to 3000 days of treatment (Figure 4B; supplemental Figures 7-9).
This model-based approach enabled us to infer the effects of IFNα on mutated HSCs depending on mutation type and zygosity. We inferred rapid depletion of homozygous JAK2V617F HSCs, concomitant in some cases with an initial rapid increase followed by a drastic decrease in both the homozygous JAK2V617F progenitor population and the JAK2V617F granulocytes (Figure 4Bi). Among heterozygous JAK2V617F cells, we inferred slow and simultaneous depletion of HSCs, progenitors, and granulocytes (Figure 4Bii). The dynamics of CALRm cells (10 of 12 patients had no homozygous subclones) were more heterogenous, with a slow depletion in the patients presenting a molecular response (Figure 4Biii). Finally, we deduced a rapid depletion of heterozygous MPLm HSCs (Figure 4Biv).
In summary, the inferred latent HSC dynamics agree with our observations in progenitors and mature cells, and our data support our working hypothesis that IFNα is acting on mutated HSCs.
HSCs are targeted differently according to mutation type, zygosity, and IFNα doses
Most patients with CALRm in our cohort have heterozygous mutated cells. Therefore, we quantified the long-term heterozygous molecular response in HSCs after 3000 days by estimating the R factor (response factor), defined as the mutated HSC proportion (or CF) relative to its initial value. We observed a heterogeneous molecular response in CALRm HSCs, such that higher IFNα doses correlated with a poorer HSC response (Figure 5Ai; supplemental Figure 11i). Although few patients were analyzed, type 2 CALRm HSCs were targeted more effectively than type 1 CALRm HSCs (Figure 5Aii).
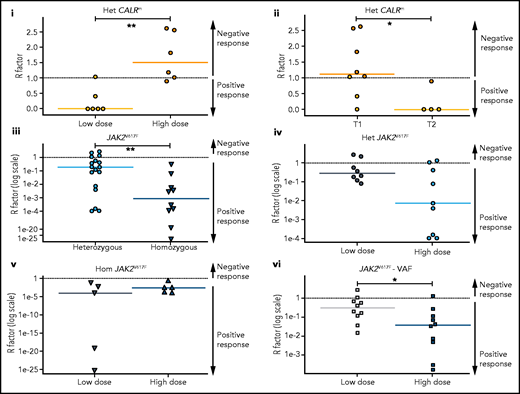
HSC are targeted differently according to driver mutation type and zygosity and the IFNα doses. Molecular stem cell response factor (R factor) was predicted at the end of the survey (3000 days) for (i) heterozygous CALRm HSCs in patients treated with high vs low IFNα doses, (ii) heterozygous type 1 vs heterozygous type 2 CALRm HSCs, (iii) heterozygous vs homozygous JAK2V617F HSCs, (iv) heterozygous JAK2V617F HSCs in patients treated with high vs low IFNα doses, (v) homozygous JAK2V617F HSCs in patients treated with high vs low IFNα doses, and (vi) global JAK2V617F HSCs in patients treated with high vs low IFNα doses. The R factor is defined as the ratio (median value) between the inferred mutated HSC proportion after a given time of treatment (t = 3000 days) over the proportion of mutated HSCs at the initial time. Depending on the context, it refers to heterozygous or homozygous CF or VAF. Dash lines, R = 1 for no response, R > 1 for a negative response, and R < 1 for a positive response. R < 0.5 corresponds to a PMR, and R ∼ 0 corresponds to a complete molecular response. Solid lines, R median. R significantly differs between heterozygous CALRm HSC with low vs high IFNα doses (Mann-Whitney U test, P = .0087) and between type 1 CALRm and type 2 CALRm (Mann-Whitney U test, P = .0162). R significantly differs between heterozygous and homozygous JAK2V617F HSCs (Mann-Whitney U test, P = .0047). R tends to differ between heterozygous JAK2V617F HSCs treated with high vs low IFNα doses (Mann-Whitney U test, P = .0745). R significantly differs in the global JAK2V617F VAF in HSC between treatment with high and low doses of IFNα (Mann-Whitney U test, P = .0288). For each patient, we computed an average of received IFNα doses over the first 450 days of treatment. HD vs LD are defined according to the median dose of the groups of considered patients. The threshold is automatically computed to compare 2 subgroups of patients of the same size. The dose thresholds of IFNα are 78 µg/wk for heterozygous CALRm HSCs, 96.5 µg/wk for JAK2V617F HSCs, 96 µg/wk for heterozygous JAK2VF617F HSCs, and 108 µg/wk for homozygous JAK2V617F HSCs. Statistical differences were calculated using a Mann-Whitney U test: *P < .05, **P < .01.
HSC are targeted differently according to driver mutation type and zygosity and the IFNα doses. Molecular stem cell response factor (R factor) was predicted at the end of the survey (3000 days) for (i) heterozygous CALRm HSCs in patients treated with high vs low IFNα doses, (ii) heterozygous type 1 vs heterozygous type 2 CALRm HSCs, (iii) heterozygous vs homozygous JAK2V617F HSCs, (iv) heterozygous JAK2V617F HSCs in patients treated with high vs low IFNα doses, (v) homozygous JAK2V617F HSCs in patients treated with high vs low IFNα doses, and (vi) global JAK2V617F HSCs in patients treated with high vs low IFNα doses. The R factor is defined as the ratio (median value) between the inferred mutated HSC proportion after a given time of treatment (t = 3000 days) over the proportion of mutated HSCs at the initial time. Depending on the context, it refers to heterozygous or homozygous CF or VAF. Dash lines, R = 1 for no response, R > 1 for a negative response, and R < 1 for a positive response. R < 0.5 corresponds to a PMR, and R ∼ 0 corresponds to a complete molecular response. Solid lines, R median. R significantly differs between heterozygous CALRm HSC with low vs high IFNα doses (Mann-Whitney U test, P = .0087) and between type 1 CALRm and type 2 CALRm (Mann-Whitney U test, P = .0162). R significantly differs between heterozygous and homozygous JAK2V617F HSCs (Mann-Whitney U test, P = .0047). R tends to differ between heterozygous JAK2V617F HSCs treated with high vs low IFNα doses (Mann-Whitney U test, P = .0745). R significantly differs in the global JAK2V617F VAF in HSC between treatment with high and low doses of IFNα (Mann-Whitney U test, P = .0288). For each patient, we computed an average of received IFNα doses over the first 450 days of treatment. HD vs LD are defined according to the median dose of the groups of considered patients. The threshold is automatically computed to compare 2 subgroups of patients of the same size. The dose thresholds of IFNα are 78 µg/wk for heterozygous CALRm HSCs, 96.5 µg/wk for JAK2V617F HSCs, 96 µg/wk for heterozygous JAK2VF617F HSCs, and 108 µg/wk for homozygous JAK2V617F HSCs. Statistical differences were calculated using a Mann-Whitney U test: *P < .05, **P < .01.
In contrast, we observed a molecular response in most HSCs from JAK2V617F patients, with an R factor significantly better for homozygous than for heterozygous HSCs (Figure 5Aiii). There was an improved response of heterozygous JAK2V617F HSCs on treatment with HD of IFNα (P = .0745 with the Mann-Whitney U test; P = .0498 when testing the nullity of the linear regression coefficient; Figure 5Aiv), but no strong dose effect on the response of homozygous HSCs (Figure 5Av). When analyzing the global JAK2V617F VAF, patients treated with HD of IFNα responded the best (Figure 5Avi). In addition, we observed a clear tendency for better responses while continuously increasing the doses (supplemental Figure 11ii,iv).
We next inferred the median time to achieve a 50% reduction of R factor (partial molecular response [PMR]) in mutated HSCs. Homozygous JAK2V617F HSCs were depleted faster than heterozygous JAK2V617F HSCs in responding patients (350 days vs 920 days, respectively; supplemental Figure 11Bi). The IFNα dose significantly reduced the PMR in heterozygous HSCs (supplemental Figure 11Bii) but not in homozygous HSCs (supplemental Figure 11Biii). In comparison, while receiving a LD of IFNα, we estimated that patients with MPLm and type 2 CALR reached the PMR approximately at 600 days (supplemental Figure 11iv).
In patients with predominantly JAK2V617F cells, we found no evidence that the disease type (PV or ET), patient age at treatment initiation, sex, or the presence of associated mutations influences the mutated stem cell dynamics (supplemental Table 1).
In summary, we inferred that the molecular response at the HSC level induced by IFNα is dependent on the type of mutation (JAK2V617F, type 1/2 CALRm), JAK2V617F zygosity, and IFNα dose.
IFNα differentially impacts on JAK2V617F and CALRm HSC homeostasis
The mathematical model built to describe the dynamics of HSPCs also aims to provide insights on IFNα mechanism of action. The 2 critical parameters introduced in the model to describe IFNα effects are Δ* and ɣ*:Δ*het and ɣ*het for heterozygous cells and Δ*hom and ɣ*hom for homozygous cells. The first parameter Δ* indicates the self-renewal divisions of mutated HSCs under IFNα and becomes negative if divisions generate more differentiated cells, eventually leading to HSC exhaustion. The second parameter ɣ* describes the rate at which quiescent mutated HSCs become active. An increase of ɣ* means that more mutated HSCs are active and available to contribute to hematopoiesis.
In patients with JAK2V617F MPN, we estimated that IFNα induces negative values for Δ*het and Δ*hom (−0.20 and −0.29, respectively; Figure 6Ai; supplemental Figure 12i), indicating, according to our modeling, that IFNα would promote differentiating divisions of mutated HSCs leading to the exhaustion of that compartment. The Δ* values were found to differ significantly between patients with JAK2V617F MPN and those with CALRm MPN, suggesting a mechanism of action of IFNα relying on JAK2V617F HSC depletion (Figure 6Ai; supplemental Figure S12i,iii). Nevertheless, the estimated Δ* values of type 2 CALRm HSCs were significantly reduced compared with type 1 CALRm HSC (Figure 6Aii). Finally, IFNα would promote more exit from quiescence of homozygous JAK2V617F HSC compared with heterozygous JAK2V617F HSCs, as indicated by the estimated ɣ* values (Figure 6Aiii; supplemental Figure 12ii).
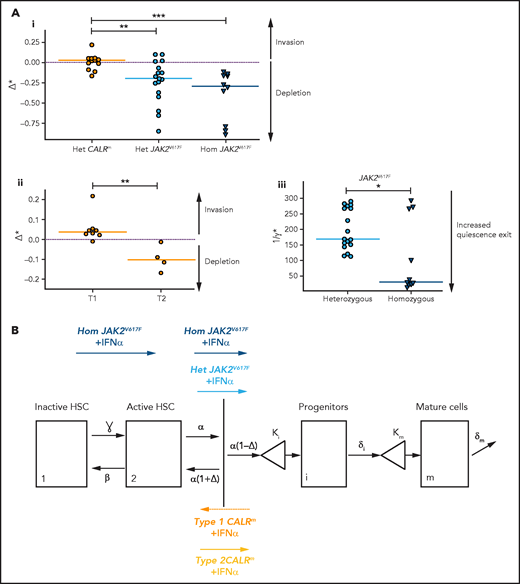
IFNα differentially impacts on JAK2V617F and CALRm HSC homeostasis. (A) Graphs indicate the means values (solid lines) of the estimated parameters calculated using the mathematic model. (i) Δ* parameters were calculated in heterozygous and homozygous JAK2V617F HSCs and heterozygous CALRm HSCs. Δ*het significantly differs in patients with CALRm MPN vs those having JAK2V617F MPN (Mann-Whitney U test, P = .0031). Δ*het in patients with CALRm MPN is significantly different from Δ*hom of those having JAK2V617F MPN (Mann-Whitney U test, P < .0001). The dotted lines indicate Δ* = 0. Δ* > 0 corresponds to an expansion, and Δ* < 0 corresponds to a depletion of the stem compartment. (ii) Δ*het parameters were calculated in type 1 and type 2 CALRm HSCs. Δ*het significantly differs in patients with type 1 CALRm MPN vs those with type 2 CALRm MPN (Mann-Whitney U test, P = .004). (iii) Inverse ratios of the ɣ* parameter was calculated in heterozygous vs homozygous JAK2V617F HSCs. The 1/ɣ* value can be seen as a relative time spent by cells in the inactive compartment of our model. The 1/ɣ* significantly differs in heterozygous vs homozygous JAK2V617F HSCs (Mann-Whitney U test, P = .027). (B) Proposed mechanism of IFNα in JAK2V617F and CALRm HSCs.
IFNα differentially impacts on JAK2V617F and CALRm HSC homeostasis. (A) Graphs indicate the means values (solid lines) of the estimated parameters calculated using the mathematic model. (i) Δ* parameters were calculated in heterozygous and homozygous JAK2V617F HSCs and heterozygous CALRm HSCs. Δ*het significantly differs in patients with CALRm MPN vs those having JAK2V617F MPN (Mann-Whitney U test, P = .0031). Δ*het in patients with CALRm MPN is significantly different from Δ*hom of those having JAK2V617F MPN (Mann-Whitney U test, P < .0001). The dotted lines indicate Δ* = 0. Δ* > 0 corresponds to an expansion, and Δ* < 0 corresponds to a depletion of the stem compartment. (ii) Δ*het parameters were calculated in type 1 and type 2 CALRm HSCs. Δ*het significantly differs in patients with type 1 CALRm MPN vs those with type 2 CALRm MPN (Mann-Whitney U test, P = .004). (iii) Inverse ratios of the ɣ* parameter was calculated in heterozygous vs homozygous JAK2V617F HSCs. The 1/ɣ* value can be seen as a relative time spent by cells in the inactive compartment of our model. The 1/ɣ* significantly differs in heterozygous vs homozygous JAK2V617F HSCs (Mann-Whitney U test, P = .027). (B) Proposed mechanism of IFNα in JAK2V617F and CALRm HSCs.
Altogether, we inferred that IFNα leads to JAK2V617F and type 2 CALRm HSC depletion by decreasing their tendency to self-renew. Moreover, IFNα would increase the exit of homozygous JAK2V617F HSC from quiescence.
Discussion
This prospective, longitudinal analysis of patients with MPN treated with IFNα over a 5-year period generates a rich dataset that, combined with mathematical modeling and hierarchical Bayesian inference, identifies the differential molecular responses of JAK2V617F, MPLm, and CALRm MPNs.
As previously reported from clinics, we observed high hematologic response rates in MPN regardless of the type of disease type and driver mutation.6-10 The global molecular response in granulocytes presented a decrease in VAF for JAK2V617F MPN in agreement with the literature.6,7,11,12 Moreover, our results confirm the heterogeneity in molecular responses of CALRm MPN. Overall, CALRm MPNs are less likely than JAK2V617F MPN to exhibit a molecular response in mature cells.11,14-16,27,28 We also investigated the dynamics of HSPCs targeted by IFNα in unprecedented detail and generally observed better molecular responses in JAK2V617F than in CALRm progenitors. These results contrast with the enhanced hematologic response to IFNα and longer survival of CALRm than JAK2V617F patients in several studies,11,27,29 potentially because IFNα has a general deleterious effect during megakaryopoiesis, which limits thrombocytosis in a disease restricted to the megakaryocytic lineage.30
The proposed mathematical model combined with statistical inference methods was proven to not only fit the experimental data for progenitors and mature cells but also infer long-term molecular responses in patients rarely sampled. It further enables us to characterize HSC dynamics that are inaccessible by direct cell isolation as the CD90+CD34+CD38− cell fraction remains heterogeneous and would require single cell “omics” experiments to be finely characterized. With this model, we gained insights into the molecular effects of IFNα on progenitors and disease-initiating HSCs according to the type of driver mutation and IFNα dose. We found that IFNα targets efficiently most JAK2V617F HSCs and preferentially homozygous JAK2V617F HSCs, in agreement with our previous data for mature cells.31 Although there are few patients, our results suggest that IFNα preferentially targets type 2 CALRm rather than type 1 CALRm HSCs. Moreover, HD of IFNα were more effective than LD in targeting heterozygous JAK2V617F HSCs. In heterozygous CALRm HSCs, higher IFNα doses correlated with a poorer response. This correlation could be because of poor hematologic response that led to increasing the IFNα dose by the treating physicians. There is at present no evidence to support HD of IFNα treatment to achieve long-term molecular response in patients with CALRm. The model will need to be improved to account more precisely for time-varying treatment schedules. Interestingly, for patients with JAK2V617F, not the type of disease nor age nor the number of associated mutations (1, 2, or 3) at the beginning of the treatment impacted the HSC dynamics. Nevertheless, we note that our study has limited power to detect effects of mutations in TET2, DNMT3A, or TP537 because very few patients in our cohort presented such mutations. Our ability to infer effects of genetic polymorphisms involved in the response to IFNα, such as IFNL4, is limited by their moderate effect sizes.32
The mechanisms by which IFNα specifically targets JAK2V617F or CALRm cells are still largely unknown. By combining mathematical modeling and Bayesian inference, we inferred that IFNα slowly depletes homozygous and heterozygous JAK2V617F HSCs with half-lives of approximately 12 and 31 months, respectively. Based on an independent cohort of similar size to ours, Pedersen et al33 recently reported that, in responders to IFNα treatment, JAK2V617F VAF decreased in granulocytes with a typical half-life between 1 and 2 years. They also observed that an initial increase in mutated granulocytes preceded the fastest rates of decrease as we also observed in several patients a temporary increase in the frequency of JAK2V617F homozygous progenitors followed by a decrease. Thus, a VAF increase at the beginning of the treatment is not necessarily associated with a pejorative long-term molecular response. These results also fit well with a previously observed increase in progenitors in the bone marrow of patients with JAK2V617F shortly after IFNα treatment.34 The experimental dynamics are consistent with a mathematical model in which the treatment exhausts heterozygous and homozygous JAK2V617F HSCs by promoting their exit from quiescence and differentiation into progenitors. Moreover, we inferred that IFNα depletes homozygous JAK2V617F HSCs by differentiation much more effectively than heterozygous JAK2V617F HSCs. Although its effect on CALRm HSCs is weaker, IFNα depletes type 2 more than type 1 CALRm HSCs. The treatment would also preferentially favor the exit from quiescence of homozygous JAK2V617F HSCs. Similarly, in the JAK2V617F mouse model, IFNα has been shown to enhance mutated HSC proliferation and exit from quiescence, resulting in an increase in total number of progenitors.22,35,36 Although the main mechanism of IFNα inferred by the mathematical model is HSC exhaustion by differentiation for both JAK2V617F and type 2 CALRm HSCs, several other mechanisms might be considered. In contrast to our dynamic study, Tong et al37 found, at 1 time point after IFNα treatment using Target-Seq, an increased quiescence in homozygous and apoptosis in heterozygous JAK2V617F HSPCs. It is possible that such pathways could be found in the remaining nontargeted JAK2V617F HSPCs at a later time point or that several mechanisms such as senescence or apoptosis might cooperate to reinforce the HSC exhaustion.34,35,37-39 Characterizing such additional factors will require more experimental data coupled with a more sophisticated model. It would also be essential to address the exact signaling mechanism of HSC depletion on IFNα. Reactive oxygen species increase, P53 and STAT1 overactivation, and a specific priming of IFNα signaling have been reported with JAK2V617F35 but not with CALRm.16 In contrast, CALRm but not JAK2V617F is secreted and might deregulate the immune response induced by IFNα.40 Our study also suggests that the weakest molecular responders are the type 1 CALRm HSCs, potentially because this type of mutation deregulates specific signaling pathways that lead to a stronger amplification at the HSC level compared with type 2 CALRm.18,41
Current administration of IFNα in clinical practice is neither standardized nor tailored to the causal mutation. Treatment strategies are guided primarily by hematologic response and tolerability. Our work indicates that the efficacy of IFNα exhausting mutated HSCs depends on the driver mutation type in HSCs. Moreover, it suggests that dose titration to maximally tolerated dose may be more likely to achieve reduction in JAK2V617F HSCs and therefore attain hematologic response. Therefore, the dose intensity should be ideally maintained over treatment. Altogether, this study will open new avenues of research aiming to understand the precise differential effects of JAK2V617F and CALRm on MPN initiating HSCs.
Acknowledgments
The authors thank Gustave Roussy (Y. Lecluse) for the cytometry platform; the patients that participated in this biological protocol; the nurses for providing the samples; all trainees that contributed to the work; and E. Leclercq and M. H. Courtier for technical assistance in CALR sizing.
This work was supported by grants from the Myeloproliferative Neoplasms (MPN) Research Foundation, Institut National du Cancer (INCA Plbio2014, INCA Plbio2018) (I.P. and J.-L.V.), Ligue Nationale Contre le Cancer (for HR, Équipe Labellelisée 2019). I.P. and P.-H.C. received grants for the Prism Project, funded by the Agence Nationale de la Recherche under grant ANR-18-IBHU-0002, and for the Appel à Projets Pré-néoplasies 2021 (C21021LS) with financial support from Institut Thématique Multi-Organismes (ITMO) Cancer of Aviesan within the framework of the 2021-2030 Cancer Control Strategy, on funds administered by INSERM. Labex d'Excellence Globules Rouges (GR-Ex) (I.P. and J.-J.K.) is funded by the “Investissements d’Avenir” program M.M. was supported by grants from la Ligue Nationale Contre le Cancer, Société Française d’Hématologie (SFH), and Gustave Roussy Foundation. M.E.-K. was supported by the SFH. A.T. was supported by a Ministere de l'Education Nationale de la Recherche et de la Technologie (MENRT) grant, and G.V. was supported by a Fonds National de la Recherche Scientifique (FNRS) fellowship. R.N. acknowledges support from European ResearchCouncil (ERC) Synergy Grant 609883 and the National Institutes of Health, National Cancer Institute under award U54CA217376.
The content is solely the responsibility of the authors and does not necessarily represent the official views of the National Institutes of Health. This manuscript was edited at Life Science Editors.
Authorship
Contribution: M.M. and A.T. performed experiments, analyzed data, and wrote the manuscript; G.H. and R.N. performed the mathematical model, analyzed the data, and wrote the manuscript; C. Marzac and C.G. performed NGS myeloid panel and CALR sizing; B.C. performed NGS myeloid panel; G.V. and M.E.-K. performed experiments and analyzed data; P.R. and C.C. performed cytometry analysis; H.C., J.L., N.C., E.S., J.-J.K., F.P., F.G., and R.F. followed patients and provided samples; C.L.S. contributed to the mathematical model and analyzed the data; S.N.C., C. Marty, H.R., and J.-L.V. contributed to the research design; M.E.H. contributed to the research design of the mathematical model; W.V. followed patients, provided samples, and contributed to the research design; P.-H.C. supervised the study on the mathematical model, interpreted data, and wrote the paper; I.P. supervised the study, planned research, interpreted data, and wrote the paper; and all authors revised the manuscript.
Conflict-of-interest disclosure: J.-J.K. is consultant for AOP orphan. The remaining authors declare no competing financial interests.
Correspondence: Isabelle Plo, UMR INSERM U1287, Gustave Roussy, 114 rue Edouard Vaillant, 94805 Villejuif, France; e-mail: isabelle.plo@gustaveroussy.fr.
The online version of this article contains a data supplement.
There is a Blood Commentary on this article in this issue.
The publication costs of this article were defrayed in part by page charge payment. Therefore, and solely to indicate this fact, this article is hereby marked “advertisement” in accordance with 18 USC section 1734.

This feature is available to Subscribers Only
Sign In or Create an Account Close Modal