

Key Points
GATA2 ASE is a somatic event strongly associated with CEBPA DMs in AML.
GATA2 ASE results from silencing of 1 allele by promoter methylation and overactivation of a superenhancer in the other allele.

Abstract
Transcriptional deregulation is a central event in the development of acute myeloid leukemia (AML). To identify potential disturbances in gene regulation, we conducted an unbiased screen of allele-specific expression (ASE) in 209 AML cases. The gene encoding GATA binding protein 2 (GATA2) displayed ASE more often than any other myeloid- or cancer-related gene. GATA2 ASE was strongly associated with CEBPA double mutations (DMs), with 95% of cases presenting GATA2 ASE. In CEBPA DM AML with GATA2 mutations, the mutated allele was preferentially expressed. We found that GATA2 ASE was a somatic event lost in complete remission, supporting the notion that it plays a role in CEBPA DM AML. Acquisition of GATA2 ASE involved silencing of 1 allele via promoter methylation and concurrent overactivation of the other allele, thereby preserving expression levels. Notably, promoter methylation was also lost in remission along with GATA2 ASE. In summary, we propose that GATA2 ASE is acquired by epigenetic mechanisms and is a prerequisite for the development of AML with CEBPA DMs. This finding constitutes a novel example of an epigenetic hit cooperating with a genetic hit in the pathogenesis of AML.
Introduction
Transcriptional deregulation is a central event in cancer development.1 In acute myeloid leukemia (AML), most driver mutations occur in genes related to transcription, RNA splicing, chromatin regulation, and/or DNA methylation.2 In addition to mutations in protein-coding genes, alterations involving cis-regulatory elements play a critical role in aberrant gene expression in AML.3 Examples include aberrant expression of EVI1 through translocation of the distal GATA2 superenhancer in AML with 3q26 aberrations4 or focal amplification of distal MYC enhancers in AML with copy-number changes in 8q24.5 Other mechanisms identified in other malignancies include DNA alterations in cis-regulatory regions6 and changes in binding sites for CTCF and cohesin.7 Finally, in the absence of sequence variation, DNA methylation can modify gene expression, either directly by inducing promoter silencing8 or by preventing CTCF binding.9
Alterations in cis-regulatory regions usually affect a single DNA copy, leading to unbalanced expression of each allele controlled by these regulatory regions. For example, the gain of a superenhancer selectively increases gene expression only in the allele in which the new superenhancer is created.10 This phenomenon, termed allele-specific expression (ASE), can therefore serve as a telltale marker for cis-regulatory variation.11 In addition to acting as a surrogate marker, ASE can directly play a pathogenic role (eg, by haploinsufficiency or preferential expression of a mutated protein).12 Moreover, ASE of specific genes may be associated with increased risk of cancer development13 or progression,14 as has been shown for colon,15 breast, and ovarian cancers.16
Extensive data focusing on the occurrence and relevance of ASE in AML are lacking. Here, we carried out a systematic study of genes with aberrant ASE in AML to uncover aberrantly expressed genes caused by abnormalities in cis-regulatory elements. To this end, we generated whole-exome sequencing (WES) and RNA sequencing (RNA-seq) data in a large representative cohort of patients with AML and identified genes that recurrently exhibited ASE. Among those, GATA2 stood out prominently and exhibited a strong association with CEBPA double mutations (DMs). A multiomic analysis of the GATA2 regulatory region showed that ASE is a result of concomitant promoter methylation on 1 allele and compensatory enhancer activation on the other allele.
Methods
ASE
To discriminate expression from different alleles, WES and RNA-seq data were integrated using an in-house python script. First, single-nucleotide variants (SNVs) were detected on the WES data, and, second, allele-specific read counts at every SNV were computed in both WES and RNA-seq data. SNVs with <9 WES reads or <5 RNA-seq reads were excluded. Information was aggregated over all the SNVs in a gene, and ASE was determined with a false discovery rate <0.05 in a χ2 test and RNA variant allele frequency <0.35 (Figure 1). VAF <0.1 was defined as the threshold for monoallelic expression. After the initial exploratory screen, a targeted manually curated analysis was conducted on GATA2 to identify cases missed by the automated pipeline; ASE was defined only by RNA minor allele frequency <0.35 for SNVs with >20 reads.
![Schematic representation of the automated pipeline for ASE detection. Raw reads were aligned by STAR (RNA-seq) or bwa (exome sequencing [exome-seq]). SNVs were called with an ensemble of programs and annotated based on function, population frequency, and NGS statistics. This allowed the subsequent filtering of variants that were both real and informative. For every SNV, the variant allele frequency (VAF) at the DNA and RNA levels was computed, and SNV information was aggregated at the gene level. Finally, ASE was determined based on frequency of the minor allele (MAF) <0.35 and false discovery rate (FDR) <0.05 in a χ2 test.](https://ash.silverchair-cdn.com/ash/content_public/journal/blood/138/2/10.1182_blood.2020009244/7/m_bloodbld2020009244f1.png?Expires=1769144277&Signature=I8CAwPmWX6pMlVXUDhR-uY4ab8vHQKxg0DO3ny7wDvxVpf4Ze2VOTVRercTb76XCt7nsdGEaOEFh9vhj4w7mO7yQAo4w86VPyQ1sj-Brk77WO9ET9Hs4xqsrTG-B6DJc9XupF11QR1UknUcbEBlDg2a2Ki2UBVzqfbRT8iUALdmdeDeOHy7iTEA1dIbvlMGYDbR8~Bym-gT6Bg9LQayP06jxliIEFgAkxklZy2P33ZPLihrZAqp9n7otzu4Pi~b4P30DQVaAsXgWy56WRGyf4mjZtic3yIB-a-k-OJq9Egq-NBbMq7kwhxx2iG6wBLGu6IhIJO1aR5G7~PFohfm54A__&Key-Pair-Id=APKAIE5G5CRDK6RD3PGA)
Schematic representation of the automated pipeline for ASE detection. Raw reads were aligned by STAR (RNA-seq) or bwa (exome sequencing [exome-seq]). SNVs were called with an ensemble of programs and annotated based on function, population frequency, and NGS statistics. This allowed the subsequent filtering of variants that were both real and informative. For every SNV, the variant allele frequency (VAF) at the DNA and RNA levels was computed, and SNV information was aggregated at the gene level. Finally, ASE was determined based on frequency of the minor allele (MAF) <0.35 and false discovery rate (FDR) <0.05 in a χ2 test.
Schematic representation of the automated pipeline for ASE detection. Raw reads were aligned by STAR (RNA-seq) or bwa (exome sequencing [exome-seq]). SNVs were called with an ensemble of programs and annotated based on function, population frequency, and NGS statistics. This allowed the subsequent filtering of variants that were both real and informative. For every SNV, the variant allele frequency (VAF) at the DNA and RNA levels was computed, and SNV information was aggregated at the gene level. Finally, ASE was determined based on frequency of the minor allele (MAF) <0.35 and false discovery rate (FDR) <0.05 in a χ2 test.
Statistical association between mutations and genes with ASE
We calculated the statistical association between every possible pair of mutated genes and genes with ASE based on the cooccurrence of these 2 events in the patient cohort using Fisher’s exact test. For descriptive statistics and hypothesis tests involving clinical variables, the R package Atable17 was used with customized settings and functions.
Methylation analyses
Methylation analyses of the GATA2 locus were conducted using enhanced reduced representation bisulfite sequencing (ERRBS) data previously published by our group18 and bisulfite amplicon sequencing. Raw aligned reads and methylated base calls for CpGs were imported, filtered, and normalized with the package methylKit19 (version 1.13.1). Comparisons across groups of interest (CEBPA DMs and AML with and without GATA2 ASE) were performed with methylKit, and average methylation levels were plotted along the GATA2 gene with Gviz20 (version 1.28.3).
ChIP-seq and ATAC-seq analyses
Chromatin immunoprecipitation with sequencing (ChIP-seq) and assay for transposase-accessible chromatin with sequencing (ATAC-seq) data were generated for a number of selected patients to investigate changes in enhancer and promoter regions. ChIP-seq and ATAC-seq were performed as described previously with slight modifications.23,24 ChIP-seq reads were aligned to the human reference genome build hg19 with bowtie, and bigwig files were generated for visualization with bedtools genomecov25 (version 2.27.1) and bedGraphToBigWig.26 ATAC-seq reads were aligned to the human reference genome build hg19 with bowtie227 (version 2.3.4.1), which is recommended for longer reads, and mitochondrial and duplicate reads were excluded. Bigwig files were generated as described.
Enhancer regions were defined for quantification of enhancer RNA from RNA-seq, as well as H3K27ac, H3K27me3, and ATAC-seq reads. Read counts in enhancer regions were computed with featureCounts28 (version 1.5.0-p3), and differential analysis was conducted with DESEq229 (version 1.24.0). The results of this analysis were plotted in the GATA2 region with Gviz20 (version 1.28.3).
An extended description of the methods is provided in the data supplement. Quality metrics for the sequencing data generated in this study are available in supplemental Table 1.
Results
GATA2 is the most recurrent gene with ASE in AML
To identify instances of epigenetic dysregulation in AML, we performed WES and RNA-seq on leukemic blasts from 209 AML patients, representing all major subtypes of the disease. Combining both data sets, we assessed ASE in every gene with informative (nonhomozygous) SNVs (Figure 1). Patients had a median of 36 genes with ASE, several of which were recurrently detected across multiple patients (525 in ≥5 patients). The number of genes with ASE was quite stable across patients and was comparable to findings in healthy donors (data not shown), making it unlikely that global mechanisms dictate ASE in AML. No association between genes with ASE in neighboring loci was detected across patients, indicating that causes of ASE were specific to each gene. The degree of ASE, measured by VAF in the RNA, varied widely across genes and patients; 22% of the ASE events were classified as monoallelic (VAF <0.1).
To increase the likelihood of disease-relevant observations, we subsequently selected genes previously reported to be involved in either cancer (COSMIC database30 ) or myeloid development (Gene Ontology database: 0030099). Of the genes with ASE complying with these criteria, the 40 most recurrent across the patients of our cohort are listed in Table 1 (supplemental Table 2 provides the complete filtered list). The gene most commonly found to show ASE (37% of cases with informative SNVs) was GATA2, which encodes a transcription factor crucial for the proliferation and maintenance of hematopoietic stem cells.31
Top 40 genes with recurrent ASE in an AML cohort of 209 patients
| Gene | No. of patients* | Evaluated cases† | Samples, %‡ | COSMIC§ | Myeloid differentiation§ |
|---|---|---|---|---|---|
| GATA2 | 66 | 178 | 37 | Yes | Yes |
| THBS1 | 36 | 124 | 29 | No | Yes |
| MYH11 | 20 | 199 | 10 | Yes | No |
| CA2 | 13 | 126 | 10 | No | Yes |
| MECOM | 13 | 186 | 7 | Yes | No |
| SH3PXD2A | 13 | 195 | 7 | No | Yes |
| CDKN2A | 11 | 102 | 11 | Yes | No |
| JAG1 | 11 | 201 | 5 | No | Yes |
| L3MBTL3 | 11 | 156 | 7 | No | Yes |
| TRIM58 | 11 | 183 | 6 | No | Yes |
| CIB1 | 10 | 160 | 6 | No | Yes |
| FLT3 | 10 | 175 | 6 | Yes | No |
| HIP1 | 9 | 198 | 5 | Yes | No |
| PDE4DIP | 9 | 198 | 5 | Yes | No |
| HSP90AB1 | 8 | 147 | 5 | Yes | No |
| L3MBTL1 | 8 | 155 | 5 | No | Yes |
| MGMT | 8 | 150 | 5 | Yes | No |
| RUNX1 | 7 | 188 | 4 | Yes | Yes |
| USP6 | 7 | 149 | 5 | Yes | No |
| CD101 | 6 | 174 | 3 | No | Yes |
| FAT1 | 6 | 202 | 3 | Yes | No |
| IRF8 | 6 | 165 | 4 | No | Yes |
| MEIS1 | 6 | 156 | 4 | No | Yes |
| NPM1 | 6 | 134 | 4 | Yes | No |
| ABL1 | 5 | 153 | 3 | Yes | No |
| CIITA | 5 | 196 | 3 | Yes | No |
| DNMT3A | 5 | 188 | 3 | Yes | No |
| FAM20C | 5 | 184 | 3 | No | Yes |
| LTF | 5 | 188 | 3 | No | Yes |
| MYB | 5 | 161 | 3 | Yes | No |
| PML | 5 | 181 | 3 | Yes | Yes |
| PRDM2 | 5 | 151 | 3 | Yes | No |
| RMI2 | 5 | 148 | 3 | Yes | No |
| RPN1 | 5 | 159 | 3 | Yes | No |
| ZFHX3 | 5 | 201 | 2 | Yes | No |
| AKT1 | 4 | 178 | 2 | Yes | No |
| BAX | 4 | 110 | 4 | Yes | No |
| BRCA1 | 4 | 170 | 2 | Yes | No |
| KMT2C | 4 | 162 | 2 | Yes | Yes |
| KNSTRN | 4 | 158 | 3 | Yes | No |
No. of patients presenting with ASE for that gene.
No. of patients with SNVs that could be evaluated in that gene.
Determined by dividing no. of patients by no. of evaluated cases.
Indicates whether the gene is found in COSMIC database or is involved in myeloid differentiation (Gene Ontology database: 0030099). Note that reportedly imprinted genes (according to GeneImprint) were filtered out.
Molecular lesions in AML exhibit preferential association with gene-specific ASE
Our next question was whether there are preferential associations between genes with ASE and AML-specific mutations. To this end, we selected mutations likely to be somatic (based on their known involvement in AML, presence in COSMIC, and pathogenicity predictions) from the variants identified in the WES data (supplemental Table 3) and calculated the statistical association between every possible pair of mutated genes and genes with ASE (Figure 2).
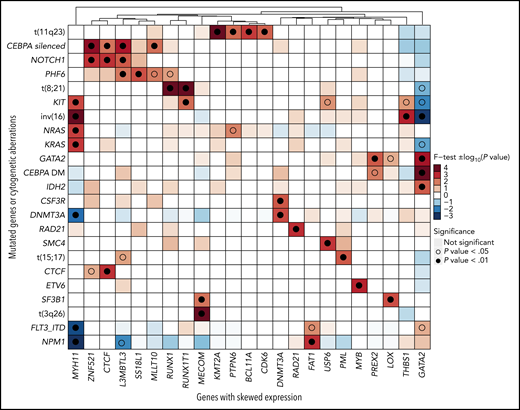
Association between genes with ASE and gene mutations or cytogenetic aberrations. Statistical association was computed with a 2-sided Fisher’s exact test and represented as −log10 (P value) for odds ratios >1 or log10 (P value) for odds ratios <1. Positive values, indicating positive association, are depicted in red, and negative values are depicted in blue. For clearer visualization, the limits of the scale were set at −4 and +4. Associations that achieved significance are highlighted with an empty (P < .05) or full (P < .01) circle.
Association between genes with ASE and gene mutations or cytogenetic aberrations. Statistical association was computed with a 2-sided Fisher’s exact test and represented as −log10 (P value) for odds ratios >1 or log10 (P value) for odds ratios <1. Positive values, indicating positive association, are depicted in red, and negative values are depicted in blue. For clearer visualization, the limits of the scale were set at −4 and +4. Associations that achieved significance are highlighted with an empty (P < .05) or full (P < .01) circle.
Unsurprisingly, we found strong associations between driver chromosomal translocations and ASE of their constituent genes: t(11q23) and KMT2A, t(8;21) and RUNX1/RUNX1T1, t(15;17) and PML, t(3;3) and MECOM, and inv(16) and MYH11. Upon translocation to a different genomic region, genes previously under the control of another promoter (gene fusions) or enhancer (MECOM) acquired monoallelic expression. In addition, the analysis uncovered novel associations between ASE events and mutations, such as THBS1 with inv(16) (P = .0008), MYB with ETV6 (P = .0008), or LOX with SF3B1 (P = .0028). Among those, the association of GATA2 ASE with CEBPA DMs (P = 2.18 × 10⁻⁵) and with GATA2 mutations (P = .0004) was the strongest.
GATA2 ASE is strongly associated with CEBPA DM AML
Given the recurrence of GATA2 ASE and the prominent role of this gene in leukemogenesis, we further focused on GATA2. Therefore, using RNA-seq data, we manually inspected the GATA2 locus on the Integrative Genomics Viewer for all cases to ensure that no case had been excluded by the stringent filtering of our automated pipeline. This second analysis detected GATA2 ASE in 60% of patients with informative SNVs, a substantial increase that was due to the inclusion of untranslated regions (absent in the exome sequencing data) and the absence of P-value filtering (supplemental Figure 2). All subsequent calculations were based on this second analysis of the data.
Notably, GATA2 ASE was detected in all evaluable patients with CEBPA DMs (n = 21; Fisher’s exact test P = 1.57 × 10⁻⁵). A statistical analysis of clinically relevant variables revealed other positive associations, although weaker, of GATA2 ASE with normal karyotype, NPM1 mutations, and FLT3 internal tandem duplication mutations. There was no association with white blood cell count, age, sex, or ELN 2017 classification (Table 2). Although GATA2 ASE is widespread in AML, the t(8;21) and t(11q23) subgroups, both involving fusion proteins, were negatively associated with GATA2 ASE.
Clinical characteristics of GATA2 ASE and GATA2 non-ASE groups
| Group | % (n) | P* | Effect size (CI)*† | |
|---|---|---|---|---|
| GATA2 ASE (n = 103) | GATA2 non-ASE (n = 67) | |||
| Sex | .34 | 0.72 (0.36-1.4) | ||
| Female | 48 (49) | 39 (26) | ||
| Male | 49 (50) | 55 (37) | ||
| Missing | 3.9 (4) | 6 (4) | ||
| Age, y | .79 | −0.19 (−0.51 to 0.13) | ||
| Median | 48.00 | 47.00 | ||
| MAD | 17.79 | 19.27 | ||
| Mean, % | 48.70 | 45.57 | ||
| SD, % | 16.82 | 16.30 | ||
| Range | 15-86 | 17-77 | ||
| Missing | 3.9 (4) | 6.0 (4) | ||
| ELN classification | .22 | 0.14 (0-0.28) | ||
| Adverse | 20 (21) | 30 (20) | ||
| Favorable | 50 (52) | 37 (25) | ||
| Intermediate | 28 (29) | 27 (18) | ||
| Missing | 0.97 (1) | 6 (4) | ||
| WBC count | .28 | 0.29 (−0.065 to 0.64) | ||
| Median | 43.00 | 62.00 | ||
| MAD | 35.88 | 52.19 | ||
| Mean, % | 60.14 | 78.29 | ||
| SD, % | 50.10 | 80.29 | ||
| Range | 1-215 | 0-510 | ||
| Missing | 15.5 (16) | 26.9 (18) | ||
| NPM1 | .005 | 2.7 (1.3-6) | ||
| Negative | 58 (60) | 79 (53) | ||
| Positive | 42 (43) | 21 (14) | ||
| FLT3-ITD | .0068 | 2.7 (1.3-6.2) | ||
| Negative | 60 (62) | 81 (54) | ||
| Positive | 40 (41) | 19 (13) | ||
| CEBPA DMs | <.001 | NA (4 to NA) | ||
| Negative | 80 (82) | 100 (67) | ||
| Positive | 20 (21) | |||
| CEBPA SMs | 1 | 0.86 (0.14-6.1) | ||
| Negative | 96 (99) | 96 (64) | ||
| Positive | 3.9 (4) | 4.5 (3) | ||
| CEBPA silenced | .75 | 0.77 (0.19-3.3) | ||
| Negative | 94 (97) | 93 (62) | ||
| Positive | 5.8 (6) | 7.5 (5) | ||
| t(15;17) | .079 | 0.16 (0.0031-1.6) | ||
| Negative | 99 (102) | 94 (63) | ||
| Positive | 0.97 (1) | 6 (4) | ||
| t(8;21) | .036 | 0.12 (0.0026-1.1) | ||
| Negative | 99 (102) | 93 (62) | ||
| Positive | 0.97 (1) | 7.5 (5) | ||
| inv(16) | .1 | 0.4 (0.11-1.3) | ||
| Negative | 94 (97) | 87 (58) | ||
| Positive | 5.8 (6) | 13 (9) | ||
| Normal karyotype | <.001 | 4.4 (2.1-9.7) | ||
| Negative | 36 (37) | 67 (45) | ||
| Positive | 57 (59) | 24 (16) | ||
| Missing | 6.8 (7) | 9 (6) | ||
| Complex karyotype | .73 | 0.75 (0.15-4) | ||
| Negative | 70 (72) | 64 (43) | ||
| Positive | 4.9 (5) | 6 (4) | ||
| Missing | 25 (26) | 30 (20) | ||
Descriptive statistics and hypotheses tests were computed for patients with AML with or without GATA2 ASE using Atable.
CI, confidence interval; ELN, European LeukemiaNet; ITD, internal tandem duplication; MAD, median absolute deviation; NA, not available; SD, standard deviation; SM, single mutation; WBC, white blood cell.
Reflects evaluation of the association between groups with or without GATA ASE and clinical variables.
Effect size measured as odds ratio for categorical variables and Cohen’s D for numerical variables.
GATA2 ASE was not significantly present in other AML subtypes known to be associated with CEBPA abnormalities, such as t(8;21)32 and CEBPA-silenced leukemias, both characterized by reduced CEBPA expression33,34 (Figure 3A). Moreover, single CEBPA mutations were not associated with GATA2 ASE (P = .708). Therefore, GATA2 ASE in CEBPA DMs does not seem to be a general result of abnormalities in CEBPA function or expression.

Occurrence of GATA2 ASE in AML subgroups. (A) Bar plot indicating the percentage of cases with GATA2 ASE in each mutational subgroup. The color of the bars indicates the strength of the association as log10 (P value), with a sign determined by the nature of the association. The scale ranges from blue for negative associations to red for positive associations. The dotted horizontal line indicates the percentage of cases with GATA2 ASE in the whole AML cohort. (B) Circos plot indicating the cooccurrence of mutations in AML and GATA2 ASE. (C) Bar plots for each patient with CEBPA DM showing GATA2 ASE, observed by the discrepancy between VAF at the DNA level and VAF at the RNA level. *Indicates significance at a false discovery rate <0.05 in a χ2 test.
Occurrence of GATA2 ASE in AML subgroups. (A) Bar plot indicating the percentage of cases with GATA2 ASE in each mutational subgroup. The color of the bars indicates the strength of the association as log10 (P value), with a sign determined by the nature of the association. The scale ranges from blue for negative associations to red for positive associations. The dotted horizontal line indicates the percentage of cases with GATA2 ASE in the whole AML cohort. (B) Circos plot indicating the cooccurrence of mutations in AML and GATA2 ASE. (C) Bar plots for each patient with CEBPA DM showing GATA2 ASE, observed by the discrepancy between VAF at the DNA level and VAF at the RNA level. *Indicates significance at a false discovery rate <0.05 in a χ2 test.
The expressed GATA2 allele is frequently mutated in AML with CEBPA DMs
The second mutated gene with the largest cooccurrence of GATA2 ASE was GATA2 itself (P = .0165). Interestingly, GATA2 was also mutated in 48% of the CEBPA DM cases in our cohort, and 19% carried a second subclonal GATA2 mutation (Table 3). This is in line with previous findings reporting that 40% of CEBPA DM cases cooccur with GATA2 mutations.35 In cases with a GATA2 mutation, the mutant allele was always preferentially expressed. This suggests a functional connection between GATA2 and CEBPA DMs, where ASE may play a cooperative role with GATA2 mutations.
GATA2 and CEBPA alterations in patients with CEBPA DM
| Patient ID | RNA frequency* | GATA2 ASE† | GATA2 expression, TPM | GATA2 mutations‡ | GATA2 allele expressed§ | CEBPA mutations|| | CEBPA expression, TPM | CEBPA mutation VAF | ||
|---|---|---|---|---|---|---|---|---|---|---|
| n | Type (VAF) | Mut1 | Mut2 | |||||||
| 1316 | 0.233 | Skewed | 106.2 | 0 | — | — | N/C | 483.9 | 0.462 | 0.448 |
| 2192 | 0.023 | Monoallelic | 456.2 | 2 | ZF1 (0.39), ZF2 (0.59) | Mut (indel), mut (0.97) | N/C | 390.3 | 0.526 | 0.486 |
| 2218 | 0.263 | Skewed | 67.8 | 0 | — | — | C/C | 308.9 | 0.923 | HMZ |
| 2234 | 0.144 | Skewed | 28.5 | 2 | ZF1 (0.03) | Mut (0.07) | N/C | 380.5 | 0.498 | 0.475 |
| 2240 | 0.223 | Skewed | 41.0 | 1 | ZF1 (0.02) | Mut (0.03) | N/C | 328.0 | 0.486 | 0.461 |
| 2242 | Unknown | 55.5 | 0 | — | — | N/C | 162.0 | 0.472 | 0.447 | |
| 2253 | 0.269 | Skewed | 106.2 | 1 | ZF1 (0.47), ZF2 (0.07) | Mut (0.71), mut (0.49) | N/C | 168.1 | 0.490 | 0.418 |
| 2273 | 0.0993 | Monoallelic | 61.0 | 1 | ZF1 (0.47) | Mut (0.92) | N/C | 161.4 | 0.488 | 0.423 |
| 2545 | 0.037 | Monoallelic | 106.5 | 1 | ZF2 (0.39) | Mut (0.96) | N/C | 274.7 | 0.497 | 0.484 |
| 2753 | 0.106 | Skewed | 40.9 | 1 | ZF1 (0.45) | Mut (0.93) | N/C | 233.7 | 0.448 | 0.441 |
| 3101¶ | 0.126 | Skewed | 50.9 | 0 | — | — | N/N | 194.4 | NA | NA |
| 3327 | 0.071 | Monoallelic | 94.1 | 0 | — | — | C/C | 86.2 | 0.918 | HMZ |
| 4336 | 0.285 | Skewed | 36.7 | 0 | — | — | N/C | 143.7 | 0.442 | 0.470 |
| 5352 | 0.174 | Skewed | 24.3 | 0 | — | — | N/C | 417.6 | 0.472 | 0.412 |
| 5362 | 0.064 | Monoallelic | 60.2 | 2 | ZF1 (0.03), ZF2 (0.49) | Mut (0.12), mut (0.93) | N/C | 238.8 | 0.497 | 0.464 |
| 5364 | 0.097 | Monoallelic | 113.9 | 0 | — | — | N/N | 427.4 | 0.283 | 0.277 |
| 6376 | 0.024 | Monoallelic | 43.4 | 0 | — | — | C/C | 258.7 | 0.899 | HMZ |
| 7142 | 0.208 | Skewed | 29.7 | 0 | — | — | N/C | 141.2 | 0.482 | 0.473 |
| AML0104 | 0.107 | Monoallelic | 66.6 | 0 | — | — | C/C | 264.1 | 0.422 | HMZ |
| AML0129# | 0.018 | Monoallelic | 10.1 | 0 | — | — | N/N | 169.5 | 0.035 | 0.334 |
| AML0135 | 0.097 | Monoallelic | 60.3 | 2 | ZF1 (0.19), ZF2 (0.37) | Mut (0.46), mut (0.87) | N/C | 125.0 | 0.399 | 0.173 |
| UKR169 | 0.051 | Monoallelic | 13.9 | 1 | ZF1 (0.45) | Mut (0.96) | N/C | 318.8 | 0.847 | HMZ |
HMZ, homozygous; mut, mutated allele; NA, not available; TPM, transcripts per million; ZF, zinc finger.
Indicates the proportion of reads that come from the minor allele for all the single-nucleotide polymorphisms considered in the gene.
Categorized as monoallelic for RNA frequency ≤0.10 or skewed for RNA frequency ≤0.35. The expression of GATA2 and CEBPA is presented in TPM as reported by Salmon.
Contains the no., type (ZF1/2), and VAF of the mutations identified in GATA2.
Includes the VAF of these GATA2 mutations measured in the RNA.
VAF of the 2 CEBPA mutations, based on deep amplicon sequencing, is indicated in N- to C-terminal order.
Amplicon sequencing was not conducted for 3101, and CEBPA VAF was unavailable.
AML0129 had a CEBPA mutation in only 1 allele, but the other allele was not expressed; therefore, it acted like a CEBPA HMZ mutation at the transcriptional level.
We did not observe a difference in magnitude of GATA2 ASE (measured as VAF at RNA level) between patients with CEBPA DM with or without GATA2 mutations (supplemental Figure 3C). Therefore, GATA2 ASE in CEBPA DMs occurs independently of the number of GATA2 mutations.
Our findings were further validated in the TCGA-LAML36 and Beat AML37 data sets, where all 10 patients with CEBPA DMs and informative SNVs presented GATA2 ASE (supplemental Tables 4 and 5). Of these, 3 patients carried GATA2 mutations with preferential expression of the mutated allele (supplemental Figure 4A-B).
GATA2 ASE is a somatic event in CEBPA DM AML
Our observations suggest a role of GATA2 ASE in the pathogenesis of CEBPA DM AML, which would imply that GATA2 ASE should be leukemia specific and not present in healthy controls. An analysis of bone marrow– (n = 8) or cord blood–derived (n = 3) hematopoietic stem cells from healthy individuals did not show any GATA2 ASE, indicating that GATA2 ASE is not commonly found in the general population (Figure 4A).
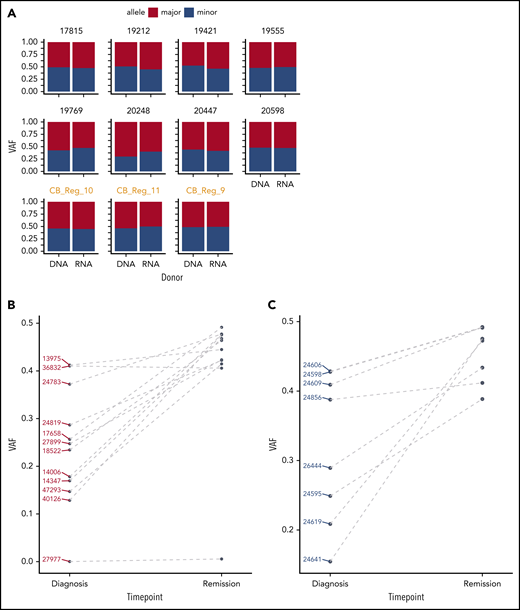
GATA2 ASE is only present in leukemia cells. (A) Bar plot showing the absence of GATA2 ASE in CD34+ cells, of which 8 were derived from bone marrow and 3 from cord blood (in orange). The average VAF along the GATA2 gene at the DNA and RNA levels was identical in all samples. (B) Comparison of VAF measured in RNA at diagnosis or remission in CEBPA DM samples. (C) Comparison of VAF measured in RNA at diagnosis or remission in NPM1-mutated samples.
GATA2 ASE is only present in leukemia cells. (A) Bar plot showing the absence of GATA2 ASE in CD34+ cells, of which 8 were derived from bone marrow and 3 from cord blood (in orange). The average VAF along the GATA2 gene at the DNA and RNA levels was identical in all samples. (B) Comparison of VAF measured in RNA at diagnosis or remission in CEBPA DM samples. (C) Comparison of VAF measured in RNA at diagnosis or remission in NPM1-mutated samples.
To examine whether GATA2 ASE is indeed present at the time of leukemia development and lost upon achieving remission after treatment, we sequenced a second series of CEBPA DM cases (n = 12) for which both diagnostic and complete remission material was available (Table 4). In these cases, targeted GATA2 DNA and complementary DNA amplicon sequencing was applied, having previously confirmed that this technique recapitulates the RNA-seq results (supplemental Figure 5). In the diagnostic samples, we again observed frequent GATA2 ASE, although slightly less frequent than in the previous series (10 [83%] of 12 cases).
Characteristics of patients withCEBPA DM that have remission material available
| Patient ID | RNA frequency at diagnosis, %* | Skewing† | RNA frequency at remission, %* | GATA2 mutations‡ | GATA2 allele expressed§ | CEBPA mutations|| | CEBPA mutation VAF | ||||
|---|---|---|---|---|---|---|---|---|---|---|---|
| n | Type (VAF) | Diagnosis | Remission | ||||||||
| Mut1 | Mut2 | Mut1 | Mut2 | ||||||||
| 13975 | 41.21 | Not skewed | 44.48 | 0 | — | — | N/C | 0.396 | 0.459 | 0.000 | 0.000 |
| 14006 | 17.81 | Skewed | 47.66 | 0 | — | — | N/N | 0.882 | HMZ | 0.000 | HMZ |
| 14347 | 16.96 | Skewed | 46.79 | 1 | ZF1 (0.49) | Mut (0.82) | N/C | 0.457 | 0.420 | 0.000 | 0.183 |
| 17658 | 25.65 | Skewed | 49.15 | 0 | — | — | N/N | 0.457 | 0.460 | 0.001 | 0.000 |
| 18522 | 23.43 | Skewed | 46.39 | 0 | — | — | C/C | 0.781 | HMZ | 0.001 | HMZ |
| 24783 | 37.22 | Skewed | 47.73 | 0 | — | — | N/C | 0.446 | 0.436 | 0.000 | 0.000 |
| 24819 | 28.66 | Skewed | 42.23 | 1 | ZF1 (0.06) | Mut (0.10) | N/C | 0.401 | 0.316 | 0.000 | 0.000 |
| 27899 | 24.73 | Skewed | 42.33 | 0 | — | — | N/C | 0.470 | 0.460 | 0.000 | 0.000 |
| 27977 | 0.01 | Monoallelic | 0.56 | 0 | — | — | N/C | 0.503 | 0.434 | 0.000 | 0.501 |
| 36832 | 41.03 | Not skewed | 40.58 | 0 | — | — | N/C | 0.438 | 0.389 | 0.000 | 0.000 |
| 40126 | 12.85 | Skewed | 47.57 | 2 | ZF1 (0.12), ZF1 (0.07) | Mut (0.16), mut (0.11) | N/C | 0.469 | 0.469 | 0.000 | 0.000 |
| 47293 | 14.71 | Skewed | 41.46 | 0 | — | — | N/C | 0.435 | 0.459 | 0.000 | 0.001 |
HMZ, homozygous; mut, mutated allele.
Indicates the proportion of reads from the minor allele for each single-nucleotide polymorphism considered, determined at diagnosis or remission.
Categorized as monoallelic for RNA frequency ≤0.10 or skewed for RNA frequency ≤0.35.
Reports the VAF of the mutation at the DNA level.
Includes the VAF measured in the RNA.
VAF of the 2 CEBPA mutations is indicated in N- to C-terminal order, at diagnosis and remission.
At remission, biallelic expression of GATA2 was restored in 9 of 10 CEBPA DM samples that showed GATA2 ASE at diagnosis (Figure 4B; supplemental Figure 6A). The exception, case 27977, displayed completely monoallelic expression of GATA2 at both time points, potentially indicating that GATA2 ASE preceded leukemia development in that particular patient. Interestingly, that same patient exhibited 1 N-terminal CEBPA mutation in 50% of the cells in remission, suggesting that it carried a germ line CEBPA mutation accompanied by germ line GATA2 ASE. In a control group of AML cases with NPM1 mutations with GATA2 ASE at diagnosis, we similarly observed GATA2 biallelic expression at remission (Figure 4C; supplemental Figure 6B).
Overall, these data indicate that GATA2 ASE is a leukemia-specific event, because it is absent in healthy cells and is lost in complete remission.
GATA2 promoters are differentially methylated in CEBPA DM AML
Methylation of CpG islands proximal to a transcriptional start site (TSS) may block transcription initiation and is correlated with loss of gene expression.38 To explore this in the context of GATA2 ASE, we analyzed ERRBS data generated in a subset (n = 35) of our AML cohort.18
The GATA2 gene encodes multiple isoforms with different TSSs, all of which overlap with a long CpG island. We defined promoters as the 1000-bp regions upstream of the TSS of isoforms expressed in AML: a short (Prom-S) and a long (Prom-L) isoform (supplemental Figure 7A). We compared methylation levels in these promoters for the following 3 groups: (1) CEBPA DM AML with GATA2 ASE (CEBPA_DM; n = 10), (2) AML without CEBPA DMs but with GATA2 ASE (Control_ASE; n = 20), and (3) AML without CEBPA DMs and without GATA2 ASE (Control_BE; n = 5; Figure 5A; supplemental Figure 7B). We identified significant hypermethylation in CEBPA DMs in the promoter of the long GATA2 form with respect to Control_ASE (P < .0001) but not Control_BE (P = .0016). No significant differences were observed in the promoter of Prom-S.
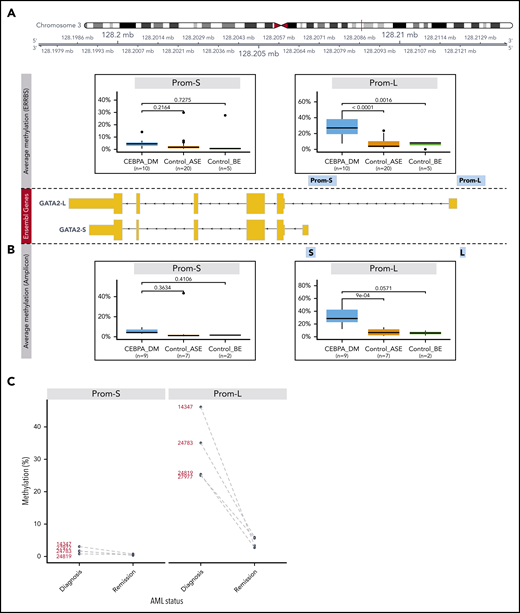
Methylation analysis of GATA2 promoters. (A) Differential methylation analysis of putative promoters of the 2 expressed GATA2 isoforms using ERRBS (Prom-S and Prom-L). The following groups were compared: CEBPA_DM (n = 10), Control_ASE (n = 20), and Control_BE (n = 5). The y-axis indicates the percentage of methylation, averaged for all the CpG positions in each promoter region. (B) Differential methylation analysis of the promoters of the 2 expressed GATA2 isoforms using bisulfite treatment followed by amplicon sequencing. Note that the amplified regions (denoted as S and L) are selections of the sequences examined in the ERRBS data. Groups were defined as described: CEBPA_DM (n = 9), Control_ASE (n = 7), and Control_BE (n = 2). (C) Methylation changes in GATA2 promoters of paired diagnosis-remission samples from patients with CEBPA DM AML.
Methylation analysis of GATA2 promoters. (A) Differential methylation analysis of putative promoters of the 2 expressed GATA2 isoforms using ERRBS (Prom-S and Prom-L). The following groups were compared: CEBPA_DM (n = 10), Control_ASE (n = 20), and Control_BE (n = 5). The y-axis indicates the percentage of methylation, averaged for all the CpG positions in each promoter region. (B) Differential methylation analysis of the promoters of the 2 expressed GATA2 isoforms using bisulfite treatment followed by amplicon sequencing. Note that the amplified regions (denoted as S and L) are selections of the sequences examined in the ERRBS data. Groups were defined as described: CEBPA_DM (n = 9), Control_ASE (n = 7), and Control_BE (n = 2). (C) Methylation changes in GATA2 promoters of paired diagnosis-remission samples from patients with CEBPA DM AML.
For further validation, we conducted bisulfite treatment followed by amplicon sequencing of GATA2 promoters in additional samples from the original cohort: CEBPA_DM (n = 9), Control_ASE (n = 7), and Control_BE (n = 2). Here, the regions were more narrowly defined but were sequenced with a higher resolution than that achieved by ERRBS. The results confirmed the previous observations (Figure 5B; supplemental Figure 8A); the CEBPA_DM group exhibited hypermethylation in the promoter of the long GATA2 form when compared with Control_ASE (P < .0001) and Control_BE (P = .0571). Moreover, we conducted bisulfite sequencing on 4 paired diagnosis-remission samples of CEBPA DMs in which we had previously detected GATA2 ASE (Figure 4). In all cases, we observed a strong decline of methylation levels in Prom-L at remission, consistent with the notion that hypermethylation associated with GATA2 ASE is a leukemia-specific event (Figure 5C; supplemental Figure 8B).
Methylation of GATA2 promoters is allele specific and correlates with expression
To confirm that the less transcriptionally active GATA2 allele is repressed via methylation, we carried out CRISPR/Cas9-targeted enrichment of the GATA2 locus followed by amplification-free long-read sequencing in 4 CEBPA DM patients by Oxford Nanopore, which allows direct detection of methylation.39 We estimated CpG methylation likelihood in each allele separately, based on a heterozygous single-nucleotide polymorphism that also enabled ASE detection.
In general, the individual methylation patterns recapitulated the ERRBS data (supplemental Figure 9A). The results were also consistent across different methylation callers (supplemental Figure 9B). Interestingly, there were no differences in Prom-L between the 2 alleles, both of which were strongly methylated (Figure 6; supplemental Figure 9C). Although ERRBS data revealed that patients with CEBPA DM are uniquely methylated in this region, certain positions exhibited 100% methylation in the selected patients (supplemental Figure 8A). This is incompatible with allele-specific methylation and thus in line with the Nanopore results. In contrast, three-fourths of patients presented allelic-specific methylation of the less abundant allele in Prom-S. This further supports the notion that the less transcriptionally active GATA2 allele is repressed via methylation in CEBPA DMs.
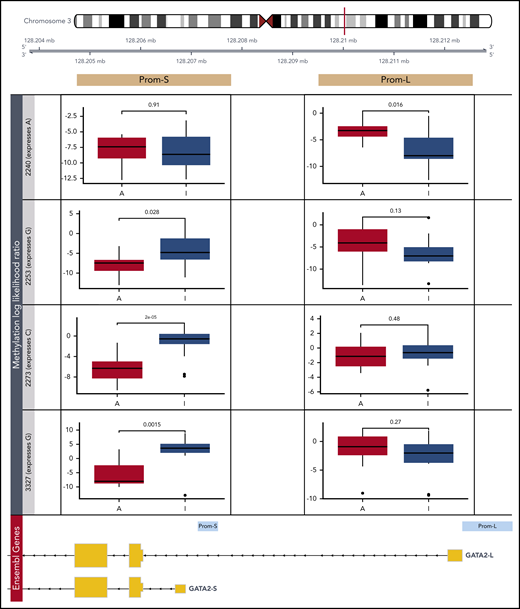
Detection of allele-specific methylation in GATA2 promoters. Differential methylation analysis of putative promoters of the 2 expressed GATA2 isoforms by Nanopore sequencing (Prom-S and Prom-L). In 4 patients with CEBPA DM, the more abundant allele (A) was compared with the less transcriptionally active allele (I) based on a heterozygous single-nucleotide polymorphism: rs72983369 for 2240 and rs1573858 for 2253, 2273, and 3327. Methylation likelihood ratios computed by Nanopolish were averaged across all reads mapping to each allele.
Detection of allele-specific methylation in GATA2 promoters. Differential methylation analysis of putative promoters of the 2 expressed GATA2 isoforms by Nanopore sequencing (Prom-S and Prom-L). In 4 patients with CEBPA DM, the more abundant allele (A) was compared with the less transcriptionally active allele (I) based on a heterozygous single-nucleotide polymorphism: rs72983369 for 2240 and rs1573858 for 2253, 2273, and 3327. Methylation likelihood ratios computed by Nanopolish were averaged across all reads mapping to each allele.
GATA2 levels seem to be preserved by a compensatory mechanism involving its −110-kb enhancer
Comparing expression levels across the abovementioned groups, there was no loss of GATA2 transcript levels in AML patients with CEBPA DMs (Figure 7A). We hypothesized that changes in the activity of a GATA2 enhancer in cis may compensate for the absence of transcription from the other allele. The promoters of GATA2 interact with a variety of cis-regulatory elements that dictate tissue-specific expression, including the 9.5-kb intronic enhancer and the −110-kb distant superenhancer.40 The −110-kb enhancer (−77 kb in mice) is essential for embryogenesis and controls differentiation of common myeloid progenitors and granulocyte-macrophage progenitors,41 and its loss is involved in the development of AML with inv(3)/t(3;3).4 Therefore, we examined changes in the activity of this enhancer.
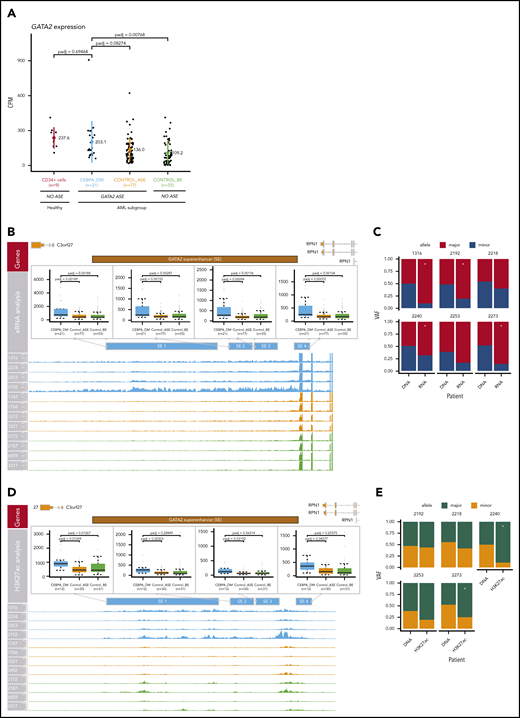
Compensation of GATA2 levels by superenhancer activation. (A) Comparison of GATA2 expression levels in AML groups and CD34+ normal control cells (n = 9). The following AML groups were compared: CEBPA_DM (n = 21), Control_ASE (n = 77), and Control_BE (n = 55). No loss of GATA2 expression was observed in CEBPA DMs. (B) Analysis of enhancer RNA (eRNA) expression in the GATA2 −110-kb superenhancer. (C) ASE of eRNA in the GATA2 superenhancer, comparing CEBPA_DM (n = 21), Control_ASE (n = 77), and Control_BE (n = 55). The VAF of the DNA and the eRNA are shown. (D) Analysis of H3K27ac binding levels in the GATA2 −110-kb superenhancer, comparing CEBPA_DM (n = 12), Control_ASE (n = 30), and Control_BE (n = 31). (E) Allele specific binding of H3K27ac in the GATA2 super-enhancer. The VAF of the DNA and the H3K27ac reads are shown. *Indicates significance at a false discovery rate <0.05 in a χ2 test.
Compensation of GATA2 levels by superenhancer activation. (A) Comparison of GATA2 expression levels in AML groups and CD34+ normal control cells (n = 9). The following AML groups were compared: CEBPA_DM (n = 21), Control_ASE (n = 77), and Control_BE (n = 55). No loss of GATA2 expression was observed in CEBPA DMs. (B) Analysis of enhancer RNA (eRNA) expression in the GATA2 −110-kb superenhancer. (C) ASE of eRNA in the GATA2 superenhancer, comparing CEBPA_DM (n = 21), Control_ASE (n = 77), and Control_BE (n = 55). The VAF of the DNA and the eRNA are shown. (D) Analysis of H3K27ac binding levels in the GATA2 −110-kb superenhancer, comparing CEBPA_DM (n = 12), Control_ASE (n = 30), and Control_BE (n = 31). (E) Allele specific binding of H3K27ac in the GATA2 super-enhancer. The VAF of the DNA and the H3K27ac reads are shown. *Indicates significance at a false discovery rate <0.05 in a χ2 test.
Differential expression analysis revealed that CEBPA DM cases exhibited increased transcription in all the elements contained within the GATA2 superenhancer (P < .05; DESeq2) when compared with other AML cases, regardless of whether they exhibited GATA2 ASE (Figure 7B). Increased transcription in enhancer regions was shown to be allele specific for 4 of 6 CEBPA DM samples for which DNA sequencing information was available in that region (Figure 7C). Likewise, levels of both H3K27ac (Figure 7D) and ATAC-seq (supplemental Figure 10A) were higher for CEBPA DM cases than any other group in the GATA2 superenhancer region. Interestingly, the patterns of allele specificity sometimes differed between enhancer RNA and H3K27ac data (Figure 7C,E).
There were no significant differences in superenhancer methylation, although it should be noted that the resolution of ERRBS in this area was low (supplemental Figure 10B). There were no differences in H3K27me3 (supplemental Figure 10C), a mark for poised enhancers.42 H3K27me3, which is mediated by the polycomb complex PRC2, is also present in the promoters of silenced genes and might prevent transcription.43 However, we did not observe significant differences in any of the GATA2 locus regions examined, ruling out PRC2-mediated repression (supplemental Figure 10D).
Altogether, these results support the notion that inactivation of 1 GATA2 allele by methylation is compensated for by increased enhancer activity in the other allele, leading to maintenance of GATA2 levels.
Discussion
We detected GATA2 ASE in 60% of the AML cases, with a very strong association with CEBPA DMs. Analysis of additional cohorts revealed that GATA2 ASE was found in 41 (95%) of 43 CEBPA DM AML cases and was a somatic, leukemia-specific event that was lost upon remission. In cases with GATA2 mutations, the mutated allele was preferentially expressed, but ASE was also present in the absence of GATA2 mutations. We show that our findings can be explained by simultaneous silencing of 1 allele by methylation and overactivation of the other allele via the −110-kb superenhancer, resulting in unchanged, or even slightly increased, GATA2 levels. Collectively, these data suggest that GATA2 ASE is an important event in the development of AML with CEBPA DMs.
GATA2 encodes a transcription factor crucial for proliferation and maintenance of hematopoietic stem cells.31 Balanced expression of functional GATA2 is critical for normal hematopoiesis, with alterations in either its expression or activity having been linked to leukemogenesis.44 For instance, gain-of-function GATA2 mutations mediate acute myeloid transformation of chronic myeloid leukemia,45 whereas loss-of-function germ line mutations leading to GATA2 deficiency predispose carriers to familial myelodysplastic syndrome (MDS)/AML.46 These patients present a wide range of other phenotypic manifestations, including immunodeficiency, pulmonary disease, and lymphatic dysfunction.47 In addition to resulting from mutations in coding regions of the gene, these symptoms can be caused by mutations in an internal enhancer of GATA2, leading to reduced expression of the gene product.48 On the other hand, GATA2 overexpression has been suggested to be a poor prognostic marker in both pediatric49 and adult50 AML. Not only do our findings demonstrate that GATA2 defects may be caused by mutations in the gene or its regulatory elements, but they also underscore the importance of epigenetic changes or epimutations in this gene in a subset of leukemias.
These observations highlight the importance of fine-tuned regulation of GATA2 expression and point to a role of GATA2 ASE in the pathogenesis of AML. Accordingly, Celton et al51 also reported frequent GATA2 ASE in a smaller cohort of 49 normal karyotype patients with AML, although it should be noted that other genes were not considered in that study. In a much larger group of patients, we conclusively demonstrate that GATA2 displays ASE more often than any other known myeloid- or cancer-related gene. Moreover, although GATA2 ASE is widespread in AML, we show it is distinctly associated with CEBPA DMs; both events cooccured in 95% of the 43 cases analyzed.
CEBPA DMs define an AML subtype with a distinct gene expression profile and favorable clinical outcome.52,53 These patients typically exhibit a combination of N- and C-terminal mutations in the CEBPA protein, disrupting its dimerization and DNA-binding activities.54 We did not find an association between GATA2 ASE and the type of CEBPA mutations present in each patient (supplemental Figure 3D).
The specific association between GATA2 ASE and CEBPA DMs suggests cooperativity between these 2 genes in the context of leukemogenesis. This is in keeping with the previously reported observation that GATA2 mutations are present in ∼40% of CEBPA DM cases. Somatic GATA2 mutations mainly cluster in the 2 ZF domains of the protein, each with different functional implications.55 The ZF1 domain (N-terminal) of GATA2 contributes to the stabilization and specificity of DNA binding and mediates the interaction with FOG1, whereas ZF2 interacts with CEBPA.35 The role of these mutations in AML is a subject of ongoing research, with effects described on proliferation and differentiation (Leubolt et al55 provide a recent review). ZF1 mutations are strongly associated with CEBPA DMs, where they may play a cooperative role; the mutations lead to reduced transcription of CEBPA targets.35 All the cases of our cohort with GATA2 mutations exhibited at least an amino acid change in ZF1, but those with 2 mutations had a second hit in ZF2. Strikingly, both GATA2 mutations were always in the same allele, which was preferentially expressed. In a recent study of recurrently mutated genes in AML, Batcha et al56 also identified an allelic imbalance toward mutant GATA2, although their effort was limited to 11 genes harboring recurring mutations. Similarly, Al Seraihi et al57 reported GATA2 ASE favoring the mutated allele in a family with inherited GATA2-mutated MDS/AML. In contrast, Kozyra et al58 recently described synonymous GATA2 mutations in patients with MDS that lead to decreased transcript stability, leading to ASE favoring the wild-type allele. In patients with CEBPA DM AML that have GATA2 mutations, the presence of GATA2 ASE can be explained because it leads to dominance of the mutated allele. However, because GATA2 ASE was also observed in a vast majority of CEBPA DM cases without GATA2 mutations, we hypothesize that GATA2 ASE precedes the acquisition of mutations.
The average expression of GATA2 in CEBPA DM AML was comparable to that in other AMLs, even in cases with monoallelic GATA2 expression. We show that this is due to DNA methylation–mediated gene silencing of the repressed allele, compensated for by overactivation of the long-distance −110-kb GATA2 superenhancer on the other allele (supplemental Figure 11). Interestingly, this is the same regulatory element involved in AML with t(3;3)/inv(3),4 as well as many other atypical 3q26 translocations.59 However, in these leukemias, loss of the GATA2 superenhancer results in GATA2 haploinsufficiency, which accelerates EVI1-driven leukemogenesis.60 Given the very strong association between GATA2 ASE and CEBPA DMs, we hypothesize that GATA2 ASE also contributes to CEBPA-mediated leukemogenesis, although the exact mechanisms remain unclear. One possibility is that silencing of 1 allele and enhancer activation of the other allele do not originate at the same time. Instead, high levels of GATA2 driven by the −110-kb enhancer may contribute to leukemia initiation in preleukemic cells, whereas loss of expression may be favored in later stages. This hypothesis is consistent with the findings by Saida et al61 in inv(16) AML models, where Gata2 expression was upregulated in the preleukemic phase, but monoallelic Gata2 deletions led to a more aggressive phenotype in the leukemic stage. Studies using Cebpa DM mouse leukemias in vivo62 could further clarify the order of acquisition of Gata2 ASE in those leukemias.
The acquisition of methylation and acetylation marks in the absence of changes in the DNA constitutes an example of epimutation.63 Such epigenetic modifications have been extensively detected in cancer, often affecting the expression levels of tumor suppressor genes.64 Here, we show that epimutations leading to GATA2 ASE are mostly somatic and lost at remission, which further supports the notion that they play a role in leukemia development. Although hyperactivation of the −110-kb superenhancer was not reported, other studies had previously detected hypermethylation of the GATA2 promoter in non-CEBPA DM cases.51,57 Why GATA2 is prone to acquisition of these epimutations and how or when they are exactly incorporated remain to be elucidated. One intriguing possibility is that GATA2 ASE is acquired at a certain differentiation stage that becomes the leukemia cell of origin. Given that other subgroups with CEBPA abnormalities (other than mutations) do not show a similar pattern, we propose that ASE of GATA2 is not a consequence of CEBPA mutations. Intriguingly, GATA2 promoter methylation levels of other AML cases with GATA2 ASE are low, suggesting there might be another mechanism at play in those.
In a single patient with CEBPA DMs, we observed GATA2 ASE at diagnosis as well as in remission, which poses several questions for future research. First, GATA2 ASE in remission marrow should be analyzed in a much larger cohort to determine the frequency of such a condition. Second, it would be interesting to determine whether GATA2 ASE was already present in bone marrow progenitors before leukemic transformation and, if so, whether it was somatically acquired or present in the germ line. Importantly, this would suggest that an SNV in a regulatory domain of GATA2 is responsible for such an effect.
In summary, GATA2 ASE is a somatic event that is epigenetically acquired in almost all CEBPA DM AML cases, suggesting it plays a key role in the development and/or progression of this leukemia subtype, a notion further supported by the association between GATA2 mutations and CEBPA mutations. The specific mechanisms remain unclear, but the importance of fine-tuned GATA2 regulation points to GATA2 levels. Therefore, we propose that increased levels of GATA2 mediated by overactivation of the superenhancer, in collaboration with CEBPA mutations, might be an early event in leukemic transformation. Later, allele-specific silencing would result in stabilization of GATA2 levels in leukemic blasts.
Sequence data have been deposited in the European Genome-phenome Archive (EGA; http://www.ebi.ac.uk/ega/), which is hosted by the European Bioinformatics Institute, under accession number EGA S00001004684.
The online version of this article contains a data supplement.
The publication costs of this article were defrayed in part by page charge payment. Therefore, and solely to indicate this fact, this article is hereby marked “advertisement” in accordance with 18 USC section 1734.
Acknowledgments
The authors thank their colleagues from the bone marrow transplantation group and the molecular diagnostic laboratory of the Department of Hematology at the Erasmus University Medical Center for storage of samples and molecular analysis of the leukemia cells. The authors also thank their colleagues from the Department of Hematology for their input, especially Remco Hoogenboezem for bioinformatic support and algorithm implementation. The authors acknowledge the research technicians involved in this work: Margit Nützel, Hanna Stanewsky, Johanna Raithel, and Ute Ackermann. Finally, the authors thank Roberto Avellino for critically reading the manuscript and Timothy Ley for discussing the findings.
This work was supported by grants and fellowships from the Dutch Cancer Society (R.D., B.J.W., R.M.-L., and S.v.H.) and a Leukemia & Lymphoma Society (LLS) Special Fellowship Award (B.J.W.). A.M.M. is supported by National Institutes of Health, National Cancer Institute grants UG1 CA233332 and R01 CA198089, and LLS Specialized Center of Research grant 7013-17.
Authorship
Contribution: R.M.-L., B.J.W., and R.D. designed the study. S.v.H., C.E., C.G., E.B., and I.R. carried out experiments; R.M.-L., M.A.S., C.V., J.d.R., and P.V. analyzed data; and P.V., A.M.M., and M.R. provided samples and/or data. R.M.-L., B.J.W., and R.D. wrote the manuscript.
Conflict-of-interest disclosure: A.M.M. receives research funding from Janssen, Daiichi Sankyo, and Sanofi; has consulted for Epizyme, Constellation, BMI, and Exo-Therapeutics; and is a scientific advisor to KDAC. J.d.R. is cofounder of Cyclomics BV. The remaining authors declare no competing financial interests.
Correspondence: Bas J. Wouters, Department of Hematology, Erasmus University Medical Center, Wytemaweg 80, 3015CN Rotterdam, The Netherlands; e-mail: b.wouters@erasmusmc.nl.

This feature is available to Subscribers Only
Sign In or Create an Account Close Modal