

Key Points
The 5-year risk of needing therapy among MBL with low-, intermediate-, and high-/very high–risk CLL-IPI scores is 7%, 14%, and 40%, respectively.
Survival of Rai 0 CLL patients with high-/very high–risk CLL-IPI score is shorter compared with age- and sex-matched population.

Abstract
The utility of the chronic lymphocytic leukemia-international prognostic index (CLL-IPI) in predicting outcomes of individuals with Rai 0 stage CLL and monoclonal B-cell lymphocytosis (MBL) is unclear. We identified 969 individuals (415 MBL and 554 Rai 0 CLL; median age, 64 years; 65% men) seen at Mayo Clinic between 1 January 2001 and 1 October 2018, and ascertained time to first therapy (TTFT) and overall survival (OS). After a median follow up of 7 years, the risk of disease progression needing therapy was 2.9%/y for MBL (median, not reached) and 5%/y for Rai 0 CLL (median, 10.4 years). Among patients with low, intermediate, and high/very high-risk CLL-IPI risk groups, the estimated 5-year risk of TTFT was 13.5%, 30%, and 58%, respectively, P< .0001 (c-statistic = 0.69); and the estimated 5-year OS was 96.3%, 91.5%, and 76%, respectively, P< .0001 (c-statistic = 0.65). In a multivariable analysis of absolute B-cell count with individual factors of the CLL-IPI, the absolute B-cell count was associated with shorter TTFT (hazard ratio [HR] for each 10 × 109/L increase: 1.31; P< .0001) and shorter OS (HR: 1.1; P = .02). The OS of the entire cohort was similar to that of the age- and sex-matched general population of Minnesota (P = .17), although Rai 0 CLL patients with high and very high-risk CLL-IPI score had significantly shorter OS (P= .01 and P= .0001, respectively). The results of this study demonstrate the ability of CLL-IPI to predict time from diagnosis to first treatment (an end point not affected by therapy) in a large cohort of patients whose only manifestation of disease is a circulating clonal lymphocyte population.
Medscape Continuing Medical Education online
In support of improving patient care, this activity has been planned and implemented by Medscape, LLC and the American Society of Hematology. Medscape, LLC is jointly accredited by the Accreditation Council for Continuing Medical Education (ACCME), the Accreditation Council for Pharmacy Education (ACPE), and the American Nurses Credentialing Center (ANCC), to provide continuing education for the healthcare team.
Medscape, LLC designates this Journal-based CME activity for a maximum of 1.00 AMA PRA Category 1 Credit(s)™. Physicians should claim only the credit commensurate with the extent of their participation in the activity.
Successful completion of this CME activity, which includes participation in the evaluation component, enables the participant to earn up to 1.0 MOC points in the American Board of Internal Medicine’s (ABIM) Maintenance of Certification (MOC) program. Participants will earn MOC points equivalent to the amount of CME credits claimed for the activity. It is the CME activity provider’s responsibility to submit participant completion information to ACCME for the purpose of granting ABIM MOC credit.
All other clinicians completing this activity will be issued a certificate of participation. To participate in this journal CME activity: (1) review the learning objectives and author disclosures; (2) study the education content; (3) take the post-test with a 75% minimum passing score and complete the evaluation at http://www.medscape.org/journal/blood; and (4) view/print certificate. For CME questions, see page 204.
Disclosures
Associate Editor Michael Hallek and CME questions author Laurie Barclay, freelance writer and reviewer, Medscape, LLC, declare no competing financial interests. Author Sameer A. Parikh reports funding from AbbVie, Ascentage Pharma, AstraZeneca, Bristol Myers Squibb, Janssen Pharmaceuticals, Merck, MorphoSys, Pharmacyclics, and TG Therapeutics and participation (without personal compensation) in advisory board meetings of AbbVie, AstraZeneca, Genentech, Gilead, GlaxoSmithKline, Pharmacyclics, and Verastem Oncology. Author Neil E. Kay reports research funding from Acerta Pharma, Pharmacyclics, MEI Pharma, and Tolero; advisory board participation for Acerta Pharma, AstraZeneca, CytomX Therapeutics, Dava Oncology, Juno Therapeutics, and Pharmacyclics; and membership on data safety monitoring committees for Agios Pharm, Celgene, Sunesis, CytomX Therapeutics, Morpho-Sys, Rigel Pharm, and Juno Therapeutics. Author Wei Ding reports research funding from Determine and Merck and advisory board participation for Merck and Octapharma. Author Saad S. Kenderian reports patents in the field of CAR immunotherapy that are licensed to Novartis Pharmaceuticals Corporation through an agreement among the Mayo Clinic, Novartis Pharmaceuticals Corporation, and the University of Pennsylvania; is an inventor on patents in the field of CAR immunotherapy that are licensed to Humanigen through Mayo Clinic; is an inventor on patents in the field of CAR immunotherapy that are licensed to Mettaforge Therapeutics through the Mayo Clinic; and reports research funding from Celgene, Gilead, Humanigen, Juno, Kite, Lentigen, MorphoSys, Novartis, Sunesis, and Tolero. Author Yucai Wang reports research funding from Genentech, Incyte Corporation; InnoCare, and Novartis. Author Esteban Braggio reports serving as a consultant for DASA. Author Tait D. Shanafelt reports research funding from Genentech and Pharmacyclics. The remaining authors declare no competing financial interests.
Learning objectives
Upon completion of this activity, participants will:
- 1.
Describe the ability of the chronic lymphocytic leukemia international prognostic index (CLL-IPI) to predict time to first therapy and overall survival in Rai 0 chronic lymphocytic leukemia (CLL) and monoclonal B-cell lymphocytosis (MBL)
- 2.
Determine the impact of incorporating absolute B-cell count as an additional factor to the CLL-IPI to predict outcomes
- 3.
Identify overall survival in patients with MBL and Rai 0 CLL compared with the age- and sex-matched general population and other clinical implications of this study of predictive ability of CLL-IPI in patients with Rai stage 0 CLL and MBL
Release date: July 15, 2021; Expiration date: July 15, 2022
Introduction
Small clonal B-cell populations are present in the peripheral blood of ∼3% of all US adults older than age of 40 years and ∼5% of those older than age 60 years.1 Although many individuals with these small B-cell clones never come to clinical attention, about 2% are clinically ascertained when they undergo evaluation for lymphocytosis or cytopenias identified on a routine complete blood count. The conundrum of how to classify such individuals was standardized in 2005 by somewhat arbitrarily designating individuals with a circulating population of clonal B cells with a chronic lymphocytic leukemia (CLL)-like phenotype (ie, CD5+, CD19+, CD23+, CD20 [dim], and κ/λ light chain restriction [dim]) and a total B-cell count of <5 × 10⁹/L as having monoclonal B-cell lymphocytosis (MBL), and labeling those with B-cell counts above this threshold as CLL.2 Individuals with MBL are often further categorized as having low-count or high-count MBLs based on whether the clonal B-cell count is below or above 0.5 × 10⁹/L, respectively.3
The 2018 International Workshop for CLL (iwCLL) guidelines recommend close observation for individuals with MBL and Rai 0 CLL, without any active therapy at the time of diagnosis.3,4 Accurately predicting which individuals will experience a more or less aggressive clinical course after diagnosis has been challenging. Knowledge of prognosis can be used to counsel patients and tailor frequency of follow-up. For more than 40 years, the Rai/Binet staging classifications have formed the backbone of CLL management.5,6 Independent of stage, a wide array of biologic and molecular factors that relate to prognosis have been identified, including immunoglobulin heavy chain (IGHV) gene mutation status, cytogenetic abnormalities, CD49d protein expression, and characteristics of the host immune environment.7 To integrate the results of multiple discordant prognostic parameters into a single risk score, the CLL-International Prognostic Index (CLL-IPI) was developed and identified the following 5 parameters to be independently associated with shorter overall survival (OS): age >65 years, Rai stage ≥I, unmutated IGHV gene, serum β-2 microglobulin (β2M) >3.5 mg/L, and TP53 disruption (either by deletion 17p detected by fluorescence in situ hybridization [FISH] or TP53 mutation). Using a weighted grading system, 4 risk categories based on the total score were assigned: low risk (score 0-1), intermediate risk (score 2-3), high risk (score 4-6), and very high risk (score 7-10). Although the CLL-IPI was originally developed with the intent to predict OS, it was also found to predict time to first therapy (TTFT). In a cohort of newly diagnosed CLL patients seen at Mayo Clinic, the CLL-IPI showed that the 5-year treatment-free survival for patients in the low-, intermediate-, high-, and very high-risk categories was 78%, 57%, 32%, and 0%, respectively.8
The CLL-IPI has also been shown to predict TTFT in other cohorts of asymptomatic CLL patients at the time of diagnosis, including individuals who have Rai stage I and II disease.9,10 There are limited data, however, of the utility of the CLL-IPI in predicting TTFT and OS in individuals whose only disease manifestation is a circulating B-cell clone (ie, those with Rai 0 CLL or MBL). In the current study, we sought to determine (1) if the CLL-IPI can predict TTFT and OS in Rai 0 CLL and MBL and (2) whether absolute B-cell count should be incorporated as an additional factor to the CLL-IPI to predict outcomes.
Methods
The Mayo Clinic CLL Database comprises individuals with a clonal B-cell population of CLL immunophenotype who are seen at Mayo Clinic, Rochester, MN, and who allow their medical records be used for research purposes.11-13 We identified individuals with MBL and previously untreated Rai 0 CLL in the Mayo Clinic CLL Database who were seen within 3 years of their initial diagnosis. Baseline clinical characteristics including age, sex, Rai stage, serum β2M, lactate dehydrogenase, IGHV mutation status, and genetic abnormalities detectable by FISH were ascertained at the time of diagnosis. TP53 mutation assay was performed as part of routine clinical care in a subset of individuals using Sanger sequencing to detect the presence of somatic mutations involving exons 4 through 9 and associated splice junctions (sensitivity of the assay is ∼15% to 20%). The CLL-IPI was computed on individuals as previously described (individuals with MBL were considered to have Rai 0 disease for calculating the CLL-IPI).8 For those individuals in which all the components to accurately classify the CLL-IPI risk category were not available, we assigned CLL-IPI value if knowledge of the missing values would not have affected CLL-IPI risk group. Individuals were followed until death or loss to follow-up. The Mayo Clinic institutional review board approved this study.
Statistical analyses
We used χ2 tests to compare discrete variables and the Kruskal-Wallis test to compare continuous variables. The OS was calculated from date of diagnosis to date of death or last known alive date. The TTFT was calculated from date of diagnosis to date of first treatment or date last known to be untreated. Individuals with CLL treated on early intervention trials for high-risk disease (ie, those who did not meet the 2018 iwCLL criteria3 for initiation of therapy) were censored on the date of treatment initiation for the purposes of TTFT analyses. Kaplan-Meier plots displayed OS, cumulative incidence plots displayed TTFT and time to progression to CLL, and log-rank tests compared OS and TTFT by CLL-IPI. We computed c-statistics to evaluate model discriminative ability. Cox proportional hazards models were used to estimate hazard ratios (HR) and 95% confidence intervals (CI) in OS and TTFT analyses. The Fine-Gray method was used to evaluate competing risk of death in the TTFT analyses. All statistical analyses were performed using SAS 9.4 (SAS Institute, Cary, NC).
Results
A total of 969 individuals seen between 1 January 2001 and 1 October 2018 were included in final analysis (415 MBL and 554 Rai 0 CLL). The median age was 64 years (range, 31-91), and 631 (65%) were men. The distribution of the overall cohort according to the CLL-IPI risk groups was low risk in 566 individuals (58%), intermediate risk in 304 (31%), high risk in 84 (9%), and very high risk in 15 (2%) individuals. Table 1 shows the baseline characteristics of all individuals included in this study. The median follow-up time for the study was 7.0 years; 282 individuals received therapy and 212 died. Supplemental Table 1, available on the Blood Web site, shows the types of treatment administered.
Baseline characteristics of all individuals with MBL or Rai 0 CLL
| Characteristic | MBL (N = 415) | CLL (N = 554) | Total (N = 969) | |
|---|---|---|---|---|
| Median age, y (range) | 65 (41-87) | 63 (31-91) | 64 (31-91) | |
| Males | 263 (63.4%) | 368 (66.4%) | 631 (65.1%) | |
| Median absolute lymphocyte count, ×109/L (range) | 6.2 (0.9-11.8) | 14.8 (5.5-280.7) | 9.7 (0.9-280.7) | |
| Median absolute clonal B-cell count, ×109/L (range) | 2.9 (0.03-4.9) | 9.3 (5.0-172.0) | 5.7 (0.03-172.0) | |
| IGHV mutation status | ||||
| Mutated | 298 (71.8%) | 355 (64.3%) | 653 (67.5%) | |
| Unmutated | 117 (28.2%) | 197 (35.7%) | 314 (32.5%) | |
| Median serum β-2 microglobulin (μg/mL) | 2.1 (0.9-21.5) | 2.2 (0.2-15.8) | 2.2 (0.2-21.5) | |
| CLL FISH* | ||||
| Low risk (del13q) | 186 (45.3%) | 288 (52.7%) | 474 (49.5%) | |
| Intermediate risk (trisomy 12 or negative) | 193 (47.0%) | 203 (37.2%) | 396 (41.4%) | |
| High risk (del11q or del17p) | 32 (7.8%) | 55 (10.1%) | 87 (9.1%) | |
| TP53 disruption (either by del17p FISH or TP53 mutation) | 20 (4.8%) | 26 (4.7%) | 46 (4.7%) | |
| CD49d ≥30% | 127 (31.8%) | 107 (21.2%) | 234 (25.9%) | |
| CD38 ≥20% | 88 (21.3%) | 114 (20.8%) | 202 (21.0%) | |
| CLL-IPI | ||||
| Low risk | 258 (62.2%) | 308 (55.6%) | 566 (58.4%) | |
| Intermediate risk | 116 (28.0%) | 188 (33.9%) | 304 (31.4%) | |
| High risk | 37 (8.9%) | 47 (8.5%) | 84 (8.7%) | |
| Very high risk | 4 (1.0%) | 11 (2.0%) | 15 (1.5%) | |
Eleven individuals (3 with MBL and 8 with Rai 0 CLL) have other findings on FISH studies, including 3 individuals who had del6q (1 MBL, 2 CLL) and 8 individuals with del14q (2 MBL, 6 CLL).
Time to first therapy in MBL and Rai 0 CLL, according to the CLL-IPI
In the overall cohort, the CLL-IPI predicted TTFT (Figure 1A, P < .0001); estimated 5-year risk of needing therapy was 13.5% in the low-risk CLL-IPI group, 30.0% in intermediate-risk CLL-IPI, 60.7% in high-risk CLL-IPI, and 43.6% in very high-risk CLL-IPI. The overall risk of disease progression needing therapy significantly differed (P < .0001) between MBL and CLL, with a 2.9% risk per year for individuals with MBL (median, not reached) and 5% per year for Rai 0 CLL (median, 10.4 years). Even within the same CLL-IPI risk groups, the TTFT significantly differed for individuals with MBL compared with Rai 0 CLL (Table 2), with the following estimated 5-year risk of needing therapy: 7.1% vs 18.6% for low-risk CLL-IPI (P = .002); 13.4% vs 40.8% for intermediate-risk CLL-IPI (P < .0001); 43.0% vs 74.3% for high-risk CLL-IPI (P = .02); and 0% vs 57.8% for very high-risk CLL-IPI (P = .09), respectively. (Note: the number of individuals in the very high CLL-IPI risk group was very small; MBL [n = 4] and Rai 0 CLL [n = 11]). Figure 1B-C shows the TTFT among individuals with MBL and Rai 0 CLL, respectively, according to the CLL-IPI. Table 3 shows the estimated HR, along with the corresponding 95% CI and P value for TTFT among individuals in the intermediate-, high-, and very high-risk CLL-IPI groups (relative to low-risk CLL-IPI as the reference group). The c-statistic of the CLL-IPI in predicting TTFT for the overall cohort was 0.69 (0.67 for MBL and 0.70 for Rai 0 CLL). Supplemental Figure 1 shows the TTFT among individuals with intermediate-risk MBL is similar to low-risk Rai 0 CLL; the TTFT among individuals with high-risk MBL is similar to intermediate-risk Rai 0 CLL.
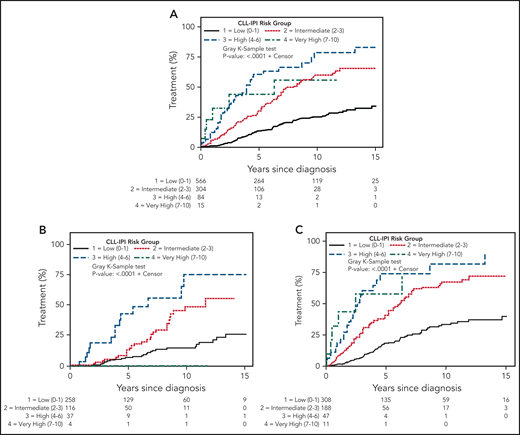
Time to first CLL therapy in MBL and Rai 0 CLL. (A) Time to first treatment by CLL-IPI risk score in the overall cohort. (B) Time to first treatment in monoclonal B-cell lymphocytosis, according to the CLL-IPI risk score, and (C) time to first treatment in Rai 0 chronic lymphocytic leukemia, according to the CLL-IPI risk score. Note: Individuals with MBL who had very high-risk CLL-IPI score (n = 4) did not need therapy with current follow-up and hence panel B does not show any events for that group.
Time to first CLL therapy in MBL and Rai 0 CLL. (A) Time to first treatment by CLL-IPI risk score in the overall cohort. (B) Time to first treatment in monoclonal B-cell lymphocytosis, according to the CLL-IPI risk score, and (C) time to first treatment in Rai 0 chronic lymphocytic leukemia, according to the CLL-IPI risk score. Note: Individuals with MBL who had very high-risk CLL-IPI score (n = 4) did not need therapy with current follow-up and hence panel B does not show any events for that group.
Time to first therapy and overall survival according to the CLL-IPI risk score among MBL and Rai 0 CLL
| CLL-IPI | Time to first therapy | ||||
|---|---|---|---|---|---|
| Estimated 5-y risk | Estimated 10-y risk | ||||
| MBL, % | Rai 0 CLL, % | MBL, % | Rai 0 CLL, % | MBL vs CLL, P | |
| Low | 7.1 | 18.6 | 14.9 | 33.7 | .002 |
| Intermediate | 13.4 | 40.8 | 49.0 | 67.7 | <.0001 |
| High | 43.0 | 74.3 | 75.1 | 81.9 | .02 |
| Very high | 0.0 | 57.8 | 0.0 | Not estimable | .09 |
| CLL-IPI | Overall survival | ||||
| Estimated 5-y risk | Estimated 10-y risk | ||||
| MBL, % | Rai 0 CLL, % | MBL, % | Rai 0 CLL, % | MBL vs CLL, P | |
| Low | 95.3 | 97.1 | 82.4 | 80.7 | .98 |
| Intermediate | 94.2 | 89.8 | 72.8 | 67.9 | .55 |
| High | 83.6 | 77.1 | 62.4 | 46.0 | .14 |
| Very high | 75.0 | 26.9 | 75.0 | 13.5 | .36 |
Values in bold indicate P < .05.
Cox proportional hazard model to estimate hazard ratios and 95% CI for time to first therapy and OS in MBL and Rai 0 CLL
| CLL-IPI risk group | MBL | |||||
|---|---|---|---|---|---|---|
| Time to first therapy | Overall survival | |||||
| HR | 95% CI | P | HR | 95% CI | P | |
| Intermediate vs low | 2.7 | 1.6-4.5 | .0002 | 1.9 | 1.1-3.1 | .01 |
| High vs low | 6.2 | 3.1-12.5 | <.0001 | 2.6 | 1.4-5.1 | .003 |
| Very high vs low | Not estimable | — | — | 5.3 | 1.3-22.0 | .02 |
| CLL-IPI risk group | CLL | |||||
| Time to first therapy | Overall survival | |||||
| HR | 95% CI | P | HR | 95% CI | P | |
| Intermediate vs low | 2.9 | 2.1-4.0 | <.0001 | 2.0 | 1.4-3.0 | .0005 |
| High vs low | 6.1 | 3.7-9.5 | <.0001 | 4.2 | 2.5-7.2 | <.0001 |
| Very high vs low | 5.4 | 1.8-15.0 | .002 | 12.2 | 5.9-25.1 | <.001 |
Values in bold indicate P < .05.
Multivariable analysis of the impact of absolute B-cell count on the individual components of the CLL-IPI in individuals with Rai 0 CLL and MBL
| Characteristic | Time to first therapy | Overall survival | ||||
|---|---|---|---|---|---|---|
| HR | 95% CI | P | HR | 95% CI | P | |
| Age >65 y | 0.8 | 0.6-1.1 | .12 | 3.5 | 2.5-4.9 | <.0001 |
| Unmutated IGHV genes | 3.4 | 2.6-4.4 | <.0001 | 1.7 | 1.3-2.3 | .0004 |
| Serum β-2 microglobulin >3.5 g/L | 2.5 | 1.7-3.6 | <.0001 | 2.7 | 1.9-3.7 | <.0001 |
| TP53 disruption | 1.4 | 0.7-2.7 | .36 | 2.2 | 1.3-3.7 | .005 |
| Absolute B-cell count* | 1.31 | 1.26-1.37 | <.0001 | 1.1 | 1.01-1.2 | .02 |
| Rai stage† | NA | NA | NA | NA | NA | NA |
NA, not available.
*HR for each 10 × 109/L increase.
†All individuals would fall in the Rai stage 0 category.
Overall survival in MBL and Rai 0 CLL, according to the CLL-IPI
The median OS for the entire cohort was 17.8 years (17.9 for MBL and 17.2 for Rai 0 CLL). The CLL-IPI predicted OS in the overall cohort (Figure 2A, P < .0001): estimated 5-year survival was 96.3% in the low-risk CLL-IPI group, 91.5% in intermediate-risk CLL-IPI, 80.0% in high-risk CLL-IPI, and 42.1% in very high-risk CLL-IPI. OS was not significantly different for individuals with MBL compared with Rai 0 CLL in the same CLL-IPI risk group (Table 2), with the following estimated 5-year survival: 95.3% vs 97.1% for low-risk CLL-IPI (P = .98), 94.2% vs 89.8% for intermediate-risk CLL-IPI (P = .55), 83.6% vs 77.1% for high-risk CLL-IPI (P = .14), and 75.0% vs 26.9% for very high risk CLL-IPI (P = .36), respectively. Figure 2B-C shows the OS among individuals with MBL and Rai 0 CLL, respectively, according to the CLL-IPI. Table 3 shows the estimated HR, along with the corresponding 95% CI and P value for OS among individuals in the intermediate-, high-, and very high-risk CLL-IPI risk groups (relative to low-risk CLL-IPI as the reference group). The c-statistic of the CLL-IPI in predicting OS for the overall cohort was 0.65 (0.61 for MBL and 0.67 for Rai 0 CLL). Because the number of individuals with very high-risk CLL-IPI risk score was small, we combined the high- and very high-risk groups into a single group. Supplemental Figures 2 and 3 show the TTFT and OS, respectively, of individuals with MBL and CLL according to 3 CLL-IPI risk groups: low, intermediate, and high/very high.
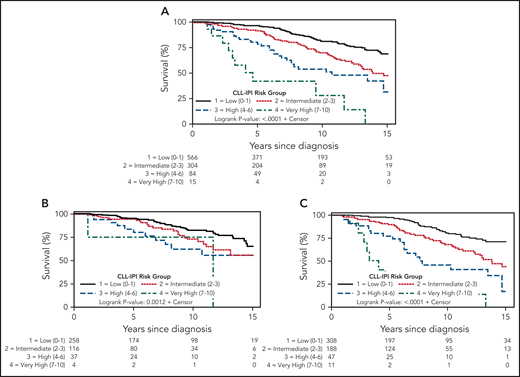
OS in MBL and Rai 0 CLL. (A) Overall survival by CLL-IPI in the entire cohort, (B) overall survival by CLL-IPI in monoclonal B cell lymphocytosis, and (C) overall survival by CLL-IPI in Rai 0 chronic lymphocytic leukemia.
OS in MBL and Rai 0 CLL. (A) Overall survival by CLL-IPI in the entire cohort, (B) overall survival by CLL-IPI in monoclonal B cell lymphocytosis, and (C) overall survival by CLL-IPI in Rai 0 chronic lymphocytic leukemia.
Impact of the absolute B-cell count on TTFT and OS
Because our study only included individuals with Rai 0 CLL and MBL, Rai stage adds no useful information to the CLL-IPI model. Based on previous evidence that absolute B-cell count is associated with progression in such patients,14-17 we explored whether B-cell count may add prognostic value in place of Rai stage. On univariable analysis, absolute B-cell count at the time of diagnosis predicted TTFT and OS in the entire cohort (HR for each 10 × 109/L increase in absolute B-cell count: 1.34, 95% CI, 1.27-1.42; P < .0001; and HR 1.10, 95% CI, 1-02-1.18; P = .02, respectively). When the absolute B-cell count was dichotomized at the 5 × 10⁹/L threshold (to account for MBL vs Rai 0 CLL diagnoses), the shorter TTFT remained significant (HR for each 10 × 109/L increase in absolute B-cell count: 2.2, 95% CI, 1.6-2.9; P < .0001); however, the shorter OS was borderline nonsignificant (HR 1.3, 95% CI, 0.96-1.7; P = .09). Table 4 shows multivariable analysis of absolute B-cell count along with the other individual prognostic factors in the CLL-IPI. In addition to age, serum β2M, IGHV mutation, and TP53 disruption status, the absolute B-cell count was associated with a shorter OS (HR for each 10 × 109/L increase: 1.1; 95% CI, 1.01-1.2, P = .02). The absolute B-cell count was also significantly associated with shorter TTFT (HR for each 10 × 109/L increase: 1.31; 95% CI, 1.26-1.37, P < .0001) in addition to IGHV mutation and serum β-2 microglobulin; however, age and TP53 disruption were not associated with shorter TTFT in this model. The c-statistic of the absolute B-cell count in predicting TTFT and OS was 0.70 and 0.56, respectively. The c-statistic of the combination of CLL-IPI and absolute B-cell count in predicting TTFT was 0.76; for OS, for the overall cohort was 0.66.
C-statistic of time to first therapy and overall survival
| OS | TTFT | ||||||
|---|---|---|---|---|---|---|---|
| Cohort | N | IGHV | IGHV, B2M, ABC | CLL-IPI | IGHV | IGHV, B2M, ABC | CLL-IPI |
| Overall | 900 | 0.58 | 0.66 | 0.65 | 0.67 | 0.76 | 0.69 |
| MBL | 390 | 0.55 | 0.64 | 0.61 | 0.63 | 0.68 | 0.67 |
| Rai 0 CLL | 510 | 0.59 | 0.67 | 0.67 | 0.69 | 0.76 | 0.70 |
ABC, absolute B cell count.
Table 5 shows the c-statistic of IGHV mutation status alone, CLL-IPI risk score, and the combination of IGHV mutation status, serum β2M, and absolute B-cell count in predicting TTFT and OS in the overall cohort, and among individuals with MBL and Rai 0 CLL. The combination of IGHV mutation status, serum β2M, and absolute B-cell count has similar c-statistic to predict OS compared with the CLL-IPI. However, the combination of IGHV mutation status, serum β2M, and absolute B-cell count has an improved c-statistic in predicting TTFT, a finding that is predominantly driven by Rai 0 CLL patients.
Outcomes compared with age- and sex-matched general population
We next compared the OS of all individuals with MBL and Rai 0 CLL included in this study to the age- and sex-matched general population of the state of Minnesota. Figure 3 shows that, relative to the general population, the OS of the combined cohort of MBL and Rai 0 CLL was similar (Figure 3A; P = .17). The OS of individuals with MBL was longer (Figure 3B; P = .005) compared with the general population, whereas the OS of those with Rai 0 CLL was similar to the general population (Figure 3C; P = .42). Figure 4A-D show the OS of individuals with MBL compared with the age- and sex-matched general population of the state of Minnesota, according to the CLL-IPI risk score. The OS of individuals with MBL who had low-risk CLL-IPI score was significantly longer compared with the age- and sex-matched general population; however, there were no significant differences in OS among individuals with intermediate-, high-, and very high-risk CLL-IPI compared with age- and sex-matched general population of the state of Minnesota. Figure 5A-D shows the OS of patients with Rai 0 CLL compared with the age- and sex-matched general population of the state of Minnesota, according to the CLL-IPI score. Similar to MBL, individuals with Rai 0 CLL who had low-risk CLL-IPI score had a longer OS compared with the general population; in contrast, Rai 0 CLL patients with high- and very high-risk CLL-IPI risk scores had a significantly shorter OS.

OS of MBL and Rai 0 CLL patients compared to general population. (A) Overall survival in the entire cohort compared with expected survival in an age- and sex-matched population of Minnesota, (B) overall survival in monoclonal B-cell lymphocytosis compared with expected survival in an age- and sex-matched population of Minnesota, and (C) overall survival in Rai 0 chronic lymphocytic leukemia compared with expected survival in an age- and sex-matched population.
OS of MBL and Rai 0 CLL patients compared to general population. (A) Overall survival in the entire cohort compared with expected survival in an age- and sex-matched population of Minnesota, (B) overall survival in monoclonal B-cell lymphocytosis compared with expected survival in an age- and sex-matched population of Minnesota, and (C) overall survival in Rai 0 chronic lymphocytic leukemia compared with expected survival in an age- and sex-matched population.
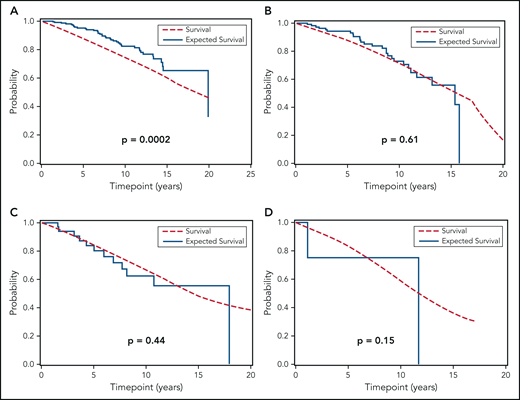
OS of individuals with MBL, according to the CLL-IPI risk score, relative to the general population. (A) Overall survival of MBL individuals according to low-risk, (B) intermediate-risk, (C) high-risk, and (D) very high-risk CLL-IPI score compared with the age- and sex-matched general population of the state of Minnesota.
OS of individuals with MBL, according to the CLL-IPI risk score, relative to the general population. (A) Overall survival of MBL individuals according to low-risk, (B) intermediate-risk, (C) high-risk, and (D) very high-risk CLL-IPI score compared with the age- and sex-matched general population of the state of Minnesota.
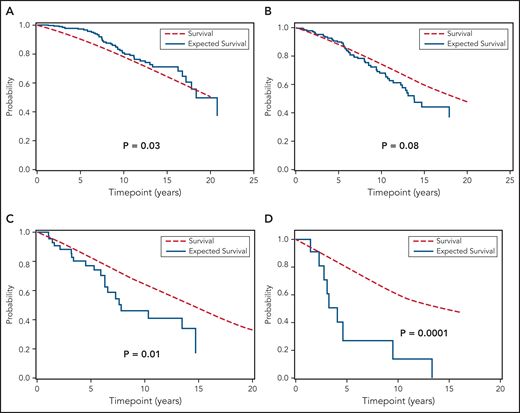
OS of Rai 0 CLL patients, according to the CLL-IPI risk score, relative to the general population. (A) Overall survival of Rai 0 CLL according to low-risk, (B) intermediate-risk, (C) high-risk, and (D) very high-risk CLL-IPI score compared with the age- and sex-matched general population of the state of Minnesota.
OS of Rai 0 CLL patients, according to the CLL-IPI risk score, relative to the general population. (A) Overall survival of Rai 0 CLL according to low-risk, (B) intermediate-risk, (C) high-risk, and (D) very high-risk CLL-IPI score compared with the age- and sex-matched general population of the state of Minnesota.
Discussion
The vast majority of patients with CLL and virtually all individuals with MBL are asymptomatic at the time of diagnosis, and do not need therapy.18 The 2018 iwCLL guidelines recommend “watchful waiting” with close monitoring for progression of disease with periodic physical examination and laboratory testing.8 The most common question asked by patients during this “watch-and-wait” management strategy is when will they need therapy for their disease? Although several risk prediction models are published in the literature to date, these studies included (1) progressive patients treated in clinical trials8 ; (2) patients with advanced stage CLL19,20 ; and (3) those that evaluated OS as the primary outcome.5,8,21,22 In this study, we present data about TTFT by CLL-IPI risk category in individuals with MBL and Rai 0 CLL, an important clinical outcome among individuals who have no manifestation of clinical disease other than clonal lymphocytosis.
The results from our study demonstrate that the CLL-IPI is a robust prognostic tool for predicting risk of progressive disease needing therapy among individuals with MBL and Rai 0 CLL. Of the 415 individuals with MBL included in this study, ∼60% had low-risk CLL-IPI score, ∼28% had intermediate-risk disease, and ∼10% had high-/very high-risk CLL-IPI score. In contrast to the generic 1% to 2% per year risk of progression to therapy typically quoted to individuals with MBL,4,17,23,24 results from our study show this risk can be further stratified using the CLL-IPI risk score, in which the 1-year risk of needing therapy is ∼1% in the low-risk CLL-IPI group compared with ∼2.5% in those with intermediate risk CLL-IPI and ∼8% in the combined high- and very-high CLL-IPI risk groups. This represents an approximately twofold higher risk of needing therapy in individuals with MBL who have intermediate risk CLL-IPI score, and approximately sixfold higher risk of needing therapy in individuals with MBL who have a high-/very high–risk CLL-IPI score. These findings have significant implications for the management of MBL because a subset of these individuals should likely be followed more closely for progressive disease.
Prior studies have shown the importance of absolute B-cell count in predicting TTFT and OS among individuals with early-stage asymptomatic CLL and MBL.14,15,25 Findings from the current study confirm these observations and extend our understanding of the impact of absolute B-cell count in the context of other biological variables that are included in the CLL-IPI risk score. In addition to being important in univariable analysis, a higher absolute B-cell count (as a continuous variable) remained significantly associated with shorter TTFT and OS in multivariable analysis after adjusting for other variables including FISH, IGHV mutation status, and serum β2M. It is interesting to note that individuals with MBL in the high- and very high-risk CLL-IPI risk score category have a shorter TTFT and OS compared with Rai 0 CLL patients with low-risk CLL-IPI score. These findings suggest the underlying biology of the disease process (determined by the IGHV mutation status, serum β2M, and FISH status) plays a much greater role in predicting outcomes compared with the arbitrary dichotomized threshold of a B-cell count of 5 × 10⁹/L to predict TTFT and OS. If these findings are replicated in other cohorts, the threshold of B-cell count to define a premalignant condition (MBL) from cancer (CLL) may need to be reexamined.
A recent multicenter study proposed a new prognostic score for early stage asymptomatic CLL (IPS-E), and found that an absolute lymphocyte count >15 × 109/L, palpable lymph nodes, and unmutated IGHV gene were significant factors in predicting TTFT.26 The IPS-E score cannot be applied to individuals with MBL (the absolute lymphocyte count is typically <12 × 109/L) or to patients with Rai 0 CLL (they do not have palpable lymph nodes, by definition). The IPS-E score did not find serum β2M as an independent predictor of TTFT; in contrast, the CLL-IPI score includes this factor, and indeed we found that it remains an important predictor of TTFT in our analyses of MBL and Rai 0 CLL, after adjusting for IGHV mutation status, TP53 disruption, and age. Given that Rai stage does not factor in the CLL-IPI model for our study, we substituted it with absolute B-cell count and found that similar to the IPS-E, TP53 disruption (either del17p by FISH and/or TP53 mutation) was not significant in this model. These results indicate that although TP53 disruption is an important predictive biomarker for CLL therapy, it plays a limited role in predicting disease progression in Rai 0 CLL and MBL. This is particularly true for patients with Rai 0 CLL, where the c-statistic of the combination of IGHV mutation status, serum β2-microglobulin, and absolute B-cell count has a better c-statistic in predicting TTFT compared with the CLL-IPI.
Despite the importance of the CLL-IPI, the c-statistic of this prognostic tool in predicting TTFT among individuals with MBL and CLL-IPI is modest at 0.69. This does not cross the threshold of 0.7 thought to be useful for predicting risk at an individual level. The addition of absolute B-cell count to CLL-IPI improved the c-statistic to 0.76, which suggests this is an important variable to be considered in the evaluation of Rai 0 CLL and MBL. However, the absolute B-cell count did not provide incremental benefit to the CLL-IPI in improving the prediction for OS. Additional biomarkers of interest, such as polygenic risk score,27 number and types of somatic mutations identified by next-generation sequencing,28 measures of immune function such as serum immunoglobulins, and serum B-cell maturation antigen,29 are all being investigated to improve our ability to predict comes of individuals with early stage asymptomatic CLL and MBL.
In our analysis, the OS of the overall cohort of individuals with MBL and Rai 0 CLL did not appear to be significantly different compared with the age- and sex-matched general population of the state of Minnesota. However, when evaluating the OS of Rai 0 CLL patients within individual CLL-IPI risk groups, it appears that those with high- and very high-risk CLL-IPI groups have shorter OS compared with the age- and sex-matched general population, whereas those with low and intermediate risk have similar OS. Given the availability of novel oral agents in the management of CLL and the renewed interest in evaluating them for early intervention in CLL, clinical trials evaluating the value of early intervention in patients with CLL that have high- and very high-risk CLL-IPI risk score seems appropriate. The findings of an improved OS of individuals with low-risk CLL-IPI score in both MBL and Rai 0 CLL is intriguing. It is plausible that these individuals who seek care at our institution may have longer OS relative to the general population because of referral bias, enhanced screening for second malignancies including skin cancers, and appropriate counseling about the risk of infections. However, given the retrospective nature of the study, these data remain hypothesis generating; prospective study, longer follow-up, and external validation are necessary to confirm these initial findings.
Our study has several limitations. It is a single-center study, and hence results may not be generalizable. Second, the treatment of CLL has undergone significant changes in the 2 decades since these patients were enrolled, and this may affect the assessment of OS. However, time to first CLL therapy inherently remains a function of the underlying biology of the disease, and therefore these results would still be valid at the current time. There were very few individuals in the very high CLL-IPI risk group among both the MBL and CLL cohorts. We may have misclassified some individuals as having no abnormality on FISH studies because the threshold of detecting abnormalities on cytogenetic testing is ∼2 × 10⁹/L B lymphocytes. Finally, not all individuals had TP53 mutation testing performed, which may have led to inaccurate classification of ∼3% to 5% individuals who have TP53 aberration in the absence of del17p by FISH testing.30,31 In addition, among those patients who had TP53 sequencing performed, the sensitivity of the assay (Sanger sequencing) was ∼15% to 20%.
In summary, the CLL-IPI assessed at the time of initial diagnosis predicts TTFT and OS in individuals with both MBL and Rai 0 CLL. Although the utility of CLL-IPI to stratify OS may be evolving in the novel therapy era, the results of this study demonstrate its ability to predict time from diagnosis to first treatment (an end point not impacted by the evolution of therapy) in a large cohort of patients whose only manifestation of disease is a circulating clonal lymphocyte population.
Presented as a poster presentation at the virtual 25th Congress of the European Hematology Association on 11 June 2020.
For original data, please email the corresponding author.
The online version of this article contains a data supplement.
There is a Blood Commentary on this article in this issue.
The publication costs of this article were defrayed in part by page charge payment. Therefore, and solely to indicate this fact, this article is hereby marked “advertisement” in accordance with 18 USC section 1734.
Acknowledgments
This work was supported by grants from the National Institutes of Health, National Cancer Institute (R01 CA235026 and R01 CA197120). The conduct of this research was supported, in part, by the Henry J. Predolin Foundation. S.A.P. and S.S.K. also acknowledge support from the Mayo Clinic K2R Career Development Program.
Authorship
Contribution: S.A.P., N.E.K., E.B., C.A.H., S.L.S., and T.D.S. designed the research, collected, analyzed, and interpreted data, cared for the patients, and wrote the manuscript; T.G.C., W.D., J.F.L., S.S.K., A.B.K., E.M., and Y.W. cared for the patients, analyzed data, and critically reviewed the manuscript; K.G.R., S.M.S., C.E.L., and G.K. collected and analyzed data, conducted statistical analysis, and critically reviewed the manuscript; and all authors approved the manuscript in its final format.
Conflict-of-interest disclosure: S.A.P. reports that research funding has been provided to the institution from Pharmacyclics, MorphoSys, Janssen, AstraZeneca, TG Therapeutics, Bristol Myers Squibb, Merck, AbbVie, and Ascentage Pharma for clinical studies in which S.A.P. is a principal investigator; S.A.P. has also participated in Advisory Board meetings of Pharmacyclics, AstraZeneca, Genentech, Gilead, GlaxoSmithKline, Verastem Oncology, and AbbVie (but was not personally compensated for his participation). N.E.K. reports research funding from Acerta Pharma, Pharmacyclics, MEI Pharma, and Tolero; he is on a data safety monitoring committee for Agios Pharm, Celgene, Sunesis, CytomX Therapeutics, MorphoSys, Rigel Pharm, and Juno Therapeutics. N.E.K. is on an advisory board for Astra Zeneca, CytomX Therapeutics, Pharmacyclics, Dava Oncology, Acerta Pharma BV, and Juno Therapeutics. W.D. reports research funding from Determine and Merck, and advisory board participation for Merck and Octapharma. S.S.K. is an inventor on patents in the field of CAR immunotherapy that are licensed to Novartis (through an agreement between Mayo Clinic, University of Pennsylvania, and Novartis). S.S.K. is an inventor on patents in the field of CAR immunotherapy that are licensed to Humanigen (through Mayo Clinic). S.S.K. is an inventor on patents in the field of CAR immunotherapy that are licensed to Mettaforge (through Mayo Clinic). S.S.K. receives research funding from Kite, Gilead, Juno, Celgene, Novartis, Humanigen, MorphoSys, Tolero, Sunesis, and Lentigen. Y.W. reports research funding (to the institution) from Incyte, InnoCare, Novartis, and Genentech. E.B. is a consultant of DASA. E.B reports serving as a cunsultant for DASA. T.D.S. reports research support to institution from Pharmacyclics and Genentech. The remaining authors declare no competing financial interests.
Correspondence: Sameer A. Parikh, Division of Hematology, Department of Medicine, Mayo Clinic, 200 First St SW, Rochester, MN 55905; e-mail: parikh.sameer@mayo.edu.

This feature is available to Subscribers Only
Sign In or Create an Account Close Modal