

Key Points
Unsupervised consensus clustering via machine-learning techniques uncovered 4 distinct biologically relevant genomic AML clusters.
Invariant cluster genomic signatures were extracted and integrated to build a validated genomic AML subclassification model of 97% accuracy.

Abstract
Although genomic alterations drive the pathogenesis of acute myeloid leukemia (AML), traditional classifications are largely based on morphology, and prototypic genetic founder lesions define only a small proportion of AML patients. The historical subdivision of primary/de novo AML and secondary AML has shown to variably correlate with genetic patterns. The combinatorial complexity and heterogeneity of AML genomic architecture may have thus far precluded genomic-based subclassification to identify distinct molecularly defined subtypes more reflective of shared pathogenesis. We integrated cytogenetic and gene sequencing data from a multicenter cohort of 6788 AML patients that were analyzed using standard and machine learning methods to generate a novel AML molecular subclassification with biologic correlates corresponding to underlying pathogenesis. Standard supervised analyses resulted in modest cross-validation accuracy when attempting to use molecular patterns to predict traditional pathomorphologic AML classifications. We performed unsupervised analysis by applying the Bayesian latent class method that identified 4 unique genomic clusters of distinct prognoses. Invariant genomic features driving each cluster were extracted and resulted in 97% cross-validation accuracy when used for genomic subclassification. Subclasses of AML defined by molecular signatures overlapped current pathomorphologic and clinically defined AML subtypes. We internally and externally validated our results and share an open-access molecular classification scheme for AML patients. Although the heterogeneity inherent in the genomic changes across nearly 7000 AML patients was too vast for traditional prediction methods, machine learning methods allowed for the definition of novel genomic AML subclasses, indicating that traditional pathomorphologic definitions may be less reflective of overlapping pathogenesis.
Introduction
Genetic mutations (somatic or germline), cytogenetic abnormalities, and their combinations contribute to the heterogeneity of acute myeloid leukemia (AML) phenotypes.1-3 Seminal studies have described the molecular landscape of AML and its exclusive framework and have stratified patients into prognostic subgroups.4-7 Moreover, serial sequencing studies have delineated a stepwise acquisition of subclonal mutations accompanying AML evolution.8 To date, prototypic founder lesions [eg, t(8;21), inv(16), and t(15;17)] define only a fraction of AML subgroups, with specific prognoses corresponding to molecular pathogenesis.9,10 Indeed, in a larger proportion of AML patients, somatic mutations or cytogenetic abnormalities potentially serve as driver lesions in combination with numerous acquired secondary hits.3 However, their combinatorial complexity hampers the resolution of distinct genomic classifications and overlaps across classical pathomorphologic AML subtypes, including de novo/primary (pAML) and secondary AML (sAML) evolving from an antecedent myeloid neoplasm.11,12 These AML subtypes are themselves nonspecific because of variation in the understanding of their pathogenetic links, especially in cases without overt dysplasia.13,14 Without dysplasia, reliance is mainly on anamnestic clinical information that might be unavailable or cannot be correctly assigned because of a short prodromal history of antecedent myeloid neoplasm. Additionally, supervised analytic strategies to reproduce current pathomorphologic entities as gold standard using molecular features have been modest. Here, we explored the potential use of distinct genomic markers, uncovered by advanced machine learning methods, to subclassify AML objectively and provide personalized prognostication, irrespective of clinicopathologic information; we propose this method as a new standard in AML assessment.
We analyzed integrated genomic data from pAML and sAML patients seen in our institution and multiple other centers over 2 decades using both standard supervised approaches and unsupervised machine learning methods that better captured the complex interactions of high-dimensional genomic features underlying AML subgroups. Machine learning was instrumental for the identification of novel AML subgroups with invariant driver genomic features.
Methods
Patients and cell samples
For the purpose of this study, we combined AML patient data from the Cleveland Clinic (CC; n = 855) and the Munich Leukemia Laboratory (n = 4002) with publicly available data sets (The Cancer Genome Atlas, the BEAT AML Master Trial, and the German-Austrian Study Group; n = 1931[ cases with unavailable cytogenetics were excluded])4-6 to form a large, well-annotated cohort of 6788 patients (supplemental Table 1). Targeted next-generation sequencing results at the time of AML diagnosis were adjusted to focus on the most recurrent somatic myeloid mutations (supplemental Table 2). Patients were followed until September 2019, with a median duration of 12.4 months. Peripheral blood and/or bone marrow samples were collected after receiving written informed consent according to protocols approved by the institutional review board at CC and other institutions in accordance with the Declaration of Helsinki. Clinical parameters were obtained from medical records after securing appropriate material transfer agreements and from resources accessible online.
Genetic studies
For the data collected at CC, whole-exome sequencing was performed on paired tumor and germline DNAs (purified CD3+ lymphocytes). Whole-exome capture was accomplished according to the SureSelect Human All Exon 50Mb or V4 Kit (Agilent Technologies), and captured targets were sequenced using a HiSeq 2000 (Illumina). Reads were aligned to the human genome (hg19) by a Burrows-Wheeler aligner (http://bio-bwa.sourceforge.net/). Data were validated using a TruSeq Custom Amplicon Kit (Illumina) with a panel of 44 genes (supplemental Table 2). Variants were annotated using Annovar and filtered, and a bioanalytic pipeline developed in house15-17 identified somatic mutations as specified in the data supplement. Variants in patients from the Munich Leukemia Laboratory cohort were called as previously reported.18-22 The gene sequencing methods of publicly shared AML patients were previously described.4-6
Statistical analyses
Multivariate Cox proportional hazards modeling was used to identify genomic abnormalities associated with survival in various AML cohorts. Uni- and multivariate logistic regression (MLR) analyses were performed to find distinct genomic features of pAML and sAML. We performed unsupervised analysis to cluster AML patients into genomic subgroups by latent variable modeling. More specifically, we used Bayesian latent class analysis (BLCA) coupled with resampling to generate a consensus matrix23 that was then hierarchically clustered using Ward’s criteria to obtain final patient cluster assignments. To validate the prognostic significance of identified clusters, we used survival analysis. To determine if AML subtype distributions differed across identified clusters, we normalized pAML and sAML samples to population proportions using the bootstrap method. To identify distinct genomic features and generate a subclassification model, we used random forest (RF) classification and extracted the variables with the highest global importance measured by mean decrease in accuracy. Additionally, we performed internal and external validation of our model. The RF subclassification model and cluster-specific survival estimates are available via a Web-based open-access resource.
Results
Molecular architecture determines disease risk and distinguishes AML subtypes
Using the World Health Organization 2016 diagnostic criteria,9 we classified 6788 AML patients as having core-binding factor AML (CBF-AML; n = 422), acute promyelocytic leukemia (APL; n = 312), KMT2A-rearranged AML (KMT2AR-AML; n = 371), pAML (n = 4502), sAML (n = 832), or therapy-related AML (tAML; n = 349). Patients’ baseline, clinical, and cytogenetic information are presented in Table 1. Mutational profiling identified 13 879 somatic mutations of variant allele frequency (VAF) ≥1% in the selected uniformed gene panel (supplemental Tables 2 and 3). Using multivariate Cox modeling, we identified specific genomic lesion associations with survival. This approach enabled feature partitioning into favorable vs adverse risks within diverse AML groups (supplemental Table 4). Because the role of recurrent balanced translocations in AML diagnostics and the prognosis of tAML are already well established, we focused our analyses on 5334 pAML and sAML cases without these pathognomonic lesions; thus, we excluded CBF-AML, APL, KMT2AR-AML, and tAML. Our objective was to determine if unique configurations of specific genetic lesions can produce distinguishable diagnostic patterns of pAML vs sAML or within AML subsets, including normal karyotype (NK-AML; n = 3176) and abnormal karyotype AML (AK-AML; n = 2158). This strategy was motivated by the observation of significantly different pAML vs sAML survival (Figure 1A-C). Indeed, the supervised analyses yielded distinct clinical (supplemental Table 5) and genomic features that characterized each subtype (Figure 1D). Patterns detected by univariate logistic regression and MLR included enrichment in mutations in CEBPA (both monoallelic and biallelic), DNMT3A, FLT3 internal tandem duplication (FLT3ITD), FLT3 tyrosine kinase domain, GATA2, IDH1, IDH2R140, NRAS, NPM1, and WT1 in pAML and a greater prevalence of mutations in ASXL1, RUNX1, SF3B1, SRSF2, and U2AF1; −5/del(5q); −7/del(7q); −17/del(17p); del(20q); +8; and complex karyotype in sAML (Figure 1D-F). Mutational burdens were similar in both AML subtypes (median, 2 mutations per individual; supplemental Figure 1). Analyses of NK-pAML vs NK-sAML (supplemental Figure 2) and AK-pAML vs AK-sAML (supplemental Figure 3) revealed significant genetic associations that characterized each subset. In addition, clonal hierarchy analyses differentiated pAML vs sAML based on founder and subclonal hits (Figure 1G). Despite these significant findings, the genomic profiles of pAML vs sAML identified by MLR resulted in only 0.74 cross-validation accuracy of predictive performance when used to reproduce pathomorphologic AML subtypes (Figure 1H).
Baseline, clinical, and cytogenetic characteristics of AML cohort by subtype
| Variable | CBF-AML | APL | KMT2AR-AML | pAML | sAML | tAML | All |
|---|---|---|---|---|---|---|---|
| Total population | 422 (6.2) | 312 (4.6) | 371 (5.5) | 4502 (66.3) | 832 (12.2) | 349 (5.2) | 6788 (100) |
| Median age (range), y* | 52 (18-86) | 51.8 (18-86) | 63.8 (18-87) | 66.9 (18-89) | 70 (21-89) | 67.3 (18-89) | 66.2 (18-89) |
| ≥60 | 103 (32.9) | 93 (34.9) | 165 (60.8) | 2374 (65.5) | 638 (81.3) | 183 (66.5) | 3556 (64.2) |
| Sex | |||||||
| Male | 239 (56.6) | 163 (52.2) | 199 (53.6) | 2373 (52.7) | 535 (64.4) | 142 (40.7) | 3651 (53.7) |
| Female | 183 (43.4) | 149 (47.8) | 172 (46.4) | 2129 (47.3) | 297 (35.6) | 207 (59.3) | 3137 (46.3) |
| Hematologic and BM parameters* | |||||||
| Median WBC (range), × 109/L | 15.5 (0.1-351) | 2.9 (0.3-155) | 15 (0.4-427) | 20.2 (0.1-600) | 5.3 (0.5-388) | 7.4 (0.5-303) | 14.7 (0.1-600) |
| <3 | 41 (10.4) | 136 (50.7) | 85 (22.9) | 874 (20.4) | 279 (36.6) | 94 (30.9) | 1509 (23.4) |
| Median hemoglobin (range), g/dL | 8.9 (2.5-19) | 9.8 (2.7-16.4) | 9.1 (3.5-18.5) | 9.2 (2.3-17.9) | 9.3 (5-16.5) | 9.4 (3.4-16) | 9.1 (2.3-19) |
| <10 | 277 (69.8) | 144 (52.7) | 209 (66.1) | 2479 (65.9) | 484 (66.3) | 188 (64.4) | 3781 (65.6) |
| Median platelets (range), × 109/L | 42 (3-529) | 30 (1-228) | 71 (2-578) | 73 (2-2366) | 50 (5-869) | 53 (5-570) | 54 (1-2366) |
| <100 | 356 (83.6) | 239 (87.5) | 221 (61.4) | 2663 (60.6) | 573 (76.5) | 222 (75) | 4274 (75.4) |
| Median BM blasts (range), % | 51 (20-99) | 76 (20-100) | 70 (20-100) | 61 (20-100) | 30 (20-97) | 60 (20-99) | 50 (20-100) |
| Antecedent diagnosis* | |||||||
| MDS | — | — | — | — | 627 (75.5) | — | 627 (9.2) |
| MDS/MPN | — | — | — | — | 58 (7) | — | 58 (0.8) |
| MPN | — | — | — | — | 39 (4.7) | — | 39 (0.6) |
| ELN risk stratification, % | |||||||
| Favorable | 422 (100) | 312 (100) | 0 (0) | 656 (15) | 25 (3) | 23 (7) | 1438 (21.2) |
| Intermediate | 0 (0) | 0 (0) | 0 (0) | 2166 (48) | 358 (43) | 189 (54) | 2713 (40) |
| Adverse | 0 (0) | 0 (0) | 371 (100) | 1680 (37) | 449 (54) | 137 (39) | 2637 (38.8) |
| Cytogenetics | |||||||
| Normal | — | — | 45 (12.1) | 2812 (62.5) | 364 (43.8) | 111 (31.8) | 3332 (49.1) |
| t(1;22) | 0 (0) | 0 (0) | 0 (0) | 3 (0.07) | 0 | 0 | 3 (0.04) |
| inv(3)/t(3;3) | 0 (0) | 0 (0) | 0 (0) | 61 (1.4) | 16 (1.9) | 3 (0.9) | 80 (1.2) |
| −5/del(5q) | 5 (1.2) | 2 (0.6) | 54 (14.5) | 288 (6.4) | 130 (15.6) | 40 (11.5) | 519 (7.6) |
| t(6;9) | 0 (0) | 0 (0) | 0 (0) | 24 (0.5) | 2 (0.2) | 1 (0.2) | 27 (0.04) |
| −6/del(6q) | 0 (0) | 2 (0.6) | 4 (1.1) | 21 (0.5) | 12 (1.4) | 9 (2.6) | 48 (0.7) |
| −7/del(7q) | 6 (1.4) | 3 (1.0) | 31 (8.3) | 298 (6.6) | 109 (13.1) | 54 (15.5) | 501 (7.4) |
| −9/del(9q) | 33 (7.8) | 4 (1.2) | 8 (2.1) | 82 (1.8) | 10 (1.2) | 6 (1.7) | 143 (2.1) |
| del(12p) | 1 (0.2) | 4 (1.3) | 16 (4.3) | 113 (2.6) | 18 (2.1) | 19 (5.4) | 171 (2.5) |
| del(13q) | 2 (0.5) | 2 (0.6) | 6 (1.6) | 35 (0.7) | 15 (1.8) | 8 (2.3) | 68 (1.0) |
| del(16q) | 1 (0.2) | 1 (0.3) | 2 (0.5) | 20 (0.4) | 4 (0.5) | 0 (0) | 28 (0.4) |
| −17/del(17p) | 1 (0.2) | 1 (0.3) | 18 (4.8) | 133 (3.0) | 45 (5.4) | 24 (6.9) | 222 (3.3) |
| del(20q) | 0 (0) | 0 (0) | 10 (2.7) | 67 (1.5) | 33 (3.9) | 9 (2.6) | 119 (1.8) |
| +8 | 35 (8.3) | 44 (14.1) | 82 (22.1) | 405 (9) | 117 (14.1) | 40 (11.5) | 723 (10.7) |
| −X | 27 (6.4) | 0 (0) | 0 (0) | 18 (0.4) | 8 (1.0) | 7 (2.0) | 60 (0.9) |
| −Y | 64 (15.2) | 2 (0.6) | 9 (2.4) | 79 (1.7) | 31 (3.7) | 9 (2.6) | 194 (2.9) |
| Complex | 38 (9) | 11 (3.5) | 93 (25.1) | 451 (10) | 164 (19.7) | 72 (20.6) | 829 (12.2) |
Data are presented as n (%) unless otherwise indicated.
BM, bone marrow; ELN, European LeukemiaNet; MDS, myelodysplastic syndrome; MPN, myeloproliferative neoplasm; WBC, white blood cell.
Some data were not available.
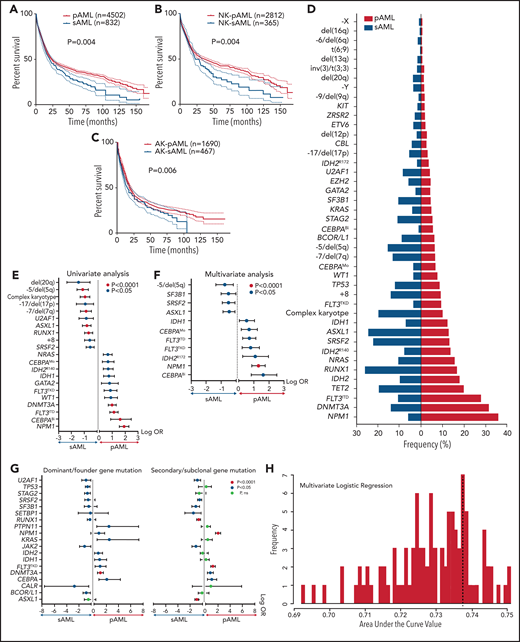
Survival outcomes and mutational landscape of pAML vs sAML. (A-C) Kaplan-Meier survival curves of pAML vs sAML (A), NK-pAML vs NK-sAML (B), and AK-pAML vs AK-sAML (C). (D) Bar graph showing the frequency (percentage) of somatic mutations in pAML vs sAML. (E-F) Forest plots representing univariate logistic regression and MLR analyses showing the odds ratio (OR; in log scale) of the association of somatic mutations in pAML vs sAML, respectively. (G) Forest plots representing univariate analyses showing the OR (in log scale) of the association of dominant/ancestral and secondary/subclonal somatic mutations in pAML vs sAML, respectively. Levels of statistical significance, indicated by green, orange, and black (P < .0001, P < .05, and P > .05, respectively), were obtained by Fisher’s exact test. (H) Bar graph showing the average predictive performance (∽0.74) of MLR using cross-validation area under the curve (ie, we correctly predicted pAML and sAML classification in ∼74% of AML cases in our cohort using the distinct genomic characteristics of each subtype). ns, not significant.
Survival outcomes and mutational landscape of pAML vs sAML. (A-C) Kaplan-Meier survival curves of pAML vs sAML (A), NK-pAML vs NK-sAML (B), and AK-pAML vs AK-sAML (C). (D) Bar graph showing the frequency (percentage) of somatic mutations in pAML vs sAML. (E-F) Forest plots representing univariate logistic regression and MLR analyses showing the odds ratio (OR; in log scale) of the association of somatic mutations in pAML vs sAML, respectively. (G) Forest plots representing univariate analyses showing the OR (in log scale) of the association of dominant/ancestral and secondary/subclonal somatic mutations in pAML vs sAML, respectively. Levels of statistical significance, indicated by green, orange, and black (P < .0001, P < .05, and P > .05, respectively), were obtained by Fisher’s exact test. (H) Bar graph showing the average predictive performance (∽0.74) of MLR using cross-validation area under the curve (ie, we correctly predicted pAML and sAML classification in ∼74% of AML cases in our cohort using the distinct genomic characteristics of each subtype). ns, not significant.
Unsupervised genomic analysis unveils novel molecular AML groups spanning sAML/pAML dichotomy
Because the accuracy of MLR prediction was modest, we explored other machine learning approaches as an alternative analytic strategy. BLCA of AML cases with complete mutational screens (n = 2681; supplemental Table 2) uncovered 4 novel genomic subgroups (Figure 2A) based on the highest silhouette value (supplemental Figures 4 and 5). The biologic relevance of these subgroups was reflected in significantly different survival among GC-1 (median, 34.1; 95% confidence interval [CI], 25.2-50.5 months), GC-2 (median, 26.5; 95% CI, 22.9-31.0 months), GC-3 (median, 15.8; 95% CI, 13.3-18.0 months), and GC-4 (median, 9.2; 95% CI, 7.4-11.6 months; Figure 2B; supplemental Figure 6), as well as survival probability (supplemental Table 6). Of note, the implementation of survival analyses was considered only to reflect the biologic and prognostic relevance of these clusters and not to replace current prognostic schemes. Moreover, the robustness of the BLCA clustering with respect to VAF was further validated when considering a higher cutoff of 15%, which also resulted in 4 GCs with a silhouette value of 0.86 and an adjusted Rand index of 0.84 (supplemental Figure 7A-B).
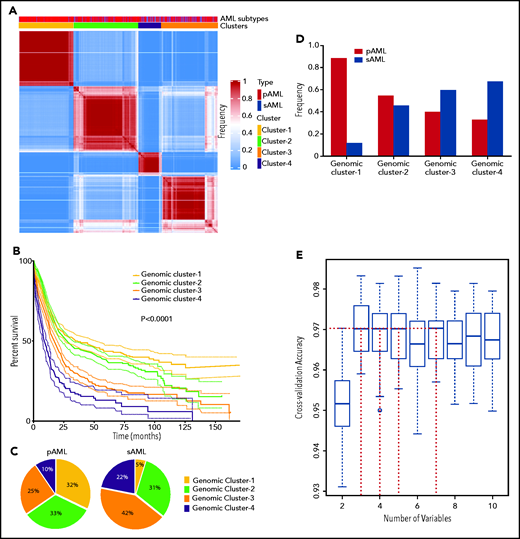
Novel genomic clusters (GCs) of AML identified by unsupervised analyses. (A) Consensus matrix generated by applying latent class analysis on 1000 subsamples representing the frequency of 2 observations being clustered in the same group. (B) Kaplan-Meier analysis showing the overall survival (OS; in months) of each GC (GC-1 to GC-4). (C) Pie charts showing the percentage of cases belonging to each GC (GC-1 to GC-4) in pAML (left) and sAML (right). (D) Bar graph showing the frequency of pAML and sAML in the GCs after normalizing the samples by bootstrapping. (E) Hyperparameter selection plot for RF modeling; cross-validation accuracy (CVA) is shown on the y-axis. CVA saturation in this plot indicates that 3 variables suffice to achieve the maximal accuracy of ∼0.97, (ie, this model correctly assigns prognosis for ∼97% of AML cases in our cohort using their corresponding genomic features).
Novel genomic clusters (GCs) of AML identified by unsupervised analyses. (A) Consensus matrix generated by applying latent class analysis on 1000 subsamples representing the frequency of 2 observations being clustered in the same group. (B) Kaplan-Meier analysis showing the overall survival (OS; in months) of each GC (GC-1 to GC-4). (C) Pie charts showing the percentage of cases belonging to each GC (GC-1 to GC-4) in pAML (left) and sAML (right). (D) Bar graph showing the frequency of pAML and sAML in the GCs after normalizing the samples by bootstrapping. (E) Hyperparameter selection plot for RF modeling; cross-validation accuracy (CVA) is shown on the y-axis. CVA saturation in this plot indicates that 3 variables suffice to achieve the maximal accuracy of ∼0.97, (ie, this model correctly assigns prognosis for ∼97% of AML cases in our cohort using their corresponding genomic features).
pAML and sAML composition within GCs
The distribution of GCs within pAML and sAML was variable (Figure 2C). For instance, pAML cases showed similar percentages of GC-1 (32%), GC-2 (33%), and GC-3 (25%) but fewer cases of GC-4 (10%). In contrast, sAML cases had higher percentages of GC-4 (22%) but lower GC-1 (5%) (Figure 2C). The few GC-1 sAML cases may be suggestive of a possible subtype misclassification on presentation or impact of an important genetic alteration (supplemental Table 7). Higher percentages of patients with good molecular prognosis were found among those with pAML (GC-1/2; 65%), whereas those with sAML had more higher-risk cases (GC-3/4; 66%). Results of reverse analysis of normalized frequencies of pAML and sAML within cluster groups were consistent with the aforementioned results (Figure 2D), showing increased pAML proportion in GC-1 (89% vs 11%) and sAML in GC-4 (67% vs 33%). In addition, survival analyses within the same prognostic group showed no significant difference between pAML and sAML cases except in GC-4 (supplemental Figure 8A-D; supplemental Figure 9 shows for P values of all pairwise comparisons of survival in our 8-cluster × pAML/sAML groups).
Invariant genomic features accurately predict molecular class assignments in AML
To link each cluster to its pathogenetic features, we generated an RF model. The resulting multiclass classifier yielded a cross-validation accuracy of 0.97 (Figure 2E). Globally, the most important genomic features of the model, quantified by mean decrease in accuracy, included mutations in NPM1, RUNX1, ASXL1, SRSF2, and TP53; −5/del(5q); DNMT3A mutations; −17/del(17p); BCOR/L1 mutations; and others (supplemental Figure 10). Comprehensive group-specific observations showed that GC-1 was characterized by the highest prevalence of NK-AML (88%) and full presence of NPM1 mutations (100%; 86% with VAF >20%) that cooccurred with DNMT3A (52%), FLT3ITD (27%; 91% with VAF <50%), and IDH2R140 mutations (16%; whereas IDH2R172 mutations were absent), with depletion or absence of ASXL1, EZH2, RUNX1, and TP53 mutations and complex cytogenetics (Figure 3A). GC-2 had a higher percentage of AK-AML cases than GC-1 and the highest frequency of CEBPA biallelic (9%) and IDH2R172K (4%), FLT3ITD (14%), and FLT3TKD mutations (6%) occurring without NPM1 mutations, whereas mutations in ASXL1, RUNX1, and TP53 were absent (Figure 3B). GC-3 had the highest frequency of ASXL1 (39%), BCOR/L1 (16%), and DNMT3A mutations without NPM1 mutation (19%), in addition to being highly enriched with EZH2 (9%), RUNX1 (52%), SF3B1 (7%), SRSF2 (38%), and U2AF1 mutations (12%; Figure 3C). Of note, GC-3 showed a higher degree of heterogeneity. In fact, 53 cases in GC-3 had a silhouette value <0, and of these, 15 cases were misclassified by the RF model. Further investigation of these misclassified cases showed that they were wild type for RUNX1, a GC-3–defining gene (supplemental Figure 11). Finally, GC-4 had the highest prevalence of AK-AML (96%; mostly of complex karyotype [76%]) and TP53 mutations (70%) that were associated with −5/del(5q) (68%), −7/del(7q) (35%), and −17/del(17p) (31%; Figure 3D). Signature patterns, their importance, and pairwise co-occurrence with other genomic markers, in addition to the clonal hierarchy of driver mutations in each cluster, are described in Figure 3B-E, supplemental Figure 12, and supplemental Figure 13A-D, respectively.
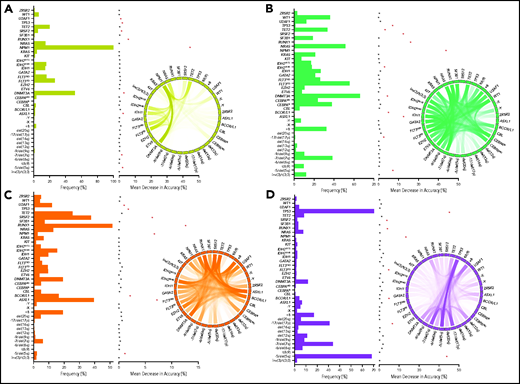
Invariant genomic features driving each genomic group. Bar plots representing the mutational profiles of GC-1 (A), GC-2 (B), GC-3 (C), and GC-4 (D) and their importance. Red asterisks represent the most important genomic features based on an arbitrary importance cutoff of a mean decrease in accuracy ≥0.01. In addition, circos diagrams showing the pairwise cooccurrence of mutations in all GCs are illustrated to the right of the bar graphs. The colors of circos diagrams correspond to the GCs. The percentage of a cooccurrence between first and second gene mutations is represented by the color intensity of the ribbon connecting both genes.
Invariant genomic features driving each genomic group. Bar plots representing the mutational profiles of GC-1 (A), GC-2 (B), GC-3 (C), and GC-4 (D) and their importance. Red asterisks represent the most important genomic features based on an arbitrary importance cutoff of a mean decrease in accuracy ≥0.01. In addition, circos diagrams showing the pairwise cooccurrence of mutations in all GCs are illustrated to the right of the bar graphs. The colors of circos diagrams correspond to the GCs. The percentage of a cooccurrence between first and second gene mutations is represented by the color intensity of the ribbon connecting both genes.
We also analyzed the percentages of novel groups among each genomic lesion population (supplemental Figures 14-16). GC-1 represented 97% of NPM1, 50% of FLT3ITD, 54% of DNMT3A, 43% of IDH1, and 43% of IDH2R140 mutations as well as 43% of NK-AML cases; GC-2 accounted for 91% of CEBPA biallelic, 46% of GATA2, and 50% of WT1 mutations; and GC-3 had 90% of ASXL1, 82% of BCOR/L1, 52% of CBL, 53% of ETV6, and 46% of IDH2R172K mutations. GC-3 also represented a majority of splicing factor mutations (48% of SF3B1, 86% of SRSF2, 70% of U2AF1, and 65% of ZRSR2 mutations), 98% of RUNX1 mutations, and the highest portion of del(20q) (65%) and trisomy 8 (49%). GC-4 represented 94% of TP53 mutations, 62% of complex cytogenetics, 92% of −5/del(5q), 100% of −6/del(6q), 88% of del(12p), 91% of del(16q), and 92% of −17/del(17p).
When the clinical and baseline characteristics of each group were studied (supplemental Table 8), GC-1/2 were found to comprise a significantly younger age population compared with GC-3/4 (median age, 61 vs 70 years; P < .0001; supplemental Figure 17). Moreover, lower numbers of white blood cells correlated with higher-risk disease (P < .0001; supplemental Figure 18), possibly because patients in GC-3/4 harbored more dysplastic features than those in GC-1/2, who had more a proliferative AML phenotype.
Finally, we revisited the previously excluded well-defined prognostic AML groups and applied BLCA, which demonstrated that APL, CBF-AML, and tAML constituted a single GC each, whereas 2 genomic groups were revealed in KMT2AR-AML (supplemental Figure 19A-B), including GC-A (OS, 20.3 months) and GC-B (median OS, 6.9 months) with distinct survival (supplemental Figure 19C). The most important genomic markers extracted by the RF model included TP53 mutations followed by −5/del(5q), −7/del(7q), and −17/del(17p) (supplemental Figure 19D). GC-2 KMT2AR-AML was characterized by the enriched presence of TP53 mutations (79%), −5/del(5q) (63%), −7/del(7q) (38%), +8 (38%), and −17/del(17p) (31%; supplemental Figure 19E), whereas GC-1 KMT2AR-AML had absence/depletion of the aforementioned genomic aberrations except for +8 (18%), in addition to frequent DNMT3A (20%) and NRAS mutations (16%; supplemental Figure 19E).
Automated cluster predictor and confirmatory studies
We performed internal and external validation of our genomic clustering model. The internal confirmatory cohorts consisted of randomly selected training (80%; n = 2144) and test sets (20%; n = 537). BLCA and RF classification were applied on the training set only, and survival analysis of the test set was performed separately (supplemental Figure 20A-B). The test cohort did not show significant survival differences per each GC compared with the training set when Kaplan-Meier analyses were performed (supplemental Figure 21A-D). We further evaluated how the number of the identified clusters varied across subsets of the training cohort by randomly sampling 75% of observations to prevent overfitting. Silhouette values across random samples showed 4 as the optimal number of clusters (supplemental Figure 22). External validation was then conducted using an independent cohort of 203 AML patients from the MD Anderson Cancer Center (MDACC; pAML, n = 143; sAML, n = 60), with a median follow-up of 12 (range, 0.1-35.3 months) and fully annotated characteristics (supplemental Table 9). Gene sequencing of the selected gene panel (supplemental Table 2) identified a total of 723 somatic mutations in the MDACC cases (supplemental Table 10). The Kaplan-Meier survival analyses of the original data and MDACC cases showed similar survival among each GC assigned by the RF model (Figure 4A-D). Details of additional validation approaches for hyperparameter tuning and depth selection in the RF model are provided in the data supplement.
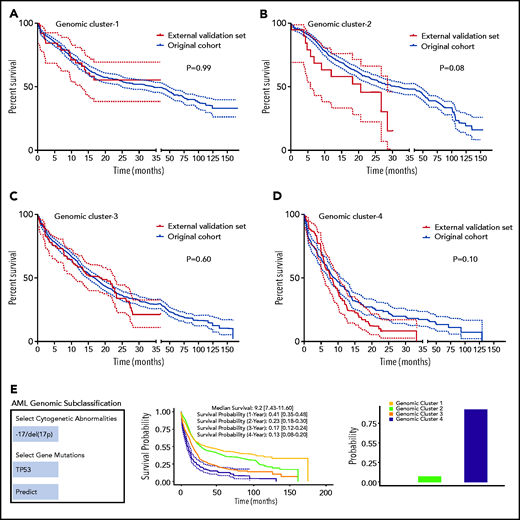
Model validation and uniform resource locator. (A-D) Kaplan-Meier survival analyses (time in months) for the external validation of the model using external data from the MD Anderson Cancer Center (MDACC) vs the original data for each cluster: GC-1 (A), GC-2 (B), GC-3 (C), and GC-4 (D). (E) Screenshot of the Web site interface to our model.
Model validation and uniform resource locator. (A-D) Kaplan-Meier survival analyses (time in months) for the external validation of the model using external data from the MD Anderson Cancer Center (MDACC) vs the original data for each cluster: GC-1 (A), GC-2 (B), GC-3 (C), and GC-4 (D). (E) Screenshot of the Web site interface to our model.
Furthermore, the 4 GCs greatly overlapped with the ELN 2017 risk groups (supplemental Figure 23). GC-1/2 mainly represented the favorable and intermediate groups, whereas GC-3/4 highly matched the adverse group. Interestingly, when OS of the GCs were compared within each ELN 2017 risk group, significant differences were observed (supplemental Figure 24).
Finally, our genomic subclassification model is available as a Web-based open-source resource that can be accessed widely by clinicians and the public to forecast the subclassification and estimated survival of AML patients without known pathognomonic lesions, balanced translocations, or tAML (https://drmz.shinyapps.io/local_app/; Figure 4E). A conceptual framework summarizing our overall approach is illustrated in supplemental Figure 25.
Discussion
Apart from certain well-defined AML subtypes (eg, CBF-AML, APL, and KMT2AR-AML), historically, AML patients have been subcategorized into subgroups defined by pathomorphologic features and broad anamnestic clinical criteria because of the inability to precisely infer the presence of an antecedent prodromal disease.11,24 Ubiquitous application of genomic diagnostics has provided opportunities for objective subclassification of AML, which, because of its mechanistic foundation, can direct discovery and application of molecularly targeted therapeutics and allow for tailored personalized risk stratification.10 Building on this potential and the power of modern genomic and bioanalytic approaches, we investigated whether rational genomic tools would yield precise, simple, and diagnostic AML subclasses reflective of genomic pathogenesis and prognosis. This is best illustrated by the ability of GCs to redefine historical subclasses such as pAML and sAML, which have been shown to correlate only variably with genetic patterns and pathogenesis.
By applying machine learning methods to an unprecedentedly large cohort of AML patients with detailed molecular annotations, we developed a new classification model. Credence in this model is fortified by its accurate classification (∼97% correct) and the plausibility of the distinctive genomic features that contributed to the overall assignment accuracy. The utility of this model is supported by different cluster group survival outcomes. Feature association with both pathobiology (molecular parameters) and survival suggests that this model could overcome some limitations of previous pathomorphologically based classifications of pAML and sAML.
Our results reaffirm previous studies4-6,11 and extend them by integrating more molecular features and expanding diagnostic and pathogenetic implications. In particular, we focused on the inclusion of genomic signatures, despite their variable degree of global importance, to achieve the highest possible genomic classification accuracy. For instance, and in line with previous reports,10,13,25-28NPM1 and TP53 mutations contributed greatly to creating the lower- and higher-risk phenotypes (corresponding to the clinical/survival risk), respectively. However, the highest cumulative accuracy was achieved only by the incorporation of the status (presence or absence) of additional genomic lesions, including RUNX1, ASXL1, SRSF2, and DNMT3A mutations; −5/del(5q); −17/del(17p); and others.
Our molecular 4-tiered model is not meant to challenge or replace previously established prognostic schemes. It mainly focuses on objectively subclassifying genomically undefined pathomorphologic AML subtypes, including pAML and sAML. However, because we compare it with traditional prognostication tools that incorporate prognostic genomic features, like ELN 2017, we would like to point out certain advantages that were concluded from our GC-based model. Our model expands a larger pool of genomic signatures and quantifies their corresponding importance. The latter is crucial when determining the probability of objective subclassification in complex heterogeneous AML cases harboring combined ELN 2017–defined favorable and adverse genomic lesions. The model describes distinct clustering of a variety of previously described genomic lesions that are known to influence AML outcome and emerged as AML cluster determinants. DNMT3A, IDH2R140, and TET2 mutations, only when occurring without NPM1 mutations, are important genomic determinants of GC-2. Splicing factor mutations (SRSF2 and U2AF1) contributed substantially to the performance of our model and were noticeably enriched in GC-3, indicating their predicted potential to be a distinct AML subgroup.11,22 Moreover, RUNX1 mutations had the second-highest global importance and crucially contributed to the identification of all novel groups. Specifically, RUNX1 mutations were highly prevalent in GC-3. Thus, our data confirm the substantial presence of RUNX1-mutant AML in the most recent World Health Organization classification as a provisional disease category.9,29 Interestingly, BCOR/L1 mutations emerged as a potential genomic marker of GC-3. Although complex karyotype AML was abundant in the poorest survival group as defined in ELN 2017, the concurrent presence of other important genomic markers identified by our model [−5/del(5q), −17/del(17p), and TP53 mutations] seemed to delineate its classification. When these aforementioned markers were absent, complex karyotype AML was also seen in other groups (GC-3). Therefore, our model argues that genomic subclassification of complex karyotype AML is strongly dependent on the present/absent status of other decisive correlating genomic markers. Finally, the model is dynamic and displays flexibility and personalization by accounting for accurate probabilities of assignment to each cluster per the presence/absence of each genomic feature and its interactions with other signatures, rather than predicting a single classification. It also defines the estimated survival interval of each genomic group, which can be considered when assessing prospective AML patients’ prognoses.
Because of the mechanistic focus, the deliberate exclusion of certain clinical data may appear as a limitation of our model. Although we believe that some of the phenotypic features are a result of genomic makeup and are likely codependent, we acknowledge that selected parameters may be later incorporated, similarly to the genomic features to be discovered in the future. The latter may, for example, include some of the germline alterations, clonal/subclonal burden, or configuration of hits as demonstrated for CEBPA biallelic mutations. Furthermore, some GCs showed a higher degree of heterogeneity compared with others, which can be likely improved by future incorporation of more complex models such as neural network–based clustering or the use of infinite priors in a Bayesian setting if a larger cohort is available. Also, as all of the patients receive therapy, new effective drugs could affect prognosis and thus may have a global subgroup-specific impact on survival, and the predictive value of survival curves within subgroups may have a limited shelf life. Although the predictive accuracy of our genomic model was validated and our approach accounted for a possible generalizability limitation by including multicenter cohorts, eventually prospective external validations of longer patient follow-up durations are still warranted. Additionally, we envision that molecularly based risk assessment may have a rational implication for the use of specific therapy choices, especially when targeted agents and their combinations become more widely applied and thus purely clinical classification schemes become obsolete to provide generalizable survival predictions.
In summary, our study demonstrates that despite the tremendous heterogeneity of AML genomics, nonrandom genomic relationships, captured by machine learning methods, are capable to accurately assign objective molecular classification and prognosis irrespective of the availability of clinicopathologic or anamnestic information. It clearly indicates that the classical distinction of sAML from pAML cannot be justified at molecular levels, and rather molecular signatures/patterns should provide a prevailing impetus for classification schemes. Our model provides a personalized genomic tool for AML subclassification that is publicly shared.
Acknowledgments
The authors thank The Cancer Genome Atlas, the BEAT AML Master Trial, and the German-Austrian Study Group for data accessibility.
This work was supported by National Heart, Lung, and Blood Institute, National Institutes of Health, grants R01HL118281, R01HL123904, R01HL132071, and R35HL135795 (J.P.M.), and by grants from the Edward P. Evans Foundation and the Henry and Marilyn Taub Foundation.
Authorship
Contribution: H.A. collected, analyzed, and interpreted the clinical and molecular data and wrote the manuscript; A.D. studied and analyzed the data, applied biostatistical methods, and wrote the manuscript; C.G, A.K., J.D., J. Shreve, and Y.N. edited and provided important feedback on the manuscript; C.M.K. performed and analyzed DNA sequencing data; M.M., T. Kuzmanovic, A.S.A., F.R., H.E.C., A.N, C.H., Y.S., H.K., T. Kadia, T.H., and M.A.S. provided patients and edited and added important insights to the manuscript; T.R., J. Scott, and V.V. provided important editing and wrote the manuscript; J.P.M. designed the study, conceptualized and sponsored the overall project, and wrote the manuscript; and all authors read and approved the final manuscript.
Conflict-of-interest disclosure: T.H. and C.H. are part owners of the Munich Leukemia Laboratory. M.M. is employed by the Munich Leukemia Laboratory. Y.S. is a consultant for and has equity and royalty rights with EpiDestiny. The remaining authors declare no competing financial interests.
Correspondence: Jaroslaw P. Maciejewski, Department of Translational Hematology and Oncology Research, Taussig Cancer Institute, Cleveland Clinic Foundation, 9620 Carnegie Ave, N Building, NE6-314, Cleveland, OH 44106; e-mail: maciejj@ccf.org.
Genomic data of the study participants can be shared upon request from the corresponding author, who can be reached by e-mail at maciejj@ccf.org; we deposited the code used to generate the results to github for open-source access (https://github.com/ardadurmaz/aml).
The online version of this article contains a data supplement.
There is a Blood Commentary on this article in this issue.
The publication costs of this article were defrayed in part by page charge payment. Therefore, and solely to indicate this fact, this article is hereby marked “advertisement” in accordance with 18 USC section 1734.

This feature is available to Subscribers Only
Sign In or Create an Account Close Modal