

Key Points
Young vs old BM macrophages differentially influence migration, adhesion, and proliferation of B-ALL cells and B-ALL progression.
The CXCR5-CXCL13 axis impacts B-ALL progression in mice and may be of prognostic and therapeutic significance in human B-ALL.

Abstract
B-cell acute lymphoblastic leukemia (B-ALL) occurs most commonly in children, whereas chronic myeloid leukemia is more frequent in adults. The myeloid bias of hematopoiesis in elderly individuals has been considered causative, but the age of the bone marrow microenvironment (BMM) may be contributory. Using various murine models of B-ALL in young vs old mice, we recapitulated B-ALL preponderance in children vs adults. We showed differential effects of young vs old BM macrophages on B-ALL cell function. Molecular profiling using RNA- and ATAC-sequencing revealed pronounced differences in young vs old BMM-derived macrophages and enrichment for gene sets associated with inflammation. In concordance with the role of C-X-C motif chemokine (CXCL) 13 for disease-associated B-cell chemoattraction, we found CXCL13 to be highly expressed in young macrophages on a translational compared with a transcriptional level. Inhibition of CXCL13 in BM macrophages impaired leukemia cell migration and decreased the proliferation of cocultured B-ALL cells, whereas recombinant CXCL13 increased pAKT and B-ALL cell expansion. Pretreatment of B-ALL–initiating cells with CXCL13 accelerated B-ALL progression. Deficiency of Cxcr5, the receptor for CXCL13, on B-ALL–initiating cells prolonged murine survival, whereas high expression of CXCR5 in pediatric B-ALL may predict central nervous system relapse. CXCL13 staining was increased in bone sections from pediatric compared with adult patients with B-ALL. Taken together, our study shows that the age of the BMM and, in particular, BM macrophages influence the leukemia phenotype. The CXCR5-CXCL13 axis may act as prognostic marker and an attractive novel target for the treatment of B-ALL.
Introduction
Twenty-five percent of cancers in children are due to B-cell acute lymphoblastic leukemia (B-ALL), the most common cancer in this age group.1 Enormous progress has been made in the treatment of this disease, although for some patients the disease, its relapse, or the sequelae of its treatment are still fatal. In addition, the incidence of pediatric B-ALL is increasing.1 Chronic myeloid leukemia (CML), in contrast, is rare in children, although all cases of CML and 3% of cases of pediatric B-ALL (and 25% of cases of adult B-ALL) are due to the same oncogene, the fusion gene BCR-ABL1. BCR-ABL1 confers a poor prognosis to patients with B-ALL.2 The difference in incidence of B-ALL and CML in children vs adults has been explained by an increased expression of genes involved in myeloid lineage specification and an increased potential of myeloid differentiation in hematopoietic stem cells of aged individuals.3,4 However, other factors, such as the bone marrow microenvironment (BMM), contributing to the predominantly lymphoid leukemic phenotype in children have not been studied in detail.
The BMM is a complex arrangement of various cell types and other factors influencing hematopoietic stem and progenitor cells and leukemia stem cells (LSCs).5 LSCs are protected by this BMM to prevent therapy-induced apoptosis.5-7 The BMM has been shown to influence the phenotype of leukemia,8 and leukemias remodel the leukemic niche.9-11 The leukemic BMM can be targeted, leading to a reduction of LSCs.12,13 Our knowledge about the influence of an aging microenvironment on hematopoiesis and leukemia is basically restricted to the findings that an old BMM provides a selection pressure on certain hematopoietic clones, contributing to leukemia development,14 and that old mice transplanted with leukemia-initiating cells (LICs) positive for the oncogene AML1-ETO have greater expansion of preleukemic stem and myeloid progenitor cells than young mice.15 We hypothesized that a young vs an old BMM may specifically promote the development and progression of B-ALL, possibly via the secretion of soluble factors.
In summary, we have shown that similar to the situation in humans, B-ALL development is more efficient in young mice. We observed differences of B-ALL cell behavior in a young vs an old BMM and implicated the B-cell chemoattractant C-X-C motif chemokine (CXCL) 13 secreted by macrophages and bound by its receptor, C-X-C chemokine receptor type 5 (CXCR5), as contributing to the leukemic phenotype in murine models of B-ALL. In human B-ALL of the hyperdiploid subtype, low expression of CXCR5 may act as an additional factor of favorable prognosis, whereas high expression of CXCR5 may be associated with central nervous system (CNS) relapse. The CXCL13-CXCR5 axis may act as a novel target for treatment in human B-ALL.
Methods
BM transduction and transplantation
For B-ALL induction, non–5-fluorouracil (5-FU)-treated BM cells, transduced once with MSCV-IRES green fluorescent protein (GFP) BCR-ABL1 retrovirus, were transplanted into unirradiated young vs old recipients at a dose of 2 × 10⁶ cells (supplemental Methods available on the Blood Web site.)
Statistical methods
Survival differences were assessed by Kaplan-Meier (log-rank) test.
Results
Differential efficiency of B-ALL induction in a young vs old BMM
Hypothesizing that induction of B-ALL in a young BMM may be more efficient than in an old BMM, we transplanted non–5-FU–pretreated BM from 6-week-old mice, transduced once with BCR-ABL1–expressing retrovirus in the murine transduction/transplantation model of B-ALL16 into young (3-4 weeks old) vs old (>1.5 years old) unirradiated recipient mice. This approach revealed a significantly higher number of leukocytes (P = .01; Figure 1A) and BCR-ABL1+ BP-1+ (pre-B) cells (Figure 1B-C; supplemental Figure 1A; supplemental Table 1), higher spleen weights (P = .03; Figure 1D), and a shortening of survival (P = .02; Figure 1E) in young compared with old BALB/c and C57/BL6 (P = .04; Figure 1F) mice. This finding was independent of weight differences between young and old mice because 50% reduction of the transplanted LIC dose also led to increased tumor burden (P = .03; Figure 1G) and accelerated B-ALL progression (P = .01; Figure 1H) in young mice.
![The efficiency of induction of B-ALL in young vs old BMM differs. (A) White blood cell (WBC) count × 103/μL in the peripheral blood of young (red) or old (blue) nonirradiated BALB/c recipient mice on day 13 of transplantation of 2 × 10⁶ BCR-ABL1–transduced BM in the B-ALL model (P = .01; Student t test, n = 7-9). (B) Percentage of GFP+ (BCR-ABL1+) BP-1+ cells in peripheral blood of young (red) or old (blue) nonirradiated BALB/c recipient mice on day 13 of transplantation of B-ALL–initiating cells, as in panel A (P = .03; Student t test, n = 7). (C) Percentage of GFP+ (BCR-ABL1+) BP-1+ cells in peripheral blood of young (red) or old (blue) nonirradiated BALB/c recipient mice on days 13 and 19 of transplantation, as in panel A (P = .008; Student t test, n = 3). A stable or decreasing tumor load in peripheral blood due to migration of leukemia cells to lymphatic tissue has been described17 and is not unusual (unpublished data, D.S.K.). (D) Spleen weights of young (red) vs old (blue) nonirradiated BALB/c recipient mice on day 18 of transplantation of BCR-ABL1–transduced BM in the B-ALL model. The spleen weight is presented as organ weight (g) normalized by mouse body weight (g) (P = .03; Student t test, n = 7). Kaplan-Meier–style survival curves for young (red) or old (blue) BALB/c (E) and C57BL/6J (F) nonirradiated recipients of 2 × 10⁶ non–5-FU–pretreated BCR-ABL1–transduced BM cells in the retroviral transduction/transplantation model of B-ALL. The differences in survival were statistically significant (P = .02; log-rank test, n = 18-19; and P = .04; log-rank test, n = 7-8, respectively). Percentage of GFP+ (BCR-ABL1+) BP-1+ cells in peripheral blood on day 13 after transplantation (P = .03; Student t test, n = 7) (G) and Kaplan-Meier–style survival curve (P = .01; log-rank test, n = 7) (H) of young (red) or old (blue) nonirradiated BALB/c recipient mice transplanted with 1 × 10⁶ (young) or 2 × 10⁶ (old) B-ALL–initiating cells. The young mice had an average weight of 15 g and the old mice of 30 g. (I-J) Percentage of human CD45+ leukocytes in the peripheral blood of young vs old nonobese diabetic severe combined immunodeficiency interleukin-2 receptor γ knockout mice transplanted with 2 × 10⁶ human B-ALL cells on day 34 after transplantation (P = .007; Student t test, n = 9-10) (I) and over time (days 19 and 34 after transplantation) (J). Individual patients in panel I are indicated in distinct colors. (K) Kaplan-Meier–style survival curves for young (red) or old (blue) nonobese diabetic severe combined immunodeficiency interleukin-2 receptor γ knockout mice transplanted with 2 × 10⁶ human B-ALL cells (P = .04; log-rank test, n = 9-10). (L) Percentage of GFP+ (BCR-ABL1+) BP-1+ cells in the peripheral blood (PB), BM, spleen, and liver of young (red) or old (blue) nonirradiated BALB/c recipient mice transplanted with BCR-ABL1–transduced BM on day 18 after transplantation (P values as indicated; Student t test, n = 6-8). (M) Percentage of GFP+ (BCR-ABL1+) BP-1+ cells of total BM cells that homed to the BM (P = .008; Student t test) and spleen (not significant [n.s.]; Student t test) of young (red) vs old (blue) nonirradiated BALB/c recipient mice 18 hours after transplantation (n = 3) in the B-ALL model; 5 × 10⁶ BCR-ABL1–transduced BM cells had been transplanted.](https://ash.silverchair-cdn.com/ash/content_public/journal/blood/138/19/10.1182_blood.2021011557/4/m_bloodbld2021011557f1.png?Expires=1770148431&Signature=WMLZh3RrFXNl0cRVv1ujcosP8xDcnUpsGp8yO-8o6-vzEe96YA1K~8hxppm1dhXWkBSOSQTuErIbZPWPuUzdpe5Tx-OExKXKcUK1TABD2Wab3yKDT9W2OwI2jaRcPBU-2wHlmk6Svp94Qdads5tREzz3OmlbRh7bBmqOwr5Py7BSEsgBiYqTUu58tyVvhOVUwSVFvXdAI2IVJIVAk6I--R--1Lv4xDMnNGChPYrQAM5VbtscxBMZCXPHnv0VJPjbvXfU77AhbQ0xJAkKOE0AX4KGyV~s2rLg4KpjesAbPQ1cdrvJng6JhijC30B56kIxIIIbECPqNC4uANZxeHUKaA__&Key-Pair-Id=APKAIE5G5CRDK6RD3PGA)
The efficiency of induction of B-ALL in young vs old BMM differs. (A) White blood cell (WBC) count × 103/μL in the peripheral blood of young (red) or old (blue) nonirradiated BALB/c recipient mice on day 13 of transplantation of 2 × 10⁶ BCR-ABL1–transduced BM in the B-ALL model (P = .01; Student t test, n = 7-9). (B) Percentage of GFP+ (BCR-ABL1+) BP-1+ cells in peripheral blood of young (red) or old (blue) nonirradiated BALB/c recipient mice on day 13 of transplantation of B-ALL–initiating cells, as in panel A (P = .03; Student t test, n = 7). (C) Percentage of GFP+ (BCR-ABL1+) BP-1+ cells in peripheral blood of young (red) or old (blue) nonirradiated BALB/c recipient mice on days 13 and 19 of transplantation, as in panel A (P = .008; Student t test, n = 3). A stable or decreasing tumor load in peripheral blood due to migration of leukemia cells to lymphatic tissue has been described17 and is not unusual (unpublished data, D.S.K.). (D) Spleen weights of young (red) vs old (blue) nonirradiated BALB/c recipient mice on day 18 of transplantation of BCR-ABL1–transduced BM in the B-ALL model. The spleen weight is presented as organ weight (g) normalized by mouse body weight (g) (P = .03; Student t test, n = 7). Kaplan-Meier–style survival curves for young (red) or old (blue) BALB/c (E) and C57BL/6J (F) nonirradiated recipients of 2 × 10⁶ non–5-FU–pretreated BCR-ABL1–transduced BM cells in the retroviral transduction/transplantation model of B-ALL. The differences in survival were statistically significant (P = .02; log-rank test, n = 18-19; and P = .04; log-rank test, n = 7-8, respectively). Percentage of GFP+ (BCR-ABL1+) BP-1+ cells in peripheral blood on day 13 after transplantation (P = .03; Student t test, n = 7) (G) and Kaplan-Meier–style survival curve (P = .01; log-rank test, n = 7) (H) of young (red) or old (blue) nonirradiated BALB/c recipient mice transplanted with 1 × 10⁶ (young) or 2 × 10⁶ (old) B-ALL–initiating cells. The young mice had an average weight of 15 g and the old mice of 30 g. (I-J) Percentage of human CD45+ leukocytes in the peripheral blood of young vs old nonobese diabetic severe combined immunodeficiency interleukin-2 receptor γ knockout mice transplanted with 2 × 10⁶ human B-ALL cells on day 34 after transplantation (P = .007; Student t test, n = 9-10) (I) and over time (days 19 and 34 after transplantation) (J). Individual patients in panel I are indicated in distinct colors. (K) Kaplan-Meier–style survival curves for young (red) or old (blue) nonobese diabetic severe combined immunodeficiency interleukin-2 receptor γ knockout mice transplanted with 2 × 10⁶ human B-ALL cells (P = .04; log-rank test, n = 9-10). (L) Percentage of GFP+ (BCR-ABL1+) BP-1+ cells in the peripheral blood (PB), BM, spleen, and liver of young (red) or old (blue) nonirradiated BALB/c recipient mice transplanted with BCR-ABL1–transduced BM on day 18 after transplantation (P values as indicated; Student t test, n = 6-8). (M) Percentage of GFP+ (BCR-ABL1+) BP-1+ cells of total BM cells that homed to the BM (P = .008; Student t test) and spleen (not significant [n.s.]; Student t test) of young (red) vs old (blue) nonirradiated BALB/c recipient mice 18 hours after transplantation (n = 3) in the B-ALL model; 5 × 10⁶ BCR-ABL1–transduced BM cells had been transplanted.
The efficiency of induction of B-ALL in young vs old BMM differs. (A) White blood cell (WBC) count × 103/μL in the peripheral blood of young (red) or old (blue) nonirradiated BALB/c recipient mice on day 13 of transplantation of 2 × 10⁶ BCR-ABL1–transduced BM in the B-ALL model (P = .01; Student t test, n = 7-9). (B) Percentage of GFP+ (BCR-ABL1+) BP-1+ cells in peripheral blood of young (red) or old (blue) nonirradiated BALB/c recipient mice on day 13 of transplantation of B-ALL–initiating cells, as in panel A (P = .03; Student t test, n = 7). (C) Percentage of GFP+ (BCR-ABL1+) BP-1+ cells in peripheral blood of young (red) or old (blue) nonirradiated BALB/c recipient mice on days 13 and 19 of transplantation, as in panel A (P = .008; Student t test, n = 3). A stable or decreasing tumor load in peripheral blood due to migration of leukemia cells to lymphatic tissue has been described17 and is not unusual (unpublished data, D.S.K.). (D) Spleen weights of young (red) vs old (blue) nonirradiated BALB/c recipient mice on day 18 of transplantation of BCR-ABL1–transduced BM in the B-ALL model. The spleen weight is presented as organ weight (g) normalized by mouse body weight (g) (P = .03; Student t test, n = 7). Kaplan-Meier–style survival curves for young (red) or old (blue) BALB/c (E) and C57BL/6J (F) nonirradiated recipients of 2 × 10⁶ non–5-FU–pretreated BCR-ABL1–transduced BM cells in the retroviral transduction/transplantation model of B-ALL. The differences in survival were statistically significant (P = .02; log-rank test, n = 18-19; and P = .04; log-rank test, n = 7-8, respectively). Percentage of GFP+ (BCR-ABL1+) BP-1+ cells in peripheral blood on day 13 after transplantation (P = .03; Student t test, n = 7) (G) and Kaplan-Meier–style survival curve (P = .01; log-rank test, n = 7) (H) of young (red) or old (blue) nonirradiated BALB/c recipient mice transplanted with 1 × 10⁶ (young) or 2 × 10⁶ (old) B-ALL–initiating cells. The young mice had an average weight of 15 g and the old mice of 30 g. (I-J) Percentage of human CD45+ leukocytes in the peripheral blood of young vs old nonobese diabetic severe combined immunodeficiency interleukin-2 receptor γ knockout mice transplanted with 2 × 10⁶ human B-ALL cells on day 34 after transplantation (P = .007; Student t test, n = 9-10) (I) and over time (days 19 and 34 after transplantation) (J). Individual patients in panel I are indicated in distinct colors. (K) Kaplan-Meier–style survival curves for young (red) or old (blue) nonobese diabetic severe combined immunodeficiency interleukin-2 receptor γ knockout mice transplanted with 2 × 10⁶ human B-ALL cells (P = .04; log-rank test, n = 9-10). (L) Percentage of GFP+ (BCR-ABL1+) BP-1+ cells in the peripheral blood (PB), BM, spleen, and liver of young (red) or old (blue) nonirradiated BALB/c recipient mice transplanted with BCR-ABL1–transduced BM on day 18 after transplantation (P values as indicated; Student t test, n = 6-8). (M) Percentage of GFP+ (BCR-ABL1+) BP-1+ cells of total BM cells that homed to the BM (P = .008; Student t test) and spleen (not significant [n.s.]; Student t test) of young (red) vs old (blue) nonirradiated BALB/c recipient mice 18 hours after transplantation (n = 3) in the B-ALL model; 5 × 10⁶ BCR-ABL1–transduced BM cells had been transplanted.
Similarly, transplantation of human B-ALL cells in pairs into irradiated (200 cGy) nonobese diabetic severe combined immunodeficiency interleukin-2 receptor γ mice led to significantly higher engraftment of human CD45+ leukocytes in young mice (Figure 1I-J; supplemental Figure 1B; supplemental Table 2), and their survival was significantly shortened (P = .04; Figure 1K). In the retroviral model, there was significant reduction of GFP+ (BCR-ABL1+) BP-1+ cells in several organs of young moribund mice (Figure 1L; supplemental Figure 1C). The percentage, but not absolute numbers of GFP+ (BCR-ABL1+) BP-1+ cells, that homed to a young BMM was higher compared with an old BMM (P = .008; Figure 1M; supplemental Figure 1D). In contrast, transplantation of BCR-ABL1–transduced 5-FU–pretreated BM into young vs aged recipients in the retroviral model of CML (in which recipients have to be irradiated) (supplemental Figure 2A), led to no differences in tumor load (supplemental Figure 2B) but a significant prolongation of survival in young compared with aged mice (P = .016; supplemental Figure 2C). As has frequently been reported for inefficient induction of CML in this model,13,17 the BM cavity of young mice with CML was mostly filled with amorphous eosinophilic material and infiltrating monocytes/macrophages, with the latter being the cause of death.13 Histopathological characteristics of CML were found in aged recipient mice (supplemental Figure 2D). No differences in homing of GFP+ (BCR-ABL1+) CML LICs18 to a young vs an aged BMM were observed (supplemental Figure 2D; supplemental Table 1). Further, a higher number of proviral clones, representing LICs,16 engrafted in spleens of aged compared with young recipients (P = .0004; supplemental Figure 2F-G). More myeloid colonies were found when the plated BM was derived from an aged compared with a young BM (P = .0009; supplemental Figure 2H). In summary, these results suggest that a young BMM is more supportive to the engraftment and maintenance of B-ALL LICs compared with an old BMM, whereas an aged BMM may be more conducive to the progression of CML. These findings suggest the importance of the BMM, in addition to LIC intrinsic factors, for the leukemic phenotype.
Location and behavior of B-ALL–initiating cells differ in a young vs an old BMM
Because location of LICs in the BMM may correlate with disease aggressivity and progression,19 we tested by in vivo microscopy of the murine calvarium20 whether the location and behavior of murine BCR-ABL1+ BP-1+ B-ALL LICs17 may differ between a young and old BMM (Figure 2A). Indeed, B-ALL LICs, but not normal lineage-negative cells, injected into young mice homed to locations closer to the endosteum (P = .0007; Figure 2B-C; supplemental Movies 1 and 2). Further, the speed of movement (P = .017; Figure 2D) of injected B-ALL LICs was increased, and their migration may be less random (supplemental Figure 3) in a young compared with an old BMM. Taken together, these data suggest that location and migration of B-ALL–initiating cells may differ between a young and an old BMM. Proximity to the endosteum, higher speed, and less random movement may be indicative of specific responses of LICs to factors in a young rather than old BMM and may influence disease outcome.
![Location and behavior of B-ALL–initiating cells differ in a young vs old BMM. (A) Schematic of the imaging experiments with 2-photon in vivo microscopy. (B) Representative two-photon in vivo microscopy image of the bone marrow (BM) calvarium of nonirradiated BALB/c mice injected with sorted BCR-ABL1+ (GFP+) BP-1+ B-ALL cells from BALB/c mice with established disease labeled with 5-(and-6)-(((4-chloromethyl)benzoyl)amino) tetramethylrhodamine (CMTMR) (red) in relation to the endosteum. Bones were visualized in blue due to second harmonic generation, and vessels were visualized in green via the injection of dextran-FITC (1 mg per injection). Scale bar, 50 µm. A schematic of how the calculations are performed using the Pythagorean theorem is shown on the right. (C) Distance of sorted BCR-ABL1+ BP-1+ B-ALL cells (P = .0007; 1-way analysis of variance [ANOVA], Tukey test) or MACS-depleted Lin− cells (n.s., 1-way ANOVA, Tukey test) as random cells to endosteum, as measured by in vivo microscopy of the murine calvarium, in young (red) vs old (blue) mice. Each mouse had been injected with a total of 5 × 10⁵ cells, and in vivo imaging was performed 2 to 3 hours after injection. The distances in micrometers were normalized for each mouse by dividing distances by the surface area of the skull to take into account differences in body size between young and old mice (n = 3). Ten cells per transplanted and imaged mouse were evaluated. Each dot represents an individual cell. (D) Speed (μm/s) of sorted GFP+ (BCR-ABL1+) BP-1+ B-ALL cells from BALB/c mice with established disease labeled with CMTMR and injected into young (red) or old (blue) nonirradiated BALB/c mice (P = .017; Student t test, n = 3). Movies of cells of interest were recorded at 1 frame per second using ImageJ.](https://ash.silverchair-cdn.com/ash/content_public/journal/blood/138/19/10.1182_blood.2021011557/4/m_bloodbld2021011557f2.png?Expires=1770148431&Signature=Yu-5uTf87VVgIuBgLgUfwYxGebrBsi3XoodKK-RTUOokCZzdOA5CY~Z7mdCr2GOz-Tlz6FDcIVn~ebpWKsOIUnsvXc5updgsUAJYhyJyY5xryOBpPVJdZSWeyDNyYtAnqaNk53KvQOpxb6lD2iKVVpla~00GLMplXfk0PkTw73P00~gcTedLy7osVVDdfI6GtSouRNgdRi6kWzedE47ziGGWDSYor40LBoh7y3w0NP1devi85BIgzH73qt~4kZc5UqieB5BLwki6DR-O-QE13oWyIeD-~jSroP7calUp7dSTOwBE71dgjxwWAPCaV1~ZzcMrsse~OECGHFWe3SY7JA__&Key-Pair-Id=APKAIE5G5CRDK6RD3PGA)
Location and behavior of B-ALL–initiating cells differ in a young vs old BMM. (A) Schematic of the imaging experiments with 2-photon in vivo microscopy. (B) Representative two-photon in vivo microscopy image of the bone marrow (BM) calvarium of nonirradiated BALB/c mice injected with sorted BCR-ABL1+ (GFP+) BP-1+ B-ALL cells from BALB/c mice with established disease labeled with 5-(and-6)-(((4-chloromethyl)benzoyl)amino) tetramethylrhodamine (CMTMR) (red) in relation to the endosteum. Bones were visualized in blue due to second harmonic generation, and vessels were visualized in green via the injection of dextran-FITC (1 mg per injection). Scale bar, 50 µm. A schematic of how the calculations are performed using the Pythagorean theorem is shown on the right. (C) Distance of sorted BCR-ABL1+ BP-1+ B-ALL cells (P = .0007; 1-way analysis of variance [ANOVA], Tukey test) or MACS-depleted Lin− cells (n.s., 1-way ANOVA, Tukey test) as random cells to endosteum, as measured by in vivo microscopy of the murine calvarium, in young (red) vs old (blue) mice. Each mouse had been injected with a total of 5 × 10⁵ cells, and in vivo imaging was performed 2 to 3 hours after injection. The distances in micrometers were normalized for each mouse by dividing distances by the surface area of the skull to take into account differences in body size between young and old mice (n = 3). Ten cells per transplanted and imaged mouse were evaluated. Each dot represents an individual cell. (D) Speed (μm/s) of sorted GFP+ (BCR-ABL1+) BP-1+ B-ALL cells from BALB/c mice with established disease labeled with CMTMR and injected into young (red) or old (blue) nonirradiated BALB/c mice (P = .017; Student t test, n = 3). Movies of cells of interest were recorded at 1 frame per second using ImageJ.
Location and behavior of B-ALL–initiating cells differ in a young vs old BMM. (A) Schematic of the imaging experiments with 2-photon in vivo microscopy. (B) Representative two-photon in vivo microscopy image of the bone marrow (BM) calvarium of nonirradiated BALB/c mice injected with sorted BCR-ABL1+ (GFP+) BP-1+ B-ALL cells from BALB/c mice with established disease labeled with 5-(and-6)-(((4-chloromethyl)benzoyl)amino) tetramethylrhodamine (CMTMR) (red) in relation to the endosteum. Bones were visualized in blue due to second harmonic generation, and vessels were visualized in green via the injection of dextran-FITC (1 mg per injection). Scale bar, 50 µm. A schematic of how the calculations are performed using the Pythagorean theorem is shown on the right. (C) Distance of sorted BCR-ABL1+ BP-1+ B-ALL cells (P = .0007; 1-way analysis of variance [ANOVA], Tukey test) or MACS-depleted Lin− cells (n.s., 1-way ANOVA, Tukey test) as random cells to endosteum, as measured by in vivo microscopy of the murine calvarium, in young (red) vs old (blue) mice. Each mouse had been injected with a total of 5 × 10⁵ cells, and in vivo imaging was performed 2 to 3 hours after injection. The distances in micrometers were normalized for each mouse by dividing distances by the surface area of the skull to take into account differences in body size between young and old mice (n = 3). Ten cells per transplanted and imaged mouse were evaluated. Each dot represents an individual cell. (D) Speed (μm/s) of sorted GFP+ (BCR-ABL1+) BP-1+ B-ALL cells from BALB/c mice with established disease labeled with CMTMR and injected into young (red) or old (blue) nonirradiated BALB/c mice (P = .017; Student t test, n = 3). Movies of cells of interest were recorded at 1 frame per second using ImageJ.
BCR-ABL1+ lymphoid cells differentially interact with macrophages from a young vs an old BMM
Monocytes play an important role in the B-ALL microenvironment,21 and monocyte/macrophage depletion in B-ALL,21 T-cell ALL,22 and chronic lymphocytic leukemia23 leads to a reduction of leukemia burden and survival prolongation. To test the role of monocytes/macrophages for the support of B-ALL, we obtained this population via its adherence to plastic (supplemental Figure 4A).24,25 Detailed immunophenotyping of these cells,26,27 henceforth termed macrophages, was F4/80+ CD169+ CX3CR1− with little contamination by dendritic cells, monocytes, and neutrophils (supplemental Figure 4B-C), whose percentages in the BM did not differ (except for neutrophils) (supplemental Figure 4D-F). Testing whether macrophages from young vs old mice play a differential role in B-ALL, we showed that numbers of sorted GFP+ (BCR-ABL1+) BP-1+ cells from mice with leukemia (P < .0001; Figure 3A) or BCR-ABL1− but not empty vector-transduced BA/F3 cells (supplemental Figure 5A), a pro-B lymphoid cell line, were significantly higher when plated on young compared with old macrophages. No differences in growth, however, were observed when the myeloid cell line 32D, transduced with empty vector or BCR-ABL1, was plated on young vs old macrophages (supplemental Figure 5B). Plating of BCR-ABL1+ BA/F3 cells on macrophages from mice of increasing ages led to a gradual decline of BCR-ABL1+ BA/F3 growth (Figure 3B). Plating of sorted BCR-ABL1+ BP-1+ cells from young or old mice with established B-ALL on young or old macrophages demonstrated an augmentation of the growth of BCR-ABL1+ BP-1+ cells from an old BMM plated on young macrophages (P = .001; Figure 3C). The increase in B cells was at least partly due to a significant increase in the proportion of cells in the (S)-G2-M fraction of the cell cycle, when primary B-ALL–initiating (P = .003; Figure 3D) or BCR-ABL1+ BA/F3 (P = .0008; supplemental Figure 5C) cells were plated on young compared with old macrophages. BCR-ABL1+ BA/F3 (P = .02; supplemental Figure 5D) (but not primary B-ALL–initiating) (Figure 3E) cells adhered significantly better to young macrophages, whereas BCR-ABL1+ 32D cells adhered better to old macrophages (P = .007; supplemental Figure 5E). The migration of primary B-ALL–initiating (P = .01; Figure 3F) and BCR-ABL1+ BA/F3 (P = .02 and P = .03; supplemental Figure 5F) cells was enhanced toward young compared with old macrophages. Suspecting that cytokines differentially secreted by young vs old macrophages may be responsible, we cultured B-ALL cells in conditioned medium (CM) from young vs old macrophages. This approach revealed greater proliferation of primary BCR-ABL1+ BP-1+ (P < .0001; Figure 3G) and BCR-ABL1+ BA/F3 (P = .05; supplemental Figure 5G) cells when cultured in the CM of young macrophages. Further, culture of primary B-ALL LICs from old mice in CM from young macrophages rescued the decreased proliferation observed when the cells were cultured in CM from old macrophages (P < .007; Figure 3H). Taken together, these results suggest that the age of BM macrophages and/or their soluble, secreted factors influence the proliferation, cell cycle, and migration of leukemia cells, although an influence of cell-cell contact or leukemia cell–intrinsic factors cannot be excluded.
![Young vs old BM macrophages interact differently with leukemia cells. (A) Number of primary GFP+ (BCR-ABL1+) BP-1+ cells plated on macrophages from young (red) vs old (blue) mice (n = 6); 2 × 10⁴ GFP+ (BCR-ABL1+) BP-1+ cells had been plated. The P values are as indicated (1-way ANOVA, Tukey test). (B) Number of BCR-ABL1+ BA/F3 cells plated on macrophages from mice of increasing ages (3-16 weeks) (n = 3); 2 × 10⁴ BA/F3 cells were plated. Cell numbers were counted 5 days after plating. The P values are as indicated (1-way ANOVA, Tukey test). (C) Number of primary GFP+ (BCR-ABL1+) BP-1+ B-ALL cells from young or old mice with established B-ALL plated on young vs old macrophages (MΦ); 1 × 10⁵ leukemia cells had been plated. The overall P value is indicated (1-way ANOVA). The data are representative of 2 independent experiments. (D) Cell cycle analysis by 4′,6-diamidino-2-phenylindole (DAPI) staining of primary GFP+ (BCR-ABL1+) BP-1+ cells plated on macrophages from young (red) vs old (blue) mice. The P values are as indicated (1-way ANOVA, Tukey test). (E) Number of primary GFP+ (BCR-ABL1+) BP-1+ cells adhering to macrophages from young (red) vs old (blue) mice (n = 3); 1 × 10⁵ cells had been plated and were allowed to adhere for 6 hours (not significant [n.s.]; Student t test). (F) Number of primary GFP+ (BCR-ABL1+) BP-1+ cells that had migrated toward macrophages from young (red) vs old (blue) mice after 24 hours; 1 × 10⁵ leukemia cells had been plated (P = .01; Student t test, n = 3). (G) Number of primary GFP+ (BCR-ABL1+) BP-1+ cells from 6-week-old mice plated in the CM of macrophages (MΦ) from young (red) vs old (blue) mice; 2 × 10⁴ GFP+ (BCR-ABL1+) BP-1+ cells had been plated. The P values are as indicated (1-way ANOVA, Tukey test) (n = 6). (H) Number of primary GFP+ (BCR-ABL1+) BP-1+ cells from young (left) vs old (right) mice with established B-ALL plated in the CM of macrophages (MΦ) from young (red) vs old (blue) mice; 2 × 10⁵ leukemia cells were plated. The overall P values are as indicated (1-way ANOVA).](https://ash.silverchair-cdn.com/ash/content_public/journal/blood/138/19/10.1182_blood.2021011557/4/m_bloodbld2021011557f3.png?Expires=1770148431&Signature=cgqRNSJAvvNOh~HTkKJTHmnhAgZjwYlEu00gGtKO-SjvOrVZtKhF6gjV-5jDKiPlNKqIW6DQOLo4T0yuasi~MFZj1rglTtHWcSeaaVr1px4pTEW6IeLEhE5WapP3NVuWHGWpvlRfrSEsZs-2KgB2ZJ0K3cnLjrJkAcxtoF2hwGJ-mmqxMwy2ku8OS14MqrLgRYzEejrk2m~XowFbrkFozk2366o-~UEiFGoBoxxJoraAweC68eRbF3uRsZB5OayC5Yfw0ftZYEm14HmvcPDcZFPf7rrQoJ-5b3bUyM4ZPQanAYOlGnQ7c9QvE88oirTErb4lL4rbZC8yjU629SJFRw__&Key-Pair-Id=APKAIE5G5CRDK6RD3PGA)
Young vs old BM macrophages interact differently with leukemia cells. (A) Number of primary GFP+ (BCR-ABL1+) BP-1+ cells plated on macrophages from young (red) vs old (blue) mice (n = 6); 2 × 10⁴ GFP+ (BCR-ABL1+) BP-1+ cells had been plated. The P values are as indicated (1-way ANOVA, Tukey test). (B) Number of BCR-ABL1+ BA/F3 cells plated on macrophages from mice of increasing ages (3-16 weeks) (n = 3); 2 × 10⁴ BA/F3 cells were plated. Cell numbers were counted 5 days after plating. The P values are as indicated (1-way ANOVA, Tukey test). (C) Number of primary GFP+ (BCR-ABL1+) BP-1+ B-ALL cells from young or old mice with established B-ALL plated on young vs old macrophages (MΦ); 1 × 10⁵ leukemia cells had been plated. The overall P value is indicated (1-way ANOVA). The data are representative of 2 independent experiments. (D) Cell cycle analysis by 4′,6-diamidino-2-phenylindole (DAPI) staining of primary GFP+ (BCR-ABL1+) BP-1+ cells plated on macrophages from young (red) vs old (blue) mice. The P values are as indicated (1-way ANOVA, Tukey test). (E) Number of primary GFP+ (BCR-ABL1+) BP-1+ cells adhering to macrophages from young (red) vs old (blue) mice (n = 3); 1 × 10⁵ cells had been plated and were allowed to adhere for 6 hours (not significant [n.s.]; Student t test). (F) Number of primary GFP+ (BCR-ABL1+) BP-1+ cells that had migrated toward macrophages from young (red) vs old (blue) mice after 24 hours; 1 × 10⁵ leukemia cells had been plated (P = .01; Student t test, n = 3). (G) Number of primary GFP+ (BCR-ABL1+) BP-1+ cells from 6-week-old mice plated in the CM of macrophages (MΦ) from young (red) vs old (blue) mice; 2 × 10⁴ GFP+ (BCR-ABL1+) BP-1+ cells had been plated. The P values are as indicated (1-way ANOVA, Tukey test) (n = 6). (H) Number of primary GFP+ (BCR-ABL1+) BP-1+ cells from young (left) vs old (right) mice with established B-ALL plated in the CM of macrophages (MΦ) from young (red) vs old (blue) mice; 2 × 10⁵ leukemia cells were plated. The overall P values are as indicated (1-way ANOVA).
Young vs old BM macrophages interact differently with leukemia cells. (A) Number of primary GFP+ (BCR-ABL1+) BP-1+ cells plated on macrophages from young (red) vs old (blue) mice (n = 6); 2 × 10⁴ GFP+ (BCR-ABL1+) BP-1+ cells had been plated. The P values are as indicated (1-way ANOVA, Tukey test). (B) Number of BCR-ABL1+ BA/F3 cells plated on macrophages from mice of increasing ages (3-16 weeks) (n = 3); 2 × 10⁴ BA/F3 cells were plated. Cell numbers were counted 5 days after plating. The P values are as indicated (1-way ANOVA, Tukey test). (C) Number of primary GFP+ (BCR-ABL1+) BP-1+ B-ALL cells from young or old mice with established B-ALL plated on young vs old macrophages (MΦ); 1 × 10⁵ leukemia cells had been plated. The overall P value is indicated (1-way ANOVA). The data are representative of 2 independent experiments. (D) Cell cycle analysis by 4′,6-diamidino-2-phenylindole (DAPI) staining of primary GFP+ (BCR-ABL1+) BP-1+ cells plated on macrophages from young (red) vs old (blue) mice. The P values are as indicated (1-way ANOVA, Tukey test). (E) Number of primary GFP+ (BCR-ABL1+) BP-1+ cells adhering to macrophages from young (red) vs old (blue) mice (n = 3); 1 × 10⁵ cells had been plated and were allowed to adhere for 6 hours (not significant [n.s.]; Student t test). (F) Number of primary GFP+ (BCR-ABL1+) BP-1+ cells that had migrated toward macrophages from young (red) vs old (blue) mice after 24 hours; 1 × 10⁵ leukemia cells had been plated (P = .01; Student t test, n = 3). (G) Number of primary GFP+ (BCR-ABL1+) BP-1+ cells from 6-week-old mice plated in the CM of macrophages (MΦ) from young (red) vs old (blue) mice; 2 × 10⁴ GFP+ (BCR-ABL1+) BP-1+ cells had been plated. The P values are as indicated (1-way ANOVA, Tukey test) (n = 6). (H) Number of primary GFP+ (BCR-ABL1+) BP-1+ cells from young (left) vs old (right) mice with established B-ALL plated in the CM of macrophages (MΦ) from young (red) vs old (blue) mice; 2 × 10⁵ leukemia cells were plated. The overall P values are as indicated (1-way ANOVA).
Age-related differences between macrophages from the BMM of young vs old mice
Given these differences, we hypothesized that young and old macrophages may differ with respect to key features such as proliferation or metabolism. Indeed, staining of first passage BM macrophages from young vs old mice with carboxyfluorescein succinimidyl ester (CFSE) revealed a significantly higher proliferative index in young macrophages (P = .0001; Figure 4A). Similarly, the proliferative index of young but not old macrophages increased from passage 1 to 2 (P < .0001; Figure 4B). Reactive oxygen species (ROS) (P = .02; Figure 4C) and γH2AX staining as a marker of DNA damage (and/or a higher number of cell division) (P = .031; Figure 4D) were significantly increased in old compared with young macrophages. Furthermore, staining for translocase of the outer membrane 20, a complex of proteins located in the outer membrane of mitochondria, revealed reduced staining and an elongation of mitochondria in old macrophages, which has been associated with mitochondrial stress28 (Figure 4E). A genome-wide transcriptome analysis29 revealed pronounced global differences and overall 473 up- and 569 downregulated differentially expressed genes between cultured young and old macrophages (supplemental Figure 6A-B; supplemental Table 3). Nonredundant enrichment analysis of differentially expressed genes using Metascape revealed significant enrichment of terms related to cytokine function, such as chemotaxis, virus response, and inflammation (supplemental Figure 6C-D). Investigating whether epigenetic changes regulate macrophage function, we performed ATAC sequencing to determine the open chromatin landscape in young vs old macrophages. It revealed pronounced global differences in genome-wide chromatin accessibility patterns (Figure 4F; supplemental Figure 7A-D; supplemental Table 4). Overall, 9496 differentially accessible regions (DARs) were identified (supplemental Figure 7E), which could be annotated to 5465 different genes (Figure 4G; supplemental Figure 7B). Two-thirds (67%) of the DARs showed increased chromatin accessibility in old BM macrophages (supplemental Figure 7A,E). On a global scale, the DARs were associated with the gene expression changes observed between young and old macrophages (supplemental Figure 7F). In analogy to the RNA-seq data, an enrichment analysis of the DARs revealed functional terms related to inflammation and immune response (Figure 4H). In summary, these data suggest that functional differences exist between macrophages isolated from young and old BM, particularly in regards to proliferation, ROS content, DNA damage, mitochondria, and inflammatory response.
![Age-related differences between macrophages from the BMM of young vs old mice. (A) Proliferative index (calculated using FlowJo’s Proliferation Tool) of first passage macrophages (MΦ) from young or old mice on days 2, 3, and 4 after the addition of 10 mM of CellTrace CFSE Cell Proliferation Kit (after 4 days P = .0001; ANOVA, Tukey test). The data are representative of 3 independent experiments. (B) Proliferative index as in panel A of first and second passage macrophages from young or old mice 3 days after the addition of 10 mM of CellTrace CFSE Cell Proliferation Kit (P < .0001; ANOVA, Tukey test). The data are representative of 3 independent experiments. Percentage of macrophages from young (red) or old (red) mice positive for ROS (P = .02; Student t test, n = 3) (C) or γH2AX (P = .031; Student t test) by mean fluorescence intensity (MFI) (D), as measured by flow cytometry. Macrophages had been cultured for 3 days (n = 5). (E) Representative confocal images (scale bar, 10 μm) of macrophages from young (top) or old (bottom) mice stained with an antibody to translocase of the outer membrane 20 (green) to visualize mitochondria (n = 3). Nuclei are stained with DAPI (blue). Macrophages had been cultured for 3 days before staining. (F) Heatmap depicting the Pearson correlation of normalized reads per peak (ATAC-seq). Further analysis is performed on all DARs in young (green) vs old (orange) macrophages. Statistically significant DARs were defined as abs (log2[FC]) >1 with an adjusted P value <. Overall, 239 473 consensus peaks were tested, and 9446 DARs fulfilled the statistical requirements. Clustering of DARs confirmed consistency across replicates. (G) Volcano plot summarizing all DARs in young vs old macrophages. Color codes represent significantly open (red) and closed (blue) DARs in young vs old macrophages. The top 7 DARs of both directions and their annotated genes are labeled. (H) Pathway enrichment analysis of peaks with an adjusted P value ≤.05. Depicted are top 5 enriched MSigDB hallmarks for open and closed regions in young vs old macrophages. The odds ratio quantifies the strength of association between young vs old macrophages, reflecting the enrichment of pathways in open and closed chromatin of young macrophages. Visualized is the negative log10 of the P value.](https://ash.silverchair-cdn.com/ash/content_public/journal/blood/138/19/10.1182_blood.2021011557/4/m_bloodbld2021011557f4.png?Expires=1770148431&Signature=U9h94ccxQ-IOI~eT4pNM9pQf9u2p7vb33lo6d4A4DAARLzKLdZHFTWRCsDKTAfpyVHy1qhkp4t7SPeZnFI0pA5g8ybL7QXGnglQ8hd4jPnF9mwnYgR8la0RqgVcbJlURB4JBI-wJGkrpkroAfxgrMBAUnxHVzOboRSo8cuvWc747TBE3HcWR~50gp68i7dJPZOnwPfSMkKlKIZMw-fjW3Yx97GlQ~Qx8BBsG~mFACfDpTLFUty0orO8x8U2hXwGt4941E88fM0MFAF1uoo~RNgdanCVdUWQpVScr-a2QQNWU40pfQI4GlOMWk4S1mj6wbf-oPoRA6lzm9P2PnkgUdg__&Key-Pair-Id=APKAIE5G5CRDK6RD3PGA)
Age-related differences between macrophages from the BMM of young vs old mice. (A) Proliferative index (calculated using FlowJo’s Proliferation Tool) of first passage macrophages (MΦ) from young or old mice on days 2, 3, and 4 after the addition of 10 mM of CellTrace CFSE Cell Proliferation Kit (after 4 days P = .0001; ANOVA, Tukey test). The data are representative of 3 independent experiments. (B) Proliferative index as in panel A of first and second passage macrophages from young or old mice 3 days after the addition of 10 mM of CellTrace CFSE Cell Proliferation Kit (P < .0001; ANOVA, Tukey test). The data are representative of 3 independent experiments. Percentage of macrophages from young (red) or old (red) mice positive for ROS (P = .02; Student t test, n = 3) (C) or γH2AX (P = .031; Student t test) by mean fluorescence intensity (MFI) (D), as measured by flow cytometry. Macrophages had been cultured for 3 days (n = 5). (E) Representative confocal images (scale bar, 10 μm) of macrophages from young (top) or old (bottom) mice stained with an antibody to translocase of the outer membrane 20 (green) to visualize mitochondria (n = 3). Nuclei are stained with DAPI (blue). Macrophages had been cultured for 3 days before staining. (F) Heatmap depicting the Pearson correlation of normalized reads per peak (ATAC-seq). Further analysis is performed on all DARs in young (green) vs old (orange) macrophages. Statistically significant DARs were defined as abs (log2[FC]) >1 with an adjusted P value <. Overall, 239 473 consensus peaks were tested, and 9446 DARs fulfilled the statistical requirements. Clustering of DARs confirmed consistency across replicates. (G) Volcano plot summarizing all DARs in young vs old macrophages. Color codes represent significantly open (red) and closed (blue) DARs in young vs old macrophages. The top 7 DARs of both directions and their annotated genes are labeled. (H) Pathway enrichment analysis of peaks with an adjusted P value ≤.05. Depicted are top 5 enriched MSigDB hallmarks for open and closed regions in young vs old macrophages. The odds ratio quantifies the strength of association between young vs old macrophages, reflecting the enrichment of pathways in open and closed chromatin of young macrophages. Visualized is the negative log10 of the P value.
Age-related differences between macrophages from the BMM of young vs old mice. (A) Proliferative index (calculated using FlowJo’s Proliferation Tool) of first passage macrophages (MΦ) from young or old mice on days 2, 3, and 4 after the addition of 10 mM of CellTrace CFSE Cell Proliferation Kit (after 4 days P = .0001; ANOVA, Tukey test). The data are representative of 3 independent experiments. (B) Proliferative index as in panel A of first and second passage macrophages from young or old mice 3 days after the addition of 10 mM of CellTrace CFSE Cell Proliferation Kit (P < .0001; ANOVA, Tukey test). The data are representative of 3 independent experiments. Percentage of macrophages from young (red) or old (red) mice positive for ROS (P = .02; Student t test, n = 3) (C) or γH2AX (P = .031; Student t test) by mean fluorescence intensity (MFI) (D), as measured by flow cytometry. Macrophages had been cultured for 3 days (n = 5). (E) Representative confocal images (scale bar, 10 μm) of macrophages from young (top) or old (bottom) mice stained with an antibody to translocase of the outer membrane 20 (green) to visualize mitochondria (n = 3). Nuclei are stained with DAPI (blue). Macrophages had been cultured for 3 days before staining. (F) Heatmap depicting the Pearson correlation of normalized reads per peak (ATAC-seq). Further analysis is performed on all DARs in young (green) vs old (orange) macrophages. Statistically significant DARs were defined as abs (log2[FC]) >1 with an adjusted P value <. Overall, 239 473 consensus peaks were tested, and 9446 DARs fulfilled the statistical requirements. Clustering of DARs confirmed consistency across replicates. (G) Volcano plot summarizing all DARs in young vs old macrophages. Color codes represent significantly open (red) and closed (blue) DARs in young vs old macrophages. The top 7 DARs of both directions and their annotated genes are labeled. (H) Pathway enrichment analysis of peaks with an adjusted P value ≤.05. Depicted are top 5 enriched MSigDB hallmarks for open and closed regions in young vs old macrophages. The odds ratio quantifies the strength of association between young vs old macrophages, reflecting the enrichment of pathways in open and closed chromatin of young macrophages. Visualized is the negative log10 of the P value.
Young BMM macrophages produce higher levels of CXCL13
We hypothesized that a chemokine, more highly secreted by young macrophages, may be accountable for augmented leukemia cell growth. CXCL13 is a B-lymphocyte chemoattractant mediating the migration of B cells30 and lymphoma cells31 to sites of infection and the CNS, respectively. CXCL13 acts as diagnostic marker in the cerebrospinal fluid in neuroborreliosis.30 Further, CXCL13 is included in the MSigDB hallmark gene sets “inflammatory response” and “IL-6_Jak_Stat3_signaling,” which were enriched in DARs (Figure 4H). Therefore, we surmised that CXCL13 levels may be higher in a young vs an old BMM, that CXCL13 may contribute to altered migration of leukemia cells in a young BMM, and that it may play a role in the shortened survival of young mice with B-ALL. Indeed, we found significantly higher levels of CXCL13 in cultured (Figure 5A; supplemental Figure 8A) and a trend in primary (supplemental Figure 8B) BMM-derived macrophages but not other cell types (supplemental Figure 8C-E) from young mice compared with old mice. Further, flushed BM (P = .007; Figure 5B) of young mice and CM from young BM-derived macrophages (P < .0001; Figure 5C) had a higher CXCL13 concentration than the respective old controls, also when the CXCL13 concentration was normalized to the number of leukocytes or macrophages, respectively (supplemental Figure 8F-G). No significant differences of CXCL13 expression were found on a transcriptional level (supplemental Figures 6 and 8H). The CXCL13 concentration was also higher in plasma (P = .03; Figure 5D) and BM (P = .03; Figure 5E) and in the CM of macrophages (P = .05; Figure 5F) from young compared with old mice with B-ALL. Testing the expression of Cxcr5, the receptor for CXCL13, on GFP+ (BCR-ABL1+) BP-1+ B-ALL cells, we found higher Cxcr5 expression on B-ALL cells from young compared with old mice (P = .03; Figure 5G; supplemental Figure 9A). CXCR5 expression was also detected on BCR-ABL1+ BA/F3 cells, various human B-ALL cell lines (Figure 5H; supplemental Figure 9B-C), and normal human B and primary human B-ALL cells (Figure 5I; supplemental Figure 9D). These results suggest that CXCL13, a chemokine with B-cell–attracting function, is more highly expressed by macrophages in a young vs an old BMM on a translational level. Cxcr5 is expressed at higher levels on B-ALL cells from a young vs an old BMM and on human B-ALL cells, suggesting that the CXCR5-CXCL13 axis may be of importance, particularly in a young BMM, where it may influence B-ALL cell migration and proliferation.
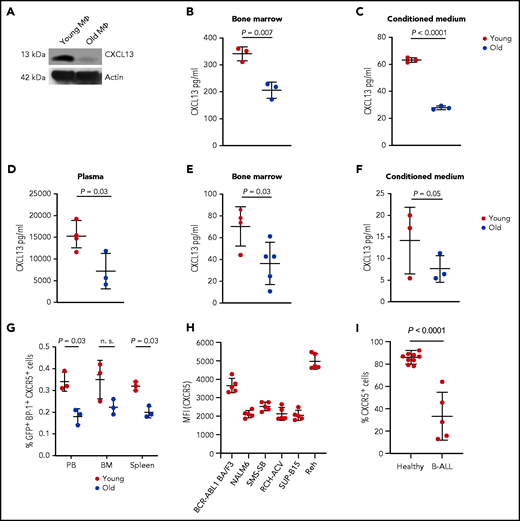
Young BMM macrophages produce higher levels of CXCL13. (A) Western blot of protein lysates of macrophages (MΦ) from young vs old mice stained with an antibody to CXCL13 (13 kDa). The macrophages had been cultured for 3 days. The blot is representative of 3 independent western blots. Concentration of CXCL13 pg/mL in flushed bone (P = .007; Student t test) (B) or CM from macrophages (P < .0001; Student t test) (C) from healthy young (red) vs aged (blue) mice (n = 3). Macrophages had been cultured for 7 days. (D-F) Concentration of CXCL13 pg/mL in the plasma of peripheral blood (P = .03; Student t test, n = 3-4) (D), flushed BM (P = .03; Student t test, n = 4-5) (E), or CM of macrophages (P = .05; Student t test, n = 3) (F) from young (red) vs old (blue) nonirradiated BALB/c recipient mice transplanted with BCR-ABL1–transduced BM on day 18 after transplantation. The macrophages had been cultured for 3 days before the harvest of the CM. The P values are as indicated (Student t test, n = 3). (G) Percentage of GFP+ (BCR-ABL1+) BP-1+ CXCR5+ cells of total leukocytes in the peripheral blood (PB), BM, and spleen of young (red) vs old (blue) mice with fully established B-ALL (day 20 after transplantation) (P = .03 in PB and spleen; Student t test, n = 3). (H) MFI of CXCR5 on BCR-ABL1+ BA/F3 cells and the human B-ALL cell lines NALM6, SMS-SB, Reh, RCH-ACV, and SUP-B15 (n = 5). (I) Percentage of CXCR5+ cells of human CD45+ CD19+ cells from the peripheral blood of healthy individuals vs patients with B-ALL (n = 5-9).
Young BMM macrophages produce higher levels of CXCL13. (A) Western blot of protein lysates of macrophages (MΦ) from young vs old mice stained with an antibody to CXCL13 (13 kDa). The macrophages had been cultured for 3 days. The blot is representative of 3 independent western blots. Concentration of CXCL13 pg/mL in flushed bone (P = .007; Student t test) (B) or CM from macrophages (P < .0001; Student t test) (C) from healthy young (red) vs aged (blue) mice (n = 3). Macrophages had been cultured for 7 days. (D-F) Concentration of CXCL13 pg/mL in the plasma of peripheral blood (P = .03; Student t test, n = 3-4) (D), flushed BM (P = .03; Student t test, n = 4-5) (E), or CM of macrophages (P = .05; Student t test, n = 3) (F) from young (red) vs old (blue) nonirradiated BALB/c recipient mice transplanted with BCR-ABL1–transduced BM on day 18 after transplantation. The macrophages had been cultured for 3 days before the harvest of the CM. The P values are as indicated (Student t test, n = 3). (G) Percentage of GFP+ (BCR-ABL1+) BP-1+ CXCR5+ cells of total leukocytes in the peripheral blood (PB), BM, and spleen of young (red) vs old (blue) mice with fully established B-ALL (day 20 after transplantation) (P = .03 in PB and spleen; Student t test, n = 3). (H) MFI of CXCR5 on BCR-ABL1+ BA/F3 cells and the human B-ALL cell lines NALM6, SMS-SB, Reh, RCH-ACV, and SUP-B15 (n = 5). (I) Percentage of CXCR5+ cells of human CD45+ CD19+ cells from the peripheral blood of healthy individuals vs patients with B-ALL (n = 5-9).
The CXCR5-CXCL13 axis supports the proliferation of B-ALL cells in a young BMM
To test the CXCR5-CXCL13 axis for the proliferation of BCR-ABL1+ BA/F3 cells, we transduced BMM-derived macrophages in vitro with sh scrambled or sh Cxcl13-expressing lentivirus (P = .003; supplemental Figure 10A) before coculture with BCR-ABL1–transduced BA/F3 cells. Knockdown of Cxcl13 in macrophages led to a significant reduction in the proliferation of BCR-ABL1+ and empty vector-control+ BA/F3 cells (supplemental Figure 10B). Consistently, addition of an inhibitory antibody to CXCL13 significantly reduced the proliferation of primary BCR-ABL1+ BP1+ (P < .0001; Figure 6A) and BCR-ABL1+ BA/F3 (supplemental Figure 10C) cells when plated on young macrophages. CXCL13 inhibition did not alter the proliferation of BCR-ABL1+ BA/F3 cells plated on old macrophages, nor did it significantly alter the proliferation of BA/F3 cells transduced with empty vector (supplemental Figure 10C). Coculture of BCR-ABL1+ BA/F3 cells with young macrophages also led to higher levels of nuclear pAKT, which lies downstream of CXCR532 and BCR-ABL133 and has been implicated in the cell cycle,25,34 in leukemia cells compared with coculture on old macrophages (Figure 6B). This effect was blocked after treatment with anti-CXCL13 (P < .0001; Figure 6B-C). Conversely, addition of recombinant CXCL13 to cocultures of macrophages with primary BCR-ABL1+ BP1+ (P = .005 on young macrophages and P = .0002 on old macrophages; Figure 6D) or BCR-ABL1+ BA/F3 (supplemental Figure 10D) cells increased leukemia cell proliferation compared with cultures treated with bovine serum albumin (BSA). Treatment of BCR-ABL1+ BA/F3 cells with increasing concentrations of CXCL13 led to nonsignificantly increased levels of pAKT (supplemental Figure 10E-F). Further, treatment of primary sorted BP-1+ BCR-ABL1+ leukemia cells, which had been exposed to a young or an old BMM in vivo, with recombinant CXCL13 significantly promoted the growth of leukemia cells, regardless of whether they had been derived from a young (P = .005; Figure 6E, left) or an old (P = .012; Figure 6E, right) BMM. In confirmation of the pro-proliferative role of CXCL13, in vitro pretreatment of B-ALL LICs with CXCL13 before transplantation significantly accelerated leukemia development in recipient mice compared with B-ALL LICs treated with BSA (P = .002; Figure 6F) by increasing CXCR5 expression (supplemental Figure 10G), homing to BM (supplemental Figure 10H) and pAKT expression (supplemental Figure 10I) of BP-1+ BCR-ABL1+ cells. Blockade of CXCL13 significantly inhibited the migration of primary BCR-ABL1+ BP1+ (P < .0001; Figure 6G) and BCR-ABL1+ BA/F3 (P = .04; supplemental Figure 10J) cells toward macrophages from a young BMM, whereas addition of CXCL13 increased migration (P = .01; Figure 6G). Ablation of phagocytes in young or old recipients of B-ALL LICs with clodronate25 (supplemental Figure 11A) led to a significant reduction of the GFP+ (BCR-ABL1+) BP1+ tumor burden (P < .0001; Figure 6H), survival prolongation (P = .05; Figure 6I), and a reduction of CXCL13 in blood plasma (P = .001; Figure 6J) and flushed bone (P < .0001; Figure 6K) in young but not old recipients (supplemental Figure 11B-D). Contributions of other ablated cell types to this phenotype cannot be excluded, although their numbers were only minimally reduced (supplemental Figure 11A). Taken together, these data suggest that CXCL13, secreted at least partly by macrophages, promotes the migration and proliferation of B-ALL cells, influencing survival in B-ALL.
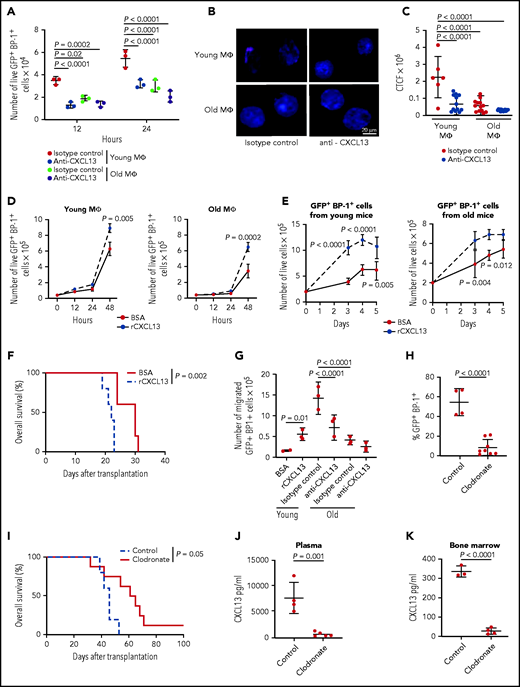
The CXCR5-CXCL13 axis influences the proliferation of B-ALL cells in a young more than in an old BMM. (A) Number of primary GFP+ (BCR-ABL1+) BP-1+ cells plated on 5 × 10⁴ macrophages (MΦ) from young vs old mice in the presence of 2.5 μg of isotype control or anti-CXCL13 antibody; 2 × 10⁴ leukemia cells had been plated and were counted 12 and 24 hours after addition of the antibodies. The P values are as indicated (2-way ANOVA, Tukey test, n = 3). (B) Representative confocal images (scale bar, 20 μm) of BCR-ABL1+ BA/F3 cells plated on macrophages (MΦ) from young or old mice stained with an antibody to pAKT (red) after treatment with 2.5 μg of isotype control or anti-CXCL13 antibody for 5 days (n = 3). Nuclei are stained with DAPI (blue); 3 × 10⁵ BCR-ABL1+ BA/F3 cells had been plated and then cultured for 5 days before staining. (C) Corrected total cell fluorescence (CTCF) × 106 for nuclear pAKT, as in panel B, in BCR-ABL1+ BA/F3 cells plated on macrophages from young or old mice stained with an antibody to pAKT after treatment with 2.5 μg of isotype control or anti-CXCL13 antibody (2-way ANOVA, Tukey test, n = 3). The antibodies had been added at the start of the coculture. (D) Number of primary live GFP+ (BCR-ABL1+) BP-1+ cells cultured in the presence of 1% BSA or 100 ng/mL recombinant CXCL13 on young (left) vs old (right) macrophages (MΦ); 4 × 10⁴ leukemia cells had been plated. Cells were enumerated after exclusion of trypan blue+ dead cells. The P values for the timepoint at 48 hours are as indicated (2-way ANOVA, Tukey test, n = 3). (E) Number of sorted primary GFP+ (BCR-ABL1+) BP-1+ cells from young (left) or old (right) mice with established B-ALL cultured in the presence of 1% BSA or 100 ng/mL recombinant CXCL13; 2 × 10⁵ cells had been plated. The P values are P < .0001 on day 3 and 4, P = .005 on day 5 (left) and P = .004 on day 3 and P = .012 on day 4 (right) (2-way ANOVA, Tukey test) for the indicated timepoints. The data are representative of 3 independent experiments. (F) Kaplan-Meier–style survival curve of nonirradiated BALB/c recipient mice transplanted with 2 × 10⁶ transduced BM cells pretreated with 1% of BSA or 100 ng/mL recombinant CXCL13 for 18 hours before transplantation (P = .002; log-rank test, n = 5). (G) Number of primary GFP+ (BCR-ABL1+) BP-1+ cells that had migrated toward 1% BSA or 100 ng/mL recombinant CXCL13 or young vs old macrophages in the presence of 2.5 μg of isotype control or anti-CXCL13 antibody after 24 hours; 2 × 10⁴ GFP+ (BCR-ABL1+) BP-1+ cells had been plated. The P values are as indicated (one-way ANOVA, Tukey test, n = 3). Percentage of GFP+ (BCR-ABL1+) BP-1+ cells in peripheral blood (P < .0001; Student t test, n = 4-8) (day 21 after transplantation) (H) and Kaplan-Meier–style survival curve (P = .05; log-rank test, n = 5-8) (I) of young, nonirradiated C57BL/6J recipient mice, treated with control (blue) or clodronate (red) liposomes, after transplantation of 2 × 10⁶ BCR-ABL1–transduced BM in the B-ALL model. Control liposomes or clodronate liposomes were administered weekly at 5 mg/10 g of animal weight starting from day 12 after transplantation. Concentration of CXCL13 in pg/mL in the plasma on day 21 after transplantation (J) and flushed bone at the time of death (K) of young C57BL/6J recipient mice transplanted with BCR-ABL1–transduced BM and treated with control liposomes or clodronate liposomes as in panel I. The P values are as indicated (Student t test, n = 3-4).
The CXCR5-CXCL13 axis influences the proliferation of B-ALL cells in a young more than in an old BMM. (A) Number of primary GFP+ (BCR-ABL1+) BP-1+ cells plated on 5 × 10⁴ macrophages (MΦ) from young vs old mice in the presence of 2.5 μg of isotype control or anti-CXCL13 antibody; 2 × 10⁴ leukemia cells had been plated and were counted 12 and 24 hours after addition of the antibodies. The P values are as indicated (2-way ANOVA, Tukey test, n = 3). (B) Representative confocal images (scale bar, 20 μm) of BCR-ABL1+ BA/F3 cells plated on macrophages (MΦ) from young or old mice stained with an antibody to pAKT (red) after treatment with 2.5 μg of isotype control or anti-CXCL13 antibody for 5 days (n = 3). Nuclei are stained with DAPI (blue); 3 × 10⁵ BCR-ABL1+ BA/F3 cells had been plated and then cultured for 5 days before staining. (C) Corrected total cell fluorescence (CTCF) × 106 for nuclear pAKT, as in panel B, in BCR-ABL1+ BA/F3 cells plated on macrophages from young or old mice stained with an antibody to pAKT after treatment with 2.5 μg of isotype control or anti-CXCL13 antibody (2-way ANOVA, Tukey test, n = 3). The antibodies had been added at the start of the coculture. (D) Number of primary live GFP+ (BCR-ABL1+) BP-1+ cells cultured in the presence of 1% BSA or 100 ng/mL recombinant CXCL13 on young (left) vs old (right) macrophages (MΦ); 4 × 10⁴ leukemia cells had been plated. Cells were enumerated after exclusion of trypan blue+ dead cells. The P values for the timepoint at 48 hours are as indicated (2-way ANOVA, Tukey test, n = 3). (E) Number of sorted primary GFP+ (BCR-ABL1+) BP-1+ cells from young (left) or old (right) mice with established B-ALL cultured in the presence of 1% BSA or 100 ng/mL recombinant CXCL13; 2 × 10⁵ cells had been plated. The P values are P < .0001 on day 3 and 4, P = .005 on day 5 (left) and P = .004 on day 3 and P = .012 on day 4 (right) (2-way ANOVA, Tukey test) for the indicated timepoints. The data are representative of 3 independent experiments. (F) Kaplan-Meier–style survival curve of nonirradiated BALB/c recipient mice transplanted with 2 × 10⁶ transduced BM cells pretreated with 1% of BSA or 100 ng/mL recombinant CXCL13 for 18 hours before transplantation (P = .002; log-rank test, n = 5). (G) Number of primary GFP+ (BCR-ABL1+) BP-1+ cells that had migrated toward 1% BSA or 100 ng/mL recombinant CXCL13 or young vs old macrophages in the presence of 2.5 μg of isotype control or anti-CXCL13 antibody after 24 hours; 2 × 10⁴ GFP+ (BCR-ABL1+) BP-1+ cells had been plated. The P values are as indicated (one-way ANOVA, Tukey test, n = 3). Percentage of GFP+ (BCR-ABL1+) BP-1+ cells in peripheral blood (P < .0001; Student t test, n = 4-8) (day 21 after transplantation) (H) and Kaplan-Meier–style survival curve (P = .05; log-rank test, n = 5-8) (I) of young, nonirradiated C57BL/6J recipient mice, treated with control (blue) or clodronate (red) liposomes, after transplantation of 2 × 10⁶ BCR-ABL1–transduced BM in the B-ALL model. Control liposomes or clodronate liposomes were administered weekly at 5 mg/10 g of animal weight starting from day 12 after transplantation. Concentration of CXCL13 in pg/mL in the plasma on day 21 after transplantation (J) and flushed bone at the time of death (K) of young C57BL/6J recipient mice transplanted with BCR-ABL1–transduced BM and treated with control liposomes or clodronate liposomes as in panel I. The P values are as indicated (Student t test, n = 3-4).
CXCR5 expression may predict outcome in murine and human B-ALL
We hypothesized that decreased levels of CXCR5 may prolong survival of mice with B-ALL. Indeed, transplantation of BCR-ABL1+ wild-type or CXCR5-deficient donor BM into young but not old (data not shown) wild-type recipients led to a significant reduction of the BCR-ABL1+ (GFP+) BP-1+ tumor load (P < .0001; Figure 7A) and survival prolongation in recipients of CXCR5-deficient compared with wild-type B-ALL LICs (P = .0004; Figure 7B). However, the homing of CXCR5-deficient BCR-ABL1+ BP-1+ B-ALL LICs was not compromised (supplemental Figure 12A). In the human setting, CD68+ macrophages and CXCL13 levels were higher in bone sections from pediatric compared with adult patients with B-ALL (Figure 7C; supplemental Figure 12B; supplemental Table 2). Given the role of CD14dim CD16+ nonclassic monocytes for B-ALL progression,21 we also identified increased proportions of this cell population (Figure 7D; supplemental Figure 12C), which generates CXCL13 (Figure 7E), in bone sections of patients with pediatric vs adult B-ALL. Testing whether CXCR5 expression may act as predictive marker in human B-ALL, we stratified patients from the Pan-B-ALL study35 into patients with high or low expression of CXCR5 based on RNA-seq results and time-dependent receiver operating characteristic analysis to establish a cutoff. For the B-ALL subset hyperdiploid, normally associated with good prognosis,36 we demonstrated that low CXCR5 expression may be associated with improved event-free survival in the adolescent/young adult and adult age group (P = .008; supplemental Figure 13A), consistent with our murine data. However, patient numbers were small. No significant differences were observed in event-free survival (supplemental Figure 13B-E) or overall survival (supplemental Figure 13F-G) in the low CXCR5 expression group in other B-ALL subtypes. Given the role of CXCR5 for the homing of B cells to the CNS in neuroborreliosis,30 we hypothesized that CXCR5 expression may be predictive of B-ALL relapse in the CNS. Using the analysis of a publicly available clinical dataset of B-ALL blasts from patients with CNS and BM relapses,37 we observed that CXCR5 expression may be higher in CNS compared with isolated BM relapses (P = .002; Figure 7F), although the number of included patients is low. Taken together, these data show that decreased CXCR5 expression in B-ALL cells leads to survival prolongation in mice. The CXCR5-CXCL13 axis may be relevant in human B-ALL, and higher CXCR5 expression in human B-ALL may be associated with CNS relapse.
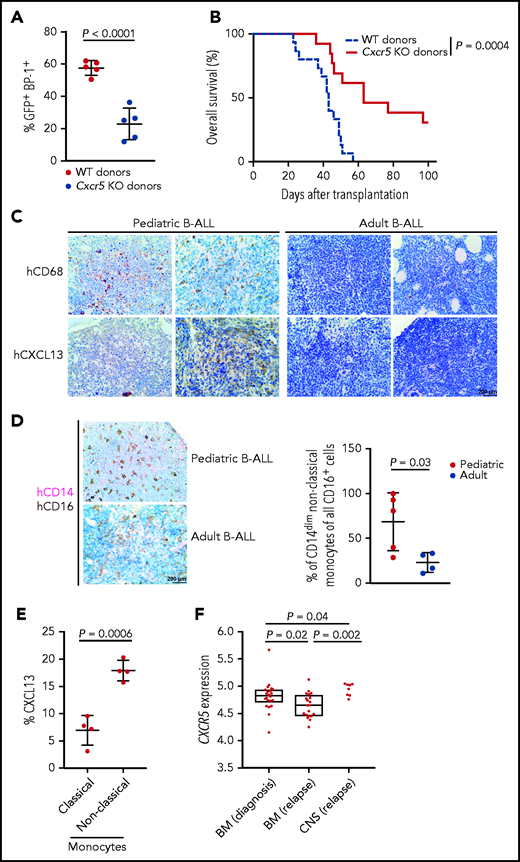
The CXCR5-CXCL13 axis may influence outcome in BCR-ABL1+ murine B-ALL and possibly human B-ALL. Percentage of GFP+ (BCR-ABL1+) BP-1+ cells in peripheral blood on day 27 after transplantation (P < .0001; Student t test, n = 5) (A) and Kaplan-Meier–style survival curve (B) for wild-type (WT) young recipients of 1 × 10⁶ WT (blue) or Cxcr5 knockout (KO) (red) BCR-ABL1–transduced donor bone marrow (BM) cells in the B-ALL model. The difference in survival was statistically significant (P = .0004; log-rank test, n = 11-12). (C) Representative bone sections of 2 human pediatric (left) or adult (right) patients with B-ALL stained with antibodies to CD68 labeling macrophages or CXCL13. Scale bar, 200 μm. (D) Representative bone sections of human pediatric (top) or adult (bottom) patients with B-ALL stained with antibodies to CD14 (pink) and CD16 (brown), depicting CD14dim CD16+ nonclassic monocytes.21 The percentage of CD14dim CD16+ nonclassic monocytes of all CD16+ monocytes/natural killer cells per patient, as counted by a blinded pathologist, is shown on the right (P = .03; Student t test, n = 4-5) The scale bar depicts 200 μm. (E) Percentage of CXCL13+ CD14+ CD16dim (classic monocytes) vs CXCL13+ CD14dim CD16+ (nonclassic monocytes) in BM aspirates of human pediatric patients with B-ALL (P = .0006; Student t-test, n = 4). (F) Comparison of gene expression of CXCR5 on B-ALL blasts retrieved from bone marrow (BM) at diagnosis (n = 22), BM at relapse (n = 20), and the CNS (n = 8) (ie, blast cells retrieved from cerebrospinal fluid) at CNS relapse.37
The CXCR5-CXCL13 axis may influence outcome in BCR-ABL1+ murine B-ALL and possibly human B-ALL. Percentage of GFP+ (BCR-ABL1+) BP-1+ cells in peripheral blood on day 27 after transplantation (P < .0001; Student t test, n = 5) (A) and Kaplan-Meier–style survival curve (B) for wild-type (WT) young recipients of 1 × 10⁶ WT (blue) or Cxcr5 knockout (KO) (red) BCR-ABL1–transduced donor bone marrow (BM) cells in the B-ALL model. The difference in survival was statistically significant (P = .0004; log-rank test, n = 11-12). (C) Representative bone sections of 2 human pediatric (left) or adult (right) patients with B-ALL stained with antibodies to CD68 labeling macrophages or CXCL13. Scale bar, 200 μm. (D) Representative bone sections of human pediatric (top) or adult (bottom) patients with B-ALL stained with antibodies to CD14 (pink) and CD16 (brown), depicting CD14dim CD16+ nonclassic monocytes.21 The percentage of CD14dim CD16+ nonclassic monocytes of all CD16+ monocytes/natural killer cells per patient, as counted by a blinded pathologist, is shown on the right (P = .03; Student t test, n = 4-5) The scale bar depicts 200 μm. (E) Percentage of CXCL13+ CD14+ CD16dim (classic monocytes) vs CXCL13+ CD14dim CD16+ (nonclassic monocytes) in BM aspirates of human pediatric patients with B-ALL (P = .0006; Student t-test, n = 4). (F) Comparison of gene expression of CXCR5 on B-ALL blasts retrieved from bone marrow (BM) at diagnosis (n = 22), BM at relapse (n = 20), and the CNS (n = 8) (ie, blast cells retrieved from cerebrospinal fluid) at CNS relapse.37
Discussion
Here we show that the BMM, in particular macrophages, age dependently influences B-ALL progression. We reveal pronounced differences in genome-wide gene expression and chromatin accessibility between macrophages from young vs old mice. These genes and DARs suggest an elevated inflammatory response in young BMM-derived macrophages. We implicate the CXCR5-CXCL13 axis as an influencing factor in B-ALL progression, although a role for direct cell contact between macrophages and leukemia cells cannot be excluded. We propose that the CXCR5-CXCL13 axis may act as prognostic marker or potential target for treatment of human B-ALL.
In support of our study, targeting of monocytes/macrophages in B-ALL21 or chronic lymphocytic leukemia,23 which is characterized by increased expression of CXCR5/CXCL13,38 led to a reduced leukemia burden, but we do not exclude the possibility that other cell types may also contribute to leukemia support or CXCL13 secretion. The impairment of macrophage function, including the reduction of phagocytic activity,39 the reduced production of inflammatory cytokines,40 and altered expression of certain genes, such as MHC class II molecules,41 by the aging process is well known and was largely also found in our study. Thereby, decreased CXCL13 secretion may be the consequence of decreased macrophage function or may be due to altered macrophage numbers, which in humans are known to decrease with aging. In mice, however, as also found in our study, macrophages have been shown to increase or remain constant with age.39,42
Consistent with reports on a decrease of mitochondrial biogenesis,43 structural alterations in mitochondria,44 and damage to DNA, proteins, and lipids due to oxidative damage in mitochondria,45 we showed morphological differences in old macrophages as well as increased ROS and DNA damage.46 It is possible that increased ROS may modulate regulators of CXCL13 expression.47 On the other hand, no significant differences were found between macrophages from young vs old mice with regards to Cxcl13 transcription, consistent with the absence of strong differences of open chromatin signatures at the transcriptional start site or gene body of Cxcl13. Therefore, the upregulated protein levels of CXCL13 are probably not directly transcriptionally regulated but may be due to differences in translation, protein stability, or degradation or posttranslational modification.
Our findings on a possible association of CXCR5 expression with CNS relapse are consistent with published data on the migration of precursor B-ALL cell lines with higher CXCR5 expression to the CNS, whereby CXCL13 was found to be expressed by the meninges.48 CXCL13 has also been identified as a biomarker in CNS lymphoma.31 However, although our early human data may suggest a possible role for the CXCR5-CXCL13 axis in human B-ALL, the significance of these data, which are partially underpowered, is less well developed than the murine data and needs to be carefully assessed in the future. Nevertheless, in clear cell renal carcinoma, high expression of CXCR5/CXCL13 has been associated with tumor progression and worse prognosis.49
Inhibition of the CXCR5-CXCL13 axis by small molecule inhibitors of CXCR5, antibodies to CXCL13, as performed in a murine model of breast cancer,50 and, as recently shown, CXCR5-specific chimeric antigen receptor T cells,51 may be potential therapeutic approaches in B-ALL and could be assessed in the future.
In summary, we have demonstrated that the age of the BMM contributes to the leukemic phenotype, at least partly via increased secretion of CXCL13 by young compared with old BMM macrophages. Our data suggest that the CXCR5-CXCL13 axis may be of prognostic relevance in B-ALL and may offer a possible novel avenue for treatment.
Acknowledgments
The authors thank the High Throughput Sequencing Unit of the Genomics & Proteomics Core Facility, German Cancer Research Center (DKFZ), for library preparation (RNA-seq) and sequencing (RNA- and ATAC-seq).
This work was supported by grants from the Deutsche Kinderkrebsstiftung (A2016/03 [D.S.K.]), the National Institutes of Health, National Cancer Institute (UG1 CA233338 and U24 CA196171 [C.D.B.] and R35 CA197695 and CA021765 [C.G.M.]), and The Little Princess Trust (CCLGA 2017 13 [C.H.]).
Authorship
Contribution: C.Z. designed and carried out experiments, analyzed the data, and critically reviewed the manuscript; J.E., E.S.W., R.K., V.R.M., and C.K. assisted with experiments; P.S.G. assisted with the in vivo microscopy experiments; M.H., J.H., K.B., C.P., and D.B.L. performed and analyzed the RNA-seq and ATAC-seq experiments and critically reviewed the manuscript; M.M. provided patient samples; R.P.H., K.B., and S.H. provided patient samples and assisted with histopathology-related questions; Z.G. and K.G.R. provided and analyzed the data on patients with human B-ALL; W.S. and C.G.M. contributed patients for clinical trials; C.D.B. contributed patients for clinical trials and critically reviewed the manuscript; C.H. and A.F.C. contributed and analyzed data on CNS involvement in pediatric patients; N.F. assisted with statistical questions and critically reviewed the manuscript; and D.S.K. designed experiments, supervised the project, analyzed data, and wrote the manuscript.
Conflict-of-interest disclosure: The authors declare no competing financial interests.
Correspondence: Daniela S. Krause, Georg-Speyer-Haus, Institute for Tumor Biology and Experimental Therapy, Paul-Ehrlich-Str 42-44, 60596 Frankfurt am Main, Germany; e-mail: krause@gsh.uni-frankfurt.de.
All data can be obtained by e-mailing the corresponding author.
The RNA- and ATAC-sequencing data reported in this article have been deposited in the Gene Expression Omnibus database (GSE182174).
The online version of this article contains a data supplement.
There is a Blood Commentary on this article in this issue.
The publication costs of this article were defrayed in part by page charge payment. Therefore, and solely to indicate this fact, this article is hereby marked “advertisement” in accordance with 18 USC section 1734.

This feature is available to Subscribers Only
Sign In or Create an Account Close Modal