

Key Points
iNKT2 and iNKT17, but not iNKT1, cells mitigate murine acute GVHD.
iNKT1 cells exert stronger antitumor effects in vitro and in vivo.

Abstract
Invariant natural killer T (iNKT) cells are a T-cell subset with potent immunomodulatory properties. Experimental evidence in mice and observational studies in humans indicate that iNKT cells have antitumor potential as well as the ability to suppress acute and chronic graft-versus-host-disease (GVHD). Murine iNKT cells differentiate during thymic development into iNKT1, iNKT2, and iNKT17 sublineages, which differ transcriptomically and epigenomically and have subset-specific developmental requirements. Whether distinct iNKT sublineages also differ in their antitumor effect and their ability to suppress GVHD is currently unknown. In this work, we generated highly purified murine iNKT sublineages, characterized their transcriptomic and epigenomic landscape, and assessed specific functions. We show that iNKT2 and iNKT17, but not iNKT1, cells efficiently suppress T-cell activation in vitro and mitigate murine acute GVHD in vivo. Conversely, we show that iNKT1 cells display the highest antitumor activity against murine B-cell lymphoma cells both in vitro and in vivo. Thus, we report for the first time that iNKT sublineages have distinct and different functions, with iNKT1 cells having the highest antitumor activity and iNKT2 and iNKT17 cells having immune-regulatory properties. These results have important implications for the translation of iNKT cell therapies to the clinic for cancer immunotherapy as well as for the prevention and treatment of GVHD.
Introduction
Allogeneic hematopoietic cell transplantation (HCT) is a highly effective therapy for a broad range of life-threatening hematologic malignancies, genetic abnormalities, and bone marrow failure status. It is unfortunately, however, associated with significant morbidity and mortality related to transplant complications, namely acute graft-versus-host disease (GVHD) and immune deficiencies. During acute GVHD, the interaction with host tissues induces donor-derived T-cell activation, proliferation, and migration to target organs, notably skin, liver, and intestine, leading to cell damage and clinical manifestations.1 Preclinical murine models of GVHD strongly support the feasibility of selectively preventing GVHD by using cellular immunotherapy.
Invariant natural killer T (iNKT) cells are an innate lymphocyte population expressing a semi-invariant T-cell receptor that recognizes glycolipids presented in the context of the non-polymorphic molecule CD1d. Through modulation of innate and adaptive immune cells, iNKT cells display an extremely versatile panel of functions,2,3 ranging from antitumor effects to immune-regulatory activity. Experimental evidence in mice4-8 and observational studies in humans9,10 indicate that iNKT cells have the potential to suppress acute and chronic GVHD.11
It is now well established that murine iNKT cells differentiate during thymic development into at least 3 distinct sublineages, iNKT1, iNKT2, and iNKT17 cells; these sublineages are classified based on the expression of transcription factors and effector molecules.12-15 Several studies provided insights into the developmental requirements16-19 and molecular characteristics15,20,21 of the distinct iNKT sublineages, but no formal evidence of their functional heterogeneity exists. Therefore, whether one or multiple sublineages are suitable for antitumor and/or GVHD immunotherapy is not known.
In the current work, the molecular and functional heterogeneity of murine iNKT subsets was assessed and the function of iNKT1, iNKT2, and iNKT17 cells was tested with respect to their antitumor effects. Moreover, we assessed the ability of each iNKT cell sublineage to prevent GVHD in murine models of HCT. For the first time, we show that iNKT2 and iNKT17 cells, but not iNKT1 cells, display an immune-regulatory effect mitigating murine acute GVHD and that iNKT1 cells have the strongest antitumor effect.
Methods
Mice
BALB/cJ (H-2kd), C57Bl/6J (H-2kb), and FVB/NJ (H-2kq) mice were purchased from The Jackson Laboratory. Luc+ transgenic FVB/N L2G85 mice22 were bred at Stanford University. All animal experiments were approved by the Administrative Panel on Laboratory Animal Care at Stanford University.
Flow cytometric analysis
Reagents used for fluorescence-activated cell sorting (FACS) analysis are summarized in the supplemental Methods (available on the Blood Web site). Samples were acquired on a BD LSRII (BD Biosciences) and were analyzed by using FlowJo 10.5.0 (Tree Star).
Genomics analyses
Materials and methods used for genomics analyses are detailed in the supplemental Methods.
Isolation of iNKT sublineages
Single-cell suspensions from thymi harvested from 6- to 8-week-old FVB/N mice were incubated with biotinylated anti-CD19, anti-CD8a, anti-CD62L, anti-TCR-γδ, anti–GR-1, anti-Ter119, and streptavidin beads (BD) and negatively enriched. After staining with anti–inducible T-cell costimulator (ICOS), anti-CD27, anti–T-cell receptor (TCR)-β, anti-CD24, anti-CD4, anti–programmed cell death protein 1 (PD-1), streptavidin, and PBS-57–CD1d tetramer, cells were sorted on an FACSAria II (BD). Cell purity was assessed by FACS after transcription factor staining with anti-PLZF and anti-RORγT and was consistently >92%.
In vitro cytotoxicity assay
The CD1d-transduced A20 B-cell lymphoma cell line was a kind gift of Mitchell Kronenberg (La Jolla Institute for Immunology, La Jolla, CA). A20-CD1d cells were loaded for 4 hours with 250 ng/mL α-galactosylceramide (KRN7000, REGiMMUNE), washed, stained by using a CellTrace CFSE Proliferation Kit (Life Technologies), and plated in round bottom 96-well plates at 10 000 cells per well. FACS-sorted iNKT1, iNKT2, and iNKT17 cells were mixed with A20-CD1d cells at an effector:target ratio of 4:1. After 24 hours, cells were stained for CD19 and B220 and viability dye, and analyzed by FACS. iNKT-mediated cytotoxicity was calculated as percentage of death compared with A20-CD1d cells cultured alone.
In vivo tumor model
CD1d-transduced A20 B-cell lymphoma cells (2 × 10e4) resuspended in phosphate-buffered saline were injected intravenously by tail vein into alymphoid BALB/c Rag1−/− γC−/− mice or into sublethally (4.4 Gy) irradiated wild-type BALB/c mice. Sorted splenic CD4+ iNKT cells, iNKT1, iNKT2, or iNKT17 cells (5 × 10e4), were injected intravenously on the same day. Mice were monitored daily and euthanized if moribund or when lower limb paralysis appeared.
In vitro suppressive assay
CD4+ conventional T cells (Tcon) were enriched from splenocytes of luc+ FVB/N mice with CD4 MicroBeads (Miltenyi Biotec). After staining with a Violet Proliferation Kit (Life Technologies), cells were plated in a round bottom 96-well plate at a concentration of 30 000 cells per well with anti-CD3/anti-CD28 activation beads (1:1 ratio; Invitrogen). FACS-sorted iNKT1, iNKT2, and iNKT17 cells were mixed with CD4 Tcon at a 1:1 ratio. After 96 hours, cells were stained for CD25, ICOS, and fixable viability dye and analyzed by FACS. iNKT-mediated suppression was calculated as a percentage of reduction of mean number of cell cycles per cell compared with control cells cultured without iNKT cells.
Allogeneic bone marrow transplantation
Donor CD4+ and CD8+ conventional T cells (Tcon) were prepared from splenocytes of luc+ FVB/N mice and enriched with CD4 and CD8 MicroBeads (Miltenyi Biotec). Cell purity was consistently >95%. T-cell–depleted bone marrow (TCD-BM) was prepared by crushing bones from FVB/N mice and depleting T cells with CD4 and CD8 MicroBeads. BALB/c recipient mice were lethally irradiated with 8.8 Gy in 2 doses administered 4 hours apart. On the same day, 4 × 10⁶ TCD-BM cells and 1.0 × 10⁶ Tcon from luc+ FVB/N mice were injected intravenously. Sorted iNKT1, iNKT2, or iNKT17 cells were coinjected. Transplanted animals housed with food containing sulfamethoxazole and trimethoprim were monitored daily, and weight and GVHD scores23 were assessed weekly. Survival was analyzed by using the Kaplan-Meier method and log-rank test. Weight loss and GVHD clinical score were analyzed by 2-way analysis of variance with Bonferroni correction. A value of P < .05 was considered statistically significant. All transplant experiments were performed with sex-matched mice between 8 and 12 weeks of age.
Multiplex cytokine assays
Sera were collected from recipient mice on day 7 after transplantation. Cytokines were analyzed by using a multiplex assay system (Th1/Th2 Cytokine 11-Plex Mouse ProcartaPlex Panel; Invitrogen) and quantitated by using the Luminex 200 System (Luminex).
Histopathology
Tissues were fixed in 10% neutral buffered formalin. Tissue processing, staining with hematoxylin and eosin, and digital photomicrography were conducted by HistoWiz. Tissue sections were evaluated and scored for GVHD blindly by an experienced pathologist (N.K.) according to a previously published system.24
Statistical analysis
Statistical analyses were performed by using Prism 6 (GraphPad Software) and R 3.5.1 with R studio 1.1.453 (RStudio, Public Benefit Corporation).
Results
Single-cell RNA sequencing identifies surface molecules for isolation of highly purified iNKT sublineages
In agreement with previous reports,14 thymic iNKT from BALB/c mice, but not C57BL/6 mice, display sizeable populations of iNKT1, iNKT2, and iNKT17, defined by the differential expression of the transcription factors PLZF and RORγT (supplemental Figure 1A-B), whereas splenic iNKT cells were dominated by iNKT1 cells in both mouse strains (supplemental Figure 1A,C). Thymic iNKT cells from FVB/N mice displayed all 3 sublineages, with a slight dominance of iNKT2 cells, whereas splenic iNKT cells were mostly represented by iNKT1 cells. Given the distribution of iNKT sublineages, FVB/N thymi were selected as a cellular source.
We next performed single-cell RNA sequencing (scRNA-seq) on thymic FVB/N iNKT cells sorted from individual animals based on PBS57-loaded tetramer staining. The cells segregated into 3 clearly defined clusters expressing genes characteristic of iNKT1, iNKT2, and iNKT17 cells (Figure 1A). Expression of Tbx21, Zbtb16, and Rorc genes, encoding the key lineage-defining transcription factors T-Bet, PLZF, and RORγT, respectively, further confirmed the identities of the clusters (Figure 1B). iNKT1 cells expressed the highest levels of transcripts from genes associated with cytotoxic effector function (Nkg7, Gzma, and Ccl5), iNKT2 cells expressed the highest level of Il4, and iNKT17 cells preferentially expressed genes previously reported to identify Th17-like iNKT cells, namely Sdc1 (Figure 1C).
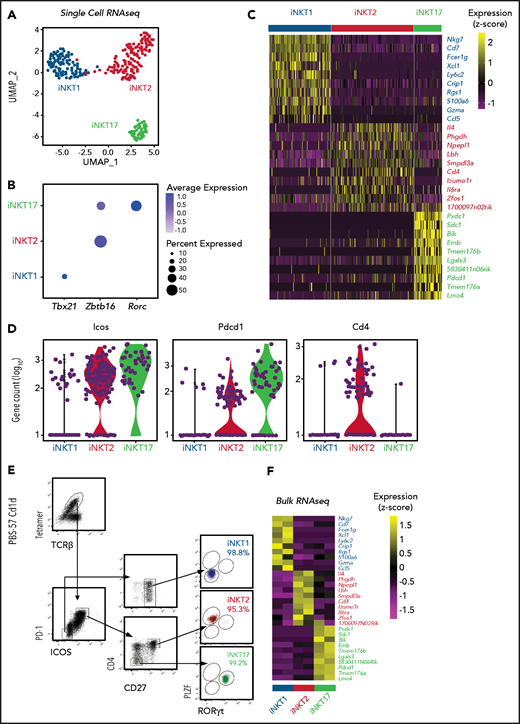
Identification of surface molecules for sorting of iNKT sublineages using scRNA-seq. (A) Uniform manifold approximation and projection (UMAP) plot of scRNA-seq data showing distinct clusters of iNKT cell subsets: iNKT1 (blue), iNKT2 (red), and iNKT17 (green) cells. (B) Dot-plot showing the proportion of cells (dot size) and the scaled (z score) gene expression of genes encoding for the iNKT sublineage-defining transcription factors T-Bet (Tbx21), PLZF (Zbtb16), and RORγT (Rorc). (C) Single‐cell heatmap representing the 10 most highly differentially expressed genes in thymic iNKT cell subsets. Expression for each gene is scaled (z scored) across single cells. (D) Normalized counts of Icos, Pdcd1, and Cd4 RNA expression. (E) FACS-sorting strategy for isolation of iNKT sublineages based on surface molecules starting from CD19–, CD8a–, CD62L–, TCRγδ–, GR-1–, Ter119–, and CD24– cells. Cell purity of FACS-sorted iNKT sublineages assessed by intranuclear staining for the transcription factors PLZF and RORγT. (F) Heatmap representing the 10 most highly differentially expressed genes identified in scRNA-seq analysis in bulk RNA-seq analysis performed on sorted populations. Expression for each gene is scaled (z scored) across single rows.
Identification of surface molecules for sorting of iNKT sublineages using scRNA-seq. (A) Uniform manifold approximation and projection (UMAP) plot of scRNA-seq data showing distinct clusters of iNKT cell subsets: iNKT1 (blue), iNKT2 (red), and iNKT17 (green) cells. (B) Dot-plot showing the proportion of cells (dot size) and the scaled (z score) gene expression of genes encoding for the iNKT sublineage-defining transcription factors T-Bet (Tbx21), PLZF (Zbtb16), and RORγT (Rorc). (C) Single‐cell heatmap representing the 10 most highly differentially expressed genes in thymic iNKT cell subsets. Expression for each gene is scaled (z scored) across single cells. (D) Normalized counts of Icos, Pdcd1, and Cd4 RNA expression. (E) FACS-sorting strategy for isolation of iNKT sublineages based on surface molecules starting from CD19–, CD8a–, CD62L–, TCRγδ–, GR-1–, Ter119–, and CD24– cells. Cell purity of FACS-sorted iNKT sublineages assessed by intranuclear staining for the transcription factors PLZF and RORγT. (F) Heatmap representing the 10 most highly differentially expressed genes identified in scRNA-seq analysis in bulk RNA-seq analysis performed on sorted populations. Expression for each gene is scaled (z scored) across single rows.
This analysis revealed several differentially expressed transcripts encoding cell surface–expressed molecules. In particular, Icos and Pdcd1 (encoding PD-1) were expressed at high levels in iNKT2 and iNKT17 cells, whereas they were barely detectable in iNKT1 cells (Figure 1D). In agreement with previous reports, iNKT1 and iNKT17 cells were almost devoid of Cd4 transcripts. Combining these molecules with others reported in the literature (CD2712 ), we developed a FACS-isolation strategy yielding highly purified iNKT sublineages, as confirmed by intracellular staining for RORγT and PLZF (Figure 1E). Bulk RNA-seq analysis of the sorted populations confirmed the distribution of differentially expressed genes identified by scRNA-seq (Figure 1F).
Assay for transposase-accessible chromatin sequencing reveals distinct chromatin accessibility profiles of iNKT sublineages
We next profiled the chromatin accessibility of the obtained iNKT sublineages using assay for transposase-accessible chromatin sequencing (ATAC-seq). Pairwise analyses showed that iNKT2 and iNKT17 cells had more accessibility differences compared with iNKT1 cells, with relatively fewer differences detected between iNKT2 and iNKT17 cells (Figure 2A). Hierarchical clustering further confirmed that iNKT2 and iNKT17 cells displayed closer chromatin accessibility profiles compared with iNKT1 cells (Figure 2B). Focusing on differential ATAC-seq peaks at promoter and transcription start sites for immunologically relevant genes, iNKT1 cells displayed increased accessibility at the interferon-γ (Ifng) locus as well as at the granzyme A (Gzma) and granzyme B (Gzmb) loci. In iNKT2 cells, we observed increased chromatin accessibility in the promoter of the gene encoding the T helper 2 (Th2)-chemokine receptor CCR4, as well as in Il4 promoter. Finally, iNKT17 cells selectively displayed increased chromatin accessibility at promoters of genes encoding Th17-related cytokines (Il17a and Il17f) and subset-specific cytokine receptors (Il1r1 and Il23r). iNKT1-specific chromatin accessibility regions were enriched for Runt-related and ETS-related-gene transcription factors as well as for T-bet and Eomes binding motifs (supplemental Figure 2), as previously reported.25 iNKT2-specific regions were enriched for GATA family transcription factor binding sites. Finally, iNKT17-specific regions were enriched for binding sites of the Th17-regulating factors RORγT and BATF. Collectively, these data reveal that each iNKT sublineage has distinct chromatin accessibility profiles and that iNKT2 and iNKT17 cells are more epigenomically similar to one another than to iNKT1 cells.

Analysis of the chromatin accessibility landscape in iNKT sublineages. (A) Volcano plots showing significance and log2 fold change of ATAC-seq peaks in pairwise comparisons between iNKT sublineages. Peaks colored in gray on volcano plots indicate a log2 fold change of −2 to +2 and/or an adjusted P value >.05. Peaks with a log2 fold change of less than −2 or >2 and an adjusted P value <.05 are colored according to the iNKT sublineage represented (iNKT1, blue; iNKT2, red; and iNKT17, green). Vertical dotted lines on volcano plots indicate a log2 fold change of 2; horizontal dotted line indicates an adjusted P value of .05. (B) Heatmap showing clusters for the top 2500 varying ATAC-seq peaks. Colors indicate z score of reads in each peak scaled to the mean across all iNKT cell subsets and replicates.
Analysis of the chromatin accessibility landscape in iNKT sublineages. (A) Volcano plots showing significance and log2 fold change of ATAC-seq peaks in pairwise comparisons between iNKT sublineages. Peaks colored in gray on volcano plots indicate a log2 fold change of −2 to +2 and/or an adjusted P value >.05. Peaks with a log2 fold change of less than −2 or >2 and an adjusted P value <.05 are colored according to the iNKT sublineage represented (iNKT1, blue; iNKT2, red; and iNKT17, green). Vertical dotted lines on volcano plots indicate a log2 fold change of 2; horizontal dotted line indicates an adjusted P value of .05. (B) Heatmap showing clusters for the top 2500 varying ATAC-seq peaks. Colors indicate z score of reads in each peak scaled to the mean across all iNKT cell subsets and replicates.
iNKT1 cells display epigenomic and transcriptomic potential for cytotoxic molecule production and exert the strongest antitumor effect in vitro and in vivo
We next examined chromatin accessibility and expression levels of genes encoding molecules involved in antitumor effects of iNKT cells.26 iNKT1 cells were the only subset displaying high promoter chromatin accessibility and active transcription of Gzmb and Prf1 (Figure 3A). Moreover, multiple peaks were specifically enriched in iNKT1 cells at putative distal regulatory regions for the Gzmb gene (supplemental Figure 3). The promoter of the gene encoding for Fas-ligand (Fasl), a key molecule in iNKT killing of tumor cells,26,27 was accessible in all three sublineages, but higher accessibility was detected in iNKT1. Similarly, we observed higher chromatin accessibility at putative distal regulatory regions both upstream and downstream of the Fasl gene in iNKT1 cells. Accordingly, iNKT1 cells uniquely expressed Fasl transcripts at detectable levels. To assess each iNKT sublineage cytotoxic activity against target tumor cells, we incubated sorted iNKT1, iNKT2, or iNKT17 cells together with α-galactosylceramide–loaded, CD1d-transduced murine A20 lymphoma cells. iNKT1 cells displayed significantly higher cytotoxic activity against CD1d-expressing A20 cells while iNKT2 and iNKT17 cells had minimal, if any, effect (Figure 3B). We next assessed the antitumor activity of iNKT sublineages in vivo. We first used spleen-derived CD4+ iNKT cells in a B-cell lymphoma model allowing the use of very low numbers of iNKT cells (supplemental Figure 4A). Low numbers of spleen-derived CD4+ iNKT cells (5 × 10e4) had no effect when coinjected with CD1d-expressing A20 cells (2 × 10e4) into Rag1−/− γC−/− BALB/c mice. Conversely, in a fully immune competent model of partial and transient lymphopenia induced by sublethal (4.4 Gy) irradiation, low-dose splenic CD4+ iNKT cells significantly extended animal survival (supplemental Figure 4B), indicating an interplay between adoptively transferred allogeneic iNKT cells and host cells. We then used this model to assess the in vivo antitumor potential of each iNKT sublineage. Invariant NKT1 cells significantly extended animal survival in this model, whereas upon adoptive transfer of iNKT2 cells and iNKT17 cells, we observed a trend toward improved survival that did not reach statistical significance (Figure 3C). Collectively, these results indicate that iNKT1 cells exert stronger antitumor activity than iNKT2 and iNKT17 cells both in vitro and in vivo.
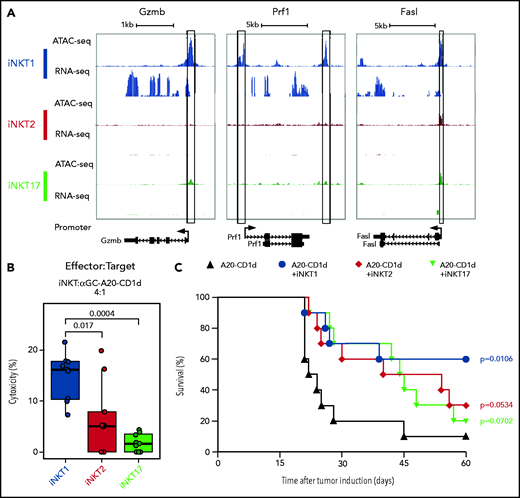
iNKT1, but not iNKT2 and iNKT17, cells display cytotoxic potential. (A) Genome tracks showing a comparison of ATAC-seq and RNA-seq profiles for genes encoding cytotoxic molecules in iNKT1 (blue), iNKT2 (red), and iNKT17 (green) cells. Data are merged from 2 biological replicates. Black boxes highlight differentially accessible ATAC-seq peaks. (B) In vitro cytotoxicity by iNKT sublineages against α-galactosylceramide (αGalCer)-loaded CD1d-transduced A20 lymphoma (A20-CD1d) cells after 24 hours of coculture (effector:target ratio of 4:1). Represented data are pooled from 3 independent experiments performed in triplicate. (C) Survival after A20-CD1d (2 × 10e4) cells intravenously injected into sublethally irradiated (4.4 Gy) wild-type BALB/c mice treated with iNKT cell subsets (5 × 10e4 cells; iNKT1, blue; iNKT2, red; iNKT17, green) or untreated (black). Results are pooled from 2 independent experiments with a total of 10 mice per group. Survival curves were plotted by using the Kaplan-Meier method and compared by using a log-rank test. P values are indicated when significant.
iNKT1, but not iNKT2 and iNKT17, cells display cytotoxic potential. (A) Genome tracks showing a comparison of ATAC-seq and RNA-seq profiles for genes encoding cytotoxic molecules in iNKT1 (blue), iNKT2 (red), and iNKT17 (green) cells. Data are merged from 2 biological replicates. Black boxes highlight differentially accessible ATAC-seq peaks. (B) In vitro cytotoxicity by iNKT sublineages against α-galactosylceramide (αGalCer)-loaded CD1d-transduced A20 lymphoma (A20-CD1d) cells after 24 hours of coculture (effector:target ratio of 4:1). Represented data are pooled from 3 independent experiments performed in triplicate. (C) Survival after A20-CD1d (2 × 10e4) cells intravenously injected into sublethally irradiated (4.4 Gy) wild-type BALB/c mice treated with iNKT cell subsets (5 × 10e4 cells; iNKT1, blue; iNKT2, red; iNKT17, green) or untreated (black). Results are pooled from 2 independent experiments with a total of 10 mice per group. Survival curves were plotted by using the Kaplan-Meier method and compared by using a log-rank test. P values are indicated when significant.
iNKT sublineages display different immune-regulatory effects in vitro
We next analyzed the potential of iNKT sublineages to produce cytokines. We detected the highest Ifng chromatin accessibility at the promoter site (Figure 4A) and at putative distal regulatory sites (supplemental Figure 5) in iNKT1 cells. We also detected high levels of Ifng transcripts in iNKT1 cells, whereas this transcript was virtually undetectable in iNKT2 and iNKT17 cells. Similar levels of Tnf accessibility and transcripts were detectable in all 3 sublineages. Regarding the Il4 locus, encoding for interleukin-4 (IL-4), a cytokine playing a crucial role in iNKT-mediated immune-regulation,4,23 iNKT2 displayed the highest chromatin accessibility at the promoter site and the highest levels of messenger RNA transcripts. We observed at this site enrichment for binding motifs of transcription factors with highest accessibility in iNKT2, including Gata3, Lef1, and Znf263. iNKT17 cells partially shared with iNKT2 cells an increased accessibility at the Il4 locus compared with iNKT1 cells, which expressed the lowest levels. Conversely, chromatin accessibility and generally limited transcripts were detectable at the IL-13 (Il13) locus in the 3 sublineages. Regarding Th17-related cytokines, both chromatin accessibility and transcription of Il17a and Il22 genes were restricted to iNKT17 cells.

iNKT sublineages display different in vitro suppressive potential. (A) Genome tracks showing a comparison of ATAC-seq and RNA-seq profiles for genes encoding cytokines in iNKT1 (blue), iNKT2 (red), and iNKT17 (green) cells. Data are merged from 2 biological replicates. Black boxes highlight differentially accessible ATAC-seq peaks. In vitro suppression assay of indicated iNKT sublineages. (B-C) Representative profiles (B) and summary (C) of violet tracer dilution as well as CD25 and ICOS expression of CD4 T cells stimulated with anti-CD3/anti-CD28 activation beads in the presence or absence of FACS-sorted iNKT1, iNKT2, and iNKT17 cells. Data are representative of 2 independent experiments. MFI, mean fluorescence intensity.
iNKT sublineages display different in vitro suppressive potential. (A) Genome tracks showing a comparison of ATAC-seq and RNA-seq profiles for genes encoding cytokines in iNKT1 (blue), iNKT2 (red), and iNKT17 (green) cells. Data are merged from 2 biological replicates. Black boxes highlight differentially accessible ATAC-seq peaks. In vitro suppression assay of indicated iNKT sublineages. (B-C) Representative profiles (B) and summary (C) of violet tracer dilution as well as CD25 and ICOS expression of CD4 T cells stimulated with anti-CD3/anti-CD28 activation beads in the presence or absence of FACS-sorted iNKT1, iNKT2, and iNKT17 cells. Data are representative of 2 independent experiments. MFI, mean fluorescence intensity.
We next tested the immune-regulatory abilities of the iNKT sublineages in vitro. The 3 iNKT sublineages displayed a mild but significant inhibitory effect on CD4 Tcon proliferation (Figure 4B-C, left panels). This effect was mainly independent from cell death induction by iNKT cells, as iNKT2 cells (but not iNKT1 and iNKT17 cells) induced a slight but significant reduction in CD4 Tcon viability (supplemental Figure 6A). Interestingly, iNKT2 cells, and to a lesser extent iNKT17 cells, inhibited CD25 and ICOS upregulation on CD4 Tcon, whereas we observed no phenotypic differences in CD4 Tcon cocultured with iNKT1 cells. Similarly, coculture with iNKT2 and iNKT17 cells, but not with iNKT1 cells, induced a significant reduction in the proportion of interferon-γ (IFN-γ)–expressing CD4 Tcon (supplemental Figure 6B). Conversely, coculture of iNKT1 cells was associated with a slight but significant increase in tumor necrosis factor-α (TNF-α)–expressing CD4 Tcon (supplemental Figure 6B). Collectively, these results show that distinct iNKT sublineages have different cytokine production potential and immune-regulatory effects in vitro.
iNKT2 and iNKT17 cells, but not iNKT1 cells, protect from acute murine GVHD
To assess in vivo the ability of each iNKT sublineage to protect from acute GVHD, we used a major histocompatibility complex mismatch murine model of acute GVHD, in which sorted FVB/N iNKT1, iNKT2, or iNKT17 (5 × 10⁴) cells were injected together with luciferase-expressing FVB/N Tcon (1 × 10⁶; Tcon/iNKT ratio of 20:1) and TCD-BM cells (4 × 10⁶) into lethally irradiated BALB/c mice. Compared with mice that only received Tcon, mice that received iNKT2 or iNKT17 cells displayed a significant survival benefit (Figure 5A), whereas those that received iNKT1 cells showed no survival benefit. In addition, weight and GVHD score were also improved in the groups that received iNKT2 or iNKT17 cells compared with mice that received iNKT1 cells. Importantly, transfer of as few as 1 × 10⁴ (Tcon/iNKT ratio of 100:1) iNKT2 cells, but not iNKT1 or iNKT17 cells, were able to significantly suppress GVHD (Figure 5B). No significant differences were observed in cell proliferation, activation marker expression (ICOS and CD25), or cytokine production (TNF-α and IFN-γ) in CD4 and CD8 Tcon cells recovered from mice transplanted in the presence or absence of different iNKT sublineages (data not shown). Similarly, we did not observe any significant difference in serum levels of proinflammatory cytokines, including IFN-γ, TNF-α, IL-2, IL-6, and IL-18 (Figure 5C). Conversely, iNKT1 treatment was associated with a significant reduction in the Th2-like cytokines IL-5 and IL-13. These results indicate a different balance between Th1 and Th2 cytokines during GVHD depending on the iNKT sublineage administered. Collectively, these results indicate that iNKT2, and to a lesser extent iNKT17, but not iNKT1, exerted significant immune-regulatory function in a murine model of acute GVHD.
![iNKT2 and iNKT17 cells protect from GVHD, whereas iNKT1 cells have no suppressive potential. (A) BALB/c recipient mice were irradiated with 2 × 4.4 Gy, followed by transplantation of 4 × 10⁶ TCD-BM cells and 1.0 × 10⁶ Tcon from luc+ FVB/N donor mice. In addition, 5 × 10⁴ FACS-sorted iNKT1, iNKT2, or iNKT17 cells from FVB/N donors were transferred together with the graft. Shown are the survival curve (left graph), weight (middle graph), and GVHD score (right graph). Data are pooled from 3 independent experiments with a total of 15 mice per group (except irradiation control, n = 10). Error bars indicate standard error of the mean. (B) BALB/c recipient mice were transplanted as aforementioned, and 1 × 10⁴ FACS-sorted iNKT1, iNKT2, or iNKT17 cells from FVB/N donors were transferred together with the graft. The survival graph is depicted on the left; the data are pooled from 3 independent experiments with a total of 20 mice per group (except total body irradiation [TBI, n = 10] and BM [n = 15]). For weight (middle graph) and GVHD score (right graph), data are pooled from 2 independent experiments with 10 mice per group. Error bars indicate standard error of the mean. (C) Serum Th1/Th2 cytokine levels (IFN-γ, TNF-α, IL-2, IL-6, IL-18, IL-5, and IL-13) at day 7 from transplanted mice are shown (n = 6-8 in each group). P values are indicated when significant. *P < .05; **P < .01; ***P < .001. BMT, BM transplantation.](https://ash.silverchair-cdn.com/ash/content_public/journal/blood/138/10/10.1182_blood.2021010887/4/m_bloodbld2021010887f5.png?Expires=1765886587&Signature=koR3wc0~1yh90698yookQzJZQaEVxj2Zh0Sojc7t3NHtRRPNIWhjaCatpJD3pYTu-CAepIMwgZhb7vbSO3GGbHZU690SV0uvBJX-BI6KAwkUAAwXsux-CZhTEypl8ovjOyrfDUqCufHG3klJNSCKH-qeEjsoWQn03DEaWWBtDoTcOjCyPH7-qUWOVD1xu3iPoAAke9Kju8kr0lYxLZ0oXaEq-oHpPE4lAOc4B1Ng87S5Cj~7XaTEl4uRfaNY89PyphijrKGitCIbjr7Qs0HC9HBCfS-BXp98PBXarV4ArxFee5d4JKCP0OAgZBpGNM6eF3M9YfFv0NqWNx-rzmJehA__&Key-Pair-Id=APKAIE5G5CRDK6RD3PGA)
iNKT2 and iNKT17 cells protect from GVHD, whereas iNKT1 cells have no suppressive potential. (A) BALB/c recipient mice were irradiated with 2 × 4.4 Gy, followed by transplantation of 4 × 10⁶ TCD-BM cells and 1.0 × 10⁶ Tcon from luc+ FVB/N donor mice. In addition, 5 × 10⁴ FACS-sorted iNKT1, iNKT2, or iNKT17 cells from FVB/N donors were transferred together with the graft. Shown are the survival curve (left graph), weight (middle graph), and GVHD score (right graph). Data are pooled from 3 independent experiments with a total of 15 mice per group (except irradiation control, n = 10). Error bars indicate standard error of the mean. (B) BALB/c recipient mice were transplanted as aforementioned, and 1 × 10⁴ FACS-sorted iNKT1, iNKT2, or iNKT17 cells from FVB/N donors were transferred together with the graft. The survival graph is depicted on the left; the data are pooled from 3 independent experiments with a total of 20 mice per group (except total body irradiation [TBI, n = 10] and BM [n = 15]). For weight (middle graph) and GVHD score (right graph), data are pooled from 2 independent experiments with 10 mice per group. Error bars indicate standard error of the mean. (C) Serum Th1/Th2 cytokine levels (IFN-γ, TNF-α, IL-2, IL-6, IL-18, IL-5, and IL-13) at day 7 from transplanted mice are shown (n = 6-8 in each group). P values are indicated when significant. *P < .05; **P < .01; ***P < .001. BMT, BM transplantation.
iNKT2 and iNKT17 cells protect from GVHD, whereas iNKT1 cells have no suppressive potential. (A) BALB/c recipient mice were irradiated with 2 × 4.4 Gy, followed by transplantation of 4 × 10⁶ TCD-BM cells and 1.0 × 10⁶ Tcon from luc+ FVB/N donor mice. In addition, 5 × 10⁴ FACS-sorted iNKT1, iNKT2, or iNKT17 cells from FVB/N donors were transferred together with the graft. Shown are the survival curve (left graph), weight (middle graph), and GVHD score (right graph). Data are pooled from 3 independent experiments with a total of 15 mice per group (except irradiation control, n = 10). Error bars indicate standard error of the mean. (B) BALB/c recipient mice were transplanted as aforementioned, and 1 × 10⁴ FACS-sorted iNKT1, iNKT2, or iNKT17 cells from FVB/N donors were transferred together with the graft. The survival graph is depicted on the left; the data are pooled from 3 independent experiments with a total of 20 mice per group (except total body irradiation [TBI, n = 10] and BM [n = 15]). For weight (middle graph) and GVHD score (right graph), data are pooled from 2 independent experiments with 10 mice per group. Error bars indicate standard error of the mean. (C) Serum Th1/Th2 cytokine levels (IFN-γ, TNF-α, IL-2, IL-6, IL-18, IL-5, and IL-13) at day 7 from transplanted mice are shown (n = 6-8 in each group). P values are indicated when significant. *P < .05; **P < .01; ***P < .001. BMT, BM transplantation.
Transcriptomic analysis of Tcon during GVHD reveals differential immune-modulation induced by iNKT sublineages
To gain further insights into the functional heterogeneity of iNKT sublineages in GVHD prevention, we performed RNA-seq analysis on CD4 and CD8 Tcon recovered at day 7 after HCT with or without iNKT sublineages. Principal component analysis clearly segregated CD4 and CD8 Tcon recovered from recipients treated with iNKT cells from untreated mice along PC1 (Figure 6A-B). iNKT cell treatment was associated with higher transcription of genes encoding the immunomodulatory cytokine receptor Il27ra, as well as of the transcription factor Stat, and reduced transcription of genes encoding Ctla4 and Il18r1, as well as chemokine receptors such as Ccc9 in CD4 Tcon and Ccr2 in CD8 Tcon cells. Differential impact of different iNKT sublineages on Tcon transcriptome was revealed by principal component 2 that explained 14% and 21% of the variance in CD4 and CD8 Tcon, respectively. iNKT1-treated CD4 (Figure 6A,C) and CD8 (Figure 6B,D) Tcon segregated separately from iNKT2- and iNKT17-treated cells that were partially overlapping, especially for CD8 T cells. Gene Set Enrichment Analysis for Hallmark gene sets revealed that iNKT2 and iNKT17 cells, but not iNKT1 cells, induced a significant reduction in G2M checkpoint and mitotic spindle gene sets in CD4 Tcon, whereas only iNKT2 cells suppressed the mitotic spindle gene sets in CD8 Tcon (supplemental Figure 7A-B).

Adoptive transfer of distinct iNKT subsets differentially affect CD4 and CD8 Tcon transcriptome during murine acute GVHD. RNA-seq analysis of CD4 (A,C) and CD8 (B,D) Tcon recovered at day 7 post-HCT from animals treated with the indicated iNKT sublineages (untreated, gray; iNKT1, blue; iNKT2, red; iNKT17, green). (A-B) Principal component analysis of transcriptome based on the top 500 differentially expressed genes across all samples. (C-D) Heatmap and hierarchical clustering based on the 500 most highly differentially expressed genes across all samples. Immune-related genes are highlighted. Expression for each gene is scaled (z scored) across single rows. Analysis was performed on 3 biological replicates from 2 independent experiments.
Adoptive transfer of distinct iNKT subsets differentially affect CD4 and CD8 Tcon transcriptome during murine acute GVHD. RNA-seq analysis of CD4 (A,C) and CD8 (B,D) Tcon recovered at day 7 post-HCT from animals treated with the indicated iNKT sublineages (untreated, gray; iNKT1, blue; iNKT2, red; iNKT17, green). (A-B) Principal component analysis of transcriptome based on the top 500 differentially expressed genes across all samples. (C-D) Heatmap and hierarchical clustering based on the 500 most highly differentially expressed genes across all samples. Immune-related genes are highlighted. Expression for each gene is scaled (z scored) across single rows. Analysis was performed on 3 biological replicates from 2 independent experiments.
Interestingly, iNKT1 cells, but not iNKT2 or iNKT17 cells, induced a downregulation of genes of the oxidative phosphorylation set both in CD4 and CD8 Tcon. iNKT2 and iNKT17 cells induced further upregulation of Il27ra and further downregulation of Il18r1 in Tcon compared with Tcon treated with iNKT1 cells (Figure 6C-D). In addition, iNKT2 and iNKT17 cells induced the downregulation of genes encoding cytokine receptors and integrins involved in Tcon migration to target tissues, including Itgam in CD4 and Ccr2, and Itga4 and Itga1 in CD8 Tcon. Importantly, iNKT sublineage administration did not prevent the upregulation of gene sets involved in T-cell effector responses, namely Th1 differentiation of CD4 T cells (supplemental Figure 7C-D) and cytotoxicity of CD8 T cells (supplemental Figure 7E-F). Collectively, these results indicate that distinct iNKT sublineages differentially modulate Tcon transcriptome.
iNKT2 and iNKT17 cells, but not iNKT1 cells, reduce intestinal tissue damage during murine acute GVHD
We next aimed to confirm at the protein level the differential modulation of molecules by different iNKT sublineages. We first focused our attention on the gene encoding for IL-18Rα, a molecule essential for IL-18 signaling and for sustaining IFN-γ transcription crucial in GVHD.28 iNKT2 and iNKT17 cells, but not iNKT1 cells, significantly suppressed IL-18Rα expression at CD8 and even more at the CD4 Tcon cell surface (Figure 7A). Next, we analyzed the surface expression of CD49d or integrin α4, encoded by the Itgam gene and necessary for the constitution of the α4β1 integrin, recently reported to play a crucial role in T-cell migration to GVHD-target tissues.29 As shown in Figure 7B, iNKT2 and iNKT17 cells, but not iNKT1 cells, induced a significant downregulation in CD49d expression in CD4 Tcon, with iNKT2 cells also having a significant impact on CD49d levels on CD8 Tcon cells.

iNKT2 and iNKT17 cells inhibit IL-18Rα and CD49d expression and prevent tissue damage during murine acute GVHD. IL-18Rα (A) and CD49d (B) expression at the surface of CD4 (upper panels) and CD8 (lower panels) Tcon recovered at day 7 after HCT from spleen of mice treated with different iNKT sublineages (untreated, gray; iNKT1, blue; iNKT2, red; iNKT17, green). Representative FACS histograms (left panels) and summary bar plots (right panels) are shown. Data are pooled from 2 independent experiments with 3 to 5 mice per group. (C) Representative photomicrographs of hematoxylin and eosin–stained sections of small intestine and colon (×200) collected 7 days after transplantation from indicated groups. GVHD tissue damage manifests as inflammation (open arrow), crypt apoptosis (solid arrow), and crypt loss (solid asterisk). Histopathologic GVHD score (consisting of scores for crypt apoptosis and inflammation) for small intestine and colon for the indicated groups. Data are pooled from 2 independent experiments with a total of 6 mice per group. P values are indicated when significant.
iNKT2 and iNKT17 cells inhibit IL-18Rα and CD49d expression and prevent tissue damage during murine acute GVHD. IL-18Rα (A) and CD49d (B) expression at the surface of CD4 (upper panels) and CD8 (lower panels) Tcon recovered at day 7 after HCT from spleen of mice treated with different iNKT sublineages (untreated, gray; iNKT1, blue; iNKT2, red; iNKT17, green). Representative FACS histograms (left panels) and summary bar plots (right panels) are shown. Data are pooled from 2 independent experiments with 3 to 5 mice per group. (C) Representative photomicrographs of hematoxylin and eosin–stained sections of small intestine and colon (×200) collected 7 days after transplantation from indicated groups. GVHD tissue damage manifests as inflammation (open arrow), crypt apoptosis (solid arrow), and crypt loss (solid asterisk). Histopathologic GVHD score (consisting of scores for crypt apoptosis and inflammation) for small intestine and colon for the indicated groups. Data are pooled from 2 independent experiments with a total of 6 mice per group. P values are indicated when significant.
To assess whether the iNKT17 cell immune-modulation observed in mice receiving iNKT2 and iNKT17 cells was associated with reduced damage at GVHD target sites, we performed a histopathologic analysis of the small intestine and colon at day 7 after transplantation. We found that recipients receiving iNKT2 and to a lesser extent iNKT17 cells displayed reduced composite GVHD pathology scores compared with recipients of conventional T cells alone, whereas iNKT1 cells did not display any significant effect (Figure 7C). Collectively, these results indicate that iNKT2 and iNKT17 cells, but not iNKT1 cells, suppress pathways involved in GVHD pathophysiology, including IL-18R and CD49d expression, and reduce intestinal tissue damage in a murine model of acute GVHD.
Discussion
iNKT cells are a cell subset with pleiotropic functions ranging from cytotoxic effects to immune-regulatory activity. The demonstration of the existence of iNKT sublineages expressing distinct transcription factors and cytokines12 provided a potential explanation for iNKT cell pleiotropic activity. However, our knowledge of the functions of iNKT sublineages has been limited to observational studies,30-33 and formal demonstration of their distinct functional roles has been missing. The current study shows, for the first time, that distinct iNKT cell sublineages display differential effector and immune-regulatory functions.
Our analyses of the potential to produce cytotoxic molecules, as well as the in vitro and in vivo tumor models, point to a preferential cytotoxic activity by iNKT1 cells compared with iNKT2 and iNKT17 cells. These results are in agreement with previous studies reporting the unique ability of iNKT1 cells to produce granzyme B upon short-term stimulation.34 Moreover, after establishing an in vivo B-cell lymphoma model allowing for the analysis of the antitumor immunomodulatory effect of iNKT cells, we showed that iNKT1 cells display also the highest antitumor potential in vivo (Figure 3C).
iNKT cells have been reported to regulate GVHD through IL-4 production4,35 and cytotoxic activity against recipient antigen-presenting cells.8 We found that iNKT2 and iNKT17 cells, but not iNKT1 cells, are able to mitigate GVHD induced by allogeneic Tcon. According to our genomic analysis, iNKT2, and to a lesser extent iNKT17, displayed higher chromatin accessibility at the Il4 promoter site and detectable messenger RNA transcripts ex vivo, pointing to both cell subsets as potential IL-4 producers. These data are in agreement with the report from Georgiev et al,34 which showed that iNKT2 and iNKT17 produce IL-4 at the protein level.
We can therefore speculate that IL-4 production ability by iNKT2 and iNKT17 is a key mechanism in their GVHD suppressive activity, although this hypothesis could not be experimentally tested as IL-4 signaling is necessary for physiological development of iNKT cell sublineages (Jung-Hyun Park, National Cancer Institute, oral presentation, 28 September 2016), and IL-4−/− cells therefore cannot be used for this purpose. Conversely, despite their higher cytotoxic potential, iNKT1 cells did not display any significant impact on GVHD progression. This scenario suggests that dendritic cell cytotoxicity might not be a major mechanism of suppression in our mouse model, although the paucity of dendritic cells after transplantation did not allow us to experimentally assess this hypothesis.
Our transcriptomic analysis points to some gene sets modulated by all iNKT subsets, including upregulation of the immunomodulatory cytokine receptor Il27ra as well as downregulation of Ctla4. At the same time, the analysis reveals the preferential modulation of cell cycle genes by iNKT2 and iNKT17 cells. Moreover, some pathways important for GVHD pathogenesis such as the IL-18/IL-18Rα axis, necessary for IFN-γ transcription induction and maintenance in GVHD,28 and CD49d/integrin α4 expression, crucial for T-cell migration to GVHD-target tissues,29 were preferentially modulated by the administration of iNKT2 and iNKT17 cells. Interestingly, iNKT1 cells seemed to downregulate Tcon gene sets involved in oxidative phosphorylation, suggesting the induction of a metabolic switch toward glycolysis, a proinflammatory metabolic state in GVHD.36,37 Collectively, our data confirm at the transcriptomic level that distinct iNKT sublineages differentially affect Tcon during GVHD and increase our knowledge about mechanisms involved in GVHD prevention by iNKT cells.
Finally, differences in iNKT sublineage tissue migration might contribute to the differences in GVHD suppression. It is well established that iNKT sublineages have tissue-specific distribution at steady state,14 and whether this might influence their immunotherapeutic potential remains to be investigated.
Recently, Erkers et al38 reported an extensive characterization of human iNKT heterogeneity and identified a CD4–CD94+ population with iNKT1-like properties and a CD4+ population producing higher levels of IL-4. Due to the paucity of iNKT cells in human peripheral blood, current clinical trials using iNKT cells involve in vitro expansion protocols (#NCT03605953). The demonstration that iNKT2 and to a lesser extent iNKT17 cells, but not iNKT1 cells, protect from murine GVHD suggest that in vitro expansion protocols allowing the preservation or acquisition of the IL-4–producing, Th2-like phenotype should be preferred for GVHD suppression over protocols inducing a more cytotoxic cell profile that would be more suitable for antitumor applications. We provide the first complete chromatin accessibility atlas of all 3 iNKT sublineages associated with paired transcriptomic analysis. We believe that this transcriptomic and epigenomic atlas of murine iNKT sublineages will be a valuable resource to guide the development of iNKT cellular products for immunotherapy.
In summary, this study provides a formal demonstration of differential functions exerted by different iNKT sublineages. Our findings have important implications to orient clinical translation of iNKT-based therapies.
Acknowledgments
The authors thank Dhananjay Wagh, Xuhuai Ji, and John Coller at the Stanford Functional Genomics Facility for their excellent technical assistance in the genomics analysis. In addition, the authors acknowledge Mitchell Kronenberg for the kind gift of the A20-CD1d cell line.
This work was supported by grants from the National Institutes of Health (NIH) (National Heart, Lung, and Blood Institute, P01 HL075462, and the National Cancer Institute, R01 CA23158201, R.S.N.; National Human Genome Research Institute, RM1-HG007735, H.Y.C.), the German Cancer Aid (Mildred Scheel Postdoctoral Fellowship, K.M.-B. and J.K.L.), the Geneva University Hospitals Fellowship (F.S.), the Swiss Cancer League (BIL KLS 3806-02-2016, F.S.), the Fondation de Bienfaisance Valeria Rossi di Montelera (Eugenio Litta Fellowship, F.S.), the American Society for Blood and Marrow Transplantation (New Investigator Award 2018, F.S.), the Dubois-Ferrière-Dinu-Lipatti Foundation, F.S., the National Science Foundation (Graduate Research Fellowship DGE‐114747, J.V.R.), the American Association for Cancer Research (Millennium Fellowship in Lymphoma Research 15-40-38-ALVA, M.A.), the St. Baldrick’s Fellowship with generous support from the Rays of Hope Hero Fund (M.M.), and the Parker Institute for Cancer Immunotherapy (H.Y.C.). H.Y.C. is an Investigator of the Howard Hughes Medical Institute. Flow cytometry analysis for this project was conducted on instruments in the Stanford Shared FACS Facility purchased by using an NIH S10 Shared Instrumentation Grant (S10RR027431-01). Sequencing was performed on instruments in the Stanford Functional Genomics Facility, including the Illumina HiSeq 4000 purchased by using an NIH S10 Shared Instrumentation Grant (S10OD018220).
Authorship
Contribution: F.S., K.M.-B., T.H., and R.S.N. conceived and designed the study; K.M.-B., J.K.L., F.S., T.H., T.L.R., A.S.W., F.M.F., U.M.L., P.-Y.L., M.M., and J.B. performed the experiments; F.S., K.M.B., J.K.L., F.M.F., J.V.R., K.E.Y., A.S.W., N.K., and H.Y.C. analyzed the data; F.S., K.M.-B., J.K.L., T.H., F.M.F., J.V.R., K.E.Y., A.S.B., H.Y.C., and R.S.N. contributed to the interpretation of results; F.S., K.M.-B., and R.S.N. wrote the manuscript; F.S. and R.S.N. supervised the research; and all authors read and approved the submitted version of the manuscript.
Conflict-of-interest disclosure: H.Y.C. is a cofounder of Accent Therapeutics and Boundless Bio; and is an advisor to 10x Genomics, Arsenal Biosciences, and Spring Discovery. The remaining authors declare no competing financial interests.
Correspondence: Federico Simonetta and Robert S. Negrin, Division of Blood and Marrow Transplantation, Department of Medicine, Stanford University School of Medicine, Center for Clinical Sciences Research Building, 269 W. Campus Dr, Stanford, CA 94305; e-mails: federico.simonetta@unige.ch or negrs@stanford.edu.
Relevant data can be found in the Gene Expression Omnibus database (accession number GSE172169; https://www.ncbi.nlm.nih.gov/geo/query/acc.cgi?acc=GSE172169).
The online version of this article contains a data supplement.
There is a Blood Commentary on this article in this issue.
The publication costs of this article were defrayed in part by page charge payment. Therefore, and solely to indicate this fact, this article is hereby marked “advertisement” in accordance with 18 USC section 1734.

This feature is available to Subscribers Only
Sign In or Create an Account Close Modal