

Key Points
Utx deficiency genetically compromises various metabolic and signaling pathways and phenotypically induces hematopoietic aging.
UTX maintains hematopoietic stem cell function via both demethylase-dependent and -independent epigenetic programming.

Abstract
Epigenetic regulation is essential for the maintenance of the hematopoietic system, and its deregulation is implicated in hematopoietic disorders. In this study, UTX, a demethylase for lysine 27 on histone H3 (H3K27) and a component of COMPASS-like and SWI/SNF complexes, played an essential role in the hematopoietic system by globally regulating aging-associated genes. Utx-deficient (UtxΔ/Δ) mice exhibited myeloid skewing with dysplasia, extramedullary hematopoiesis, impaired hematopoietic reconstituting ability, and increased susceptibility to leukemia, which are the hallmarks of hematopoietic aging. RNA-sequencing (RNA-seq) analysis revealed that Utx deficiency converted the gene expression profiles of young hematopoietic stem-progenitor cells (HSPCs) to those of aged HSPCs. Utx expression in hematopoietic stem cells declined with age, and UtxΔ/Δ HSPCs exhibited increased expression of an aging-associated marker, accumulation of reactive oxygen species, and impaired repair of DNA double-strand breaks. Pathway and chromatin immunoprecipitation analyses coupled with RNA-seq data indicated that UTX contributed to hematopoietic homeostasis mainly by maintaining the expression of genes downregulated with aging via demethylase-dependent and -independent epigenetic programming. Of note, comparison of pathway changes in UtxΔ/Δ HSPCs, aged muscle stem cells, aged fibroblasts, and aged induced neurons showed substantial overlap, strongly suggesting common aging mechanisms among different tissue stem cells.
Introduction
Covalent modifications of histone tails, such as methylation, acetylation, and ubiquitination play essential roles in appropriate cell fate decisions. Trimethylated H3K27 (H3K27me3) is regarded as a repressive histone mark that functions in gene silencing.1 H3K27 methylation is mediated by polycomb repressive complex 2 (PRC2), which comprises the catalytic subunit EZH2 and at least 2 noncatalytic subunits, EED and SUZ12.2 On the other hand, demethylation of H3K27 is regulated by 2 distinct enzymes: ubiquitously transcribed tetratricopeptide repeat, chromosome X (UTX), also known as KDM6A, and Jumonji-C (JmjC) domain-containing protein-3 (JMJD3), also known as KDM6B,3,4 both of which contain the JmjC domain, which exerts the demethylase activity.3,4 However, unlike JMJD3, UTX possesses the tetratricopeptide repeat (TPR) domain that mediates protein-protein interactions and functions as a component of COMPASS (complex of proteins associated with Set 1)-like and SWI/SNF complexes.5-8
UTX is an X-chromosome–specific enzyme, and the male counterpart is on the Y chromosome, named ubiquitously transcribed tetratricopeptide repeat gene, Y chromosome (UTY), also known as KDM6C.3,4 UTX and UTY have a high structural similarity, including in the TPR and JmjC domains4 ; however, UTY possesses very low demethylase activity.4,9 Knockout studies for UTX demonstrated that Utx-deficient female mice died in utero but Utx-deficient male mice possessing the Uty gene survived embryogenesis, indicating that UTY can compensate for the function of UTX during development.10,11
UTX contributes to various biological processes: it regulates body patterning by binding to Hoxb1 promoter,3,12 promotes myogenesis by demethylating muscle-specific genes,13 determines cell fate by controlling the retinoblastoma pathway,14 supports cardiac development during embryogenesis,15 regulates hematopoietic cell migration,16 plays essential roles in embryonic stem cell differentiation,17,18 and coordinates steroid hormone-mediated autophagy.19 In addition, UTX plays demethylase-independent roles in T-box factor–mediated gene expression, mesoderm differentiation of embryonic stem cells, and prenatal development.8,10,20-22
UTX dysfunction has been identified in human diseases. Somatic inactivating mutations of Utx were identified in various human malignancies.23-30 In addition, functional loss of Utx was reported to contribute to drug resistance and disease relapse.31,32 These findings indicated that UTX functions as a cell-fate determinant, as well as a tumor suppressor; however, its role(s) in the hematopoietic system remains to be fully understood. In this study, by generating and analyzing Utx-deficient mice, we found that UTX plays essential roles in the functional integrity of hematopoietic stem-progenitor cells (HSPCs) by globally regulating aging-associated genes.
Methods
Mice
The procedures for construction of the targeting vector and generation of Utx conditional knockout mice are described in the supplemental Information, available on the Blood Web site. All the animal experiments were performed in accordance with the recommendations in the Guide for the Care and Use of Laboratory Animals of Hiroshima University Animal Research Committee (permission no. 25-107) and Tokyo Women’s Medical University (permission no. GE 19-066).
Statistics
Mouse survival curves were constructed by using the Kaplan–Meier methodology and compared by using the log-rank test, using GraphPad Prism software. Other statistical analyses were performed using the Student t test, unless otherwise stated.
A complete and detailed description of the methods is provided in the supplemental Methods.
Results
Acquired deficiency of UTX-induced abnormal hematopoietic parameters with dysplasia
To conditionally abrogate UTX function, we generated mice in which exons 11 and 12 of the Utx gene were flanked by 2 loxP sites and crossed them with tamoxifen-inducible ERT2Cre+ mice (supplemental Figure 1A). Utx is an X-chromosome–specific gene with a male counterpart, Uty; hence, the results of crossing were sex dependent, producing Utxflox/flox, ERT2Cre+ females and Utxflox/Uty, ERT2Cre+ males. Quantitative polymerase chain reaction (PCR) and western blot analysis of bone marrow (BM) cells showed that, in tamoxifen-treated females, Utx mRNA and UTX protein were almost completely absent in Utxflox/flox, ERT2Cre+ (UtxΔ/Δ) mice compared with Utxflox/flox, ERT2Cre– (Utx+/+) mice, whereas in tamoxifen-treated males, Uty messenger RNA and UTY protein were comparable in Utxflox/Uty, ERT2Cre– (Utx+/Uty) and Utxflox/Uty, ERT2Cre+ (UtxΔ/Uty) mice (supplemental Figure 1B; primer sequences for quantitative PCR are listed in supplemental Table 1). In addition, immunofluorescent staining of long-term hematopoietic stem cells (LT-HSCs) [for surface markers of hematopoietic stem-progenitor cell (HSPC) subfractions, see supplemental Table 2] of Utx+/+, Utx+/Δ, and UtxΔ/Δ females and of Utx+/Uty and UtxΔ/Uty males exhibited graded and significant increases in H3K27me3 levels, along with Utx deficiency, confirming that UTX functions as a demethylase for H3K27 in primitive HSCs (supplemental Figure 1C).
Then, we analyzed hematopoietic parameters in the peripheral blood (PB), BM, and spleen in Utx+/+, Utx+/Δ, and UtxΔ/Δ females and also in Utx+/Uty and UtxΔ/Uty males. Although no obvious changes were observed in Utx+/+ and Utx+/Δ mice, UtxΔ/Δ mice exhibited a significant increase in white blood cell (WBC) count, mainly of myeloid-lineage (Mac1+). A significant decrease was noted in platelets in the PB (Figure 1A, top); significant increases in LT-HSCs, short-term HSCs (ST-HSCs), and Mac1+ cells and significant decreases in T-lineage (Thy1.2+) and erythroid-lineage (Ter119+) cells in the BM (Figure 1A, middle); significant increases in LSK cells (LSKs), LT-HSCs, common myeloid progenitor cells, granulocyte-monocyte progenitor cells, and Mac1+ cells and a significant decrease in Thy1.2+ cells in the spleen (Figure 1A, bottom). Compared with UtxΔ/Δ mice, the changes in UtxΔ/Uty mice were less evident, showing an increase in WBC count in the PB, an increase in common myeloid progenitor cells, and a decrease in Thy1.2+ cells in the BM, and increases in LT-HSCs, granulocyte-monocyte progenitor cells, and Mac1+ cells in the spleen (supplemental Figure 2A).
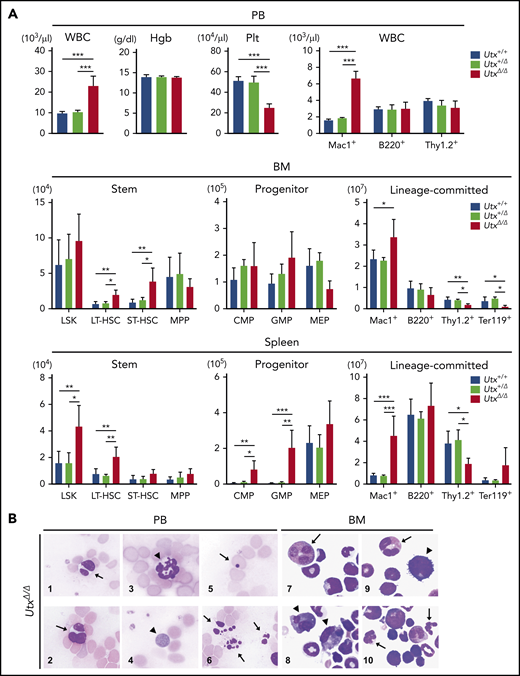
Analysis of hematopoietic parameters and morphological changes in Utx-deficient mice. (A) Analysis of hematopoietic parameters in the PB (top), BM (middle), and spleen (bottom) of Utx+/+, Utx+/Δ, and UtxΔ/Δ female mice. Hgb: hemoglobin concentration, Plt: platelet number. *P < .05; **P < .01; ***P < .001; comparison of Utx+/+, Utx+/Δ, and UtxΔ/Δ mice, assessed with a 1-way analysis of variance followed by Tukey’s test. (B) Morphological changes of hematopoietic cells in the PB (panels 1-6) and BM (panels 7-10) of UtxΔ/Δ mice. WBCs with abnormal nuclei (panels 1-3), including Pseudo Pelger-Huët anomalies (arrows) and hypersegmentation (arrowhead). A giant platelet (panel 4, arrowhead). An erythrocyte with a Howell-Jolly body (panel 5, arrow). Apoptotic cells (panel 6, arrows). Myeloid progenitor cells with abnormal nuclei and micromegakaryocytes (panels 7-10, arrows and arrowheads, respectively).
Analysis of hematopoietic parameters and morphological changes in Utx-deficient mice. (A) Analysis of hematopoietic parameters in the PB (top), BM (middle), and spleen (bottom) of Utx+/+, Utx+/Δ, and UtxΔ/Δ female mice. Hgb: hemoglobin concentration, Plt: platelet number. *P < .05; **P < .01; ***P < .001; comparison of Utx+/+, Utx+/Δ, and UtxΔ/Δ mice, assessed with a 1-way analysis of variance followed by Tukey’s test. (B) Morphological changes of hematopoietic cells in the PB (panels 1-6) and BM (panels 7-10) of UtxΔ/Δ mice. WBCs with abnormal nuclei (panels 1-3), including Pseudo Pelger-Huët anomalies (arrows) and hypersegmentation (arrowhead). A giant platelet (panel 4, arrowhead). An erythrocyte with a Howell-Jolly body (panel 5, arrow). Apoptotic cells (panel 6, arrows). Myeloid progenitor cells with abnormal nuclei and micromegakaryocytes (panels 7-10, arrows and arrowheads, respectively).
In addition, morphological abnormalities were observed in UtxΔ/Δ mice (Figure 1B), which included WBCs with abnormal nuclei, including pseudo Pelger-Huët anomalies (Figure 1B1-2), neutrophils with hypersegmentation (Figure 1B3), giant platelets (Figure 1B4), erythrocytes with Howell-Jolly bodies (Figure 1B5), apoptotic cells (Figure 1B6), myeloid progenitor cells with abnormal nuclei (Figure 1B7,9-10), and micromegakaryocytes (Figure 1B8-9). These results indicate that acquired deficiency of UTX induces abnormal hematopoietic parameters with trilineage dysplasia, reminiscent of human myelodysplastic syndrome (MDS), as previously described.16,33,34
Extramedullary hematopoiesis in UtxΔ/Δ mice
Macroscopically, the femurs of UtxΔ/Δ mice were pale and the spleens were enlarged, compared with those of Utx+/+ mice (supplemental Figure 3A, left). Pathological analyses revealed that the UtxΔ/Δ BM contained markedly reduced erythroid cells and megakaryocytes and the UtxΔ/Δ spleen contained an increased number of myeloid cells and megakaryocytes (supplemental Figure 3A, right). These phenotypes are characteristic of extramedullary hematopoiesis and suggest the transition of HSPCs from the BM to the spleen through the PB. To address this possibility, we subjected HSPCs in the PB to flow cytometry and colony formation assays. The results exhibited significant increases in c-kit+ and LSK cells in the UtxΔ/Δ PB (supplemental Figure 3B), which generated a considerable number of trilineage hematopoietic cell colonies containing dysplastic cells, as observed in the UtxΔ/Δ PB and BM (supplemental Figure 3C-D), indicating circulating HSPCs in UtxΔ/Δ mice.
Impaired reconstitution ability of UtxΔ/Δ HSPCs
Analysis of Utx and Uty expression in HSPC subfractions showed similar patterns, being highest in the LT-HSC subfraction and decreasing as the cells differentiated (Figure 2A; supplemental Figure 2B). To investigate the repopulating ability of Utx+/+ and UtxΔ/Δ LSKs, competitive repopulation assays were performed (Figure 2B, top). In the first bone marrow transplantation (BMT), the total PB chimerism of UtxΔ/Δ cells was similar to that of Utx+/+ cells at 1 month, but became significantly lower at 2 and 3 months (Figure 2B, middle left). In the second BMT, the reduced PB chimerism of UtxΔ/Δ cells was more pronounced, and almost no contribution was detected (Figure 2B, middle right). Analysis of the lineage-positive cells in the first BMT showed that the percentage of UtxΔ/Δ cells was significantly reduced in all myeloid, B-cell (B220+), and T-cell (Thy1.2+) lineages (Figure 2B, bottom), indicating the severely impaired repopulation potential of UtxΔ/Δ HSPCs. We also performed a rescue experiment in which Utx+/+ LSKs were transduced with an empty vector (EV) (Utx+/++EV), UtxΔ/Δ cells with empty vector (UtxΔ/Δ+EV), or UtxΔ/Δ cells with Utx-expressing vector (UtxΔ/Δ+Utx) were subjected to competitive reconstitution assays. Although the results were not statistically significant, UtxΔ/Δ+Utx cells exhibited an enhanced engraftment capacity compared with UtxΔ/Δ+EV cells, indicating that the impaired repopulating ability of UtxΔ/Δ HSPCs was a direct effect of Utx deficiency (Figure 2C).
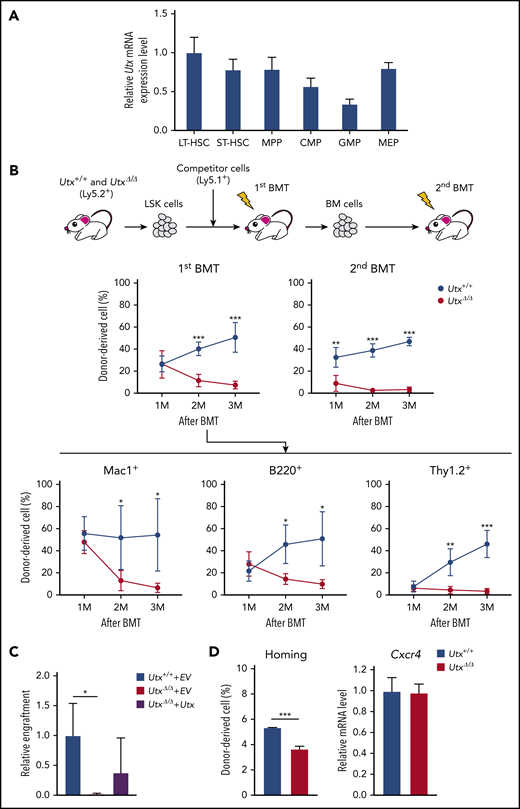
Expression of Utx in HSPCs, analysis of repopulating activity of UtxΔ/ΔHSPCs, and homing ability of UtxΔ/ΔHSPCs. (A) Relative expression levels of Utx in hematopoietic stem and progenitor subfractions. The results are shown relative to levels in LT-HSCs. (B) Experimental procedure for serial competitive repopulation experiments (top). Percentages of donor-derived cells in the PB of recipients of Utx+/+ or UtxΔ/Δ cell transplants at first and second BMTs. Percentages of lineage-committed, donor-derived cells in the PB of recipients at first BMT (bottom). *P < .05; **P < .01; ***P < .001. (C) Engraftment of Utx+/++EV, UtxΔ/Δ+EV, and UtxΔ/Δ+Utx cells at 3 months after transplantation. The percentages of donor-derived cells in the PB are shown relative to that of Utx+/++EV. *P < .05. (D) Homing ability (left) and expression (right) of Cxcr4 in Utx+/+ and UtxΔ/Δ cells. ***P < .001.
Expression of Utx in HSPCs, analysis of repopulating activity of UtxΔ/ΔHSPCs, and homing ability of UtxΔ/ΔHSPCs. (A) Relative expression levels of Utx in hematopoietic stem and progenitor subfractions. The results are shown relative to levels in LT-HSCs. (B) Experimental procedure for serial competitive repopulation experiments (top). Percentages of donor-derived cells in the PB of recipients of Utx+/+ or UtxΔ/Δ cell transplants at first and second BMTs. Percentages of lineage-committed, donor-derived cells in the PB of recipients at first BMT (bottom). *P < .05; **P < .01; ***P < .001. (C) Engraftment of Utx+/++EV, UtxΔ/Δ+EV, and UtxΔ/Δ+Utx cells at 3 months after transplantation. The percentages of donor-derived cells in the PB are shown relative to that of Utx+/++EV. *P < .05. (D) Homing ability (left) and expression (right) of Cxcr4 in Utx+/+ and UtxΔ/Δ cells. ***P < .001.
The efficiency of BM reconstitution correlates strongly with the homing ability of HSPCs. Thus, we performed homing assays and also measured the expression of CXCR4, a key chemokine receptor for HSC homing.35 Consistent with the results of a previous report,16 UtxΔ/Δ LSKs exhibited a significantly reduced homing ability, despite comparable expression of Cxcr4 (Figure 2D).
Increased leukemia susceptibility of UtxΔ/Δ mice
Utx is frequently mutated in human cancers23,28 and is a tumor suppressor in mice.33,34,36 To investigate the effect of UTX deficiency on leukemogenesis, we performed retrovirus-insertional mutagenesis using MOL4070A, a retrovirus capable of inducing leukemia.37 Utx-expressing (Utx+/+ and Utx+/Uty) and Utx-deficient (UtxΔ/Δ and UtxΔ/Uty) mice were infected with MOL4070A as neonates, and their hematopoietic parameters were analyzed (Figure 3A, top).
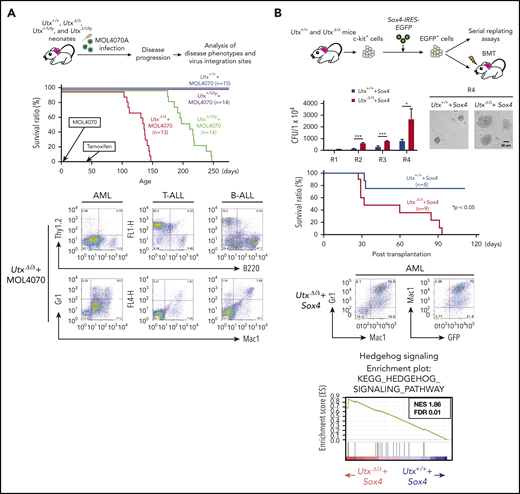
Analysis of leukemias developed in MOL4070A-infected UtxΔ/Δand UtxΔ/Utymice. (A) Experimental procedure of retroviral insertional mutagenesis (top). Neonates were infected with MOL4070A, and leukemic mice were analyzed for disease phenotypes and virus integration sites (middle); survival curves are shown. Representative fluorescence-activated cell sorting results of leukemia cells (bottom), including acute myeloid leukemia (AML), T-lineage acute lymphoblastic leukemia (T-ALL), and B-lineage acute lymphoblastic leukemia (B-ALL). (B) Experimental procedure (top). c-kit+ cells were transduced with Sox4-IRES-EGFP EV and EGFP+ cells were subjected to serial replating and BMT assays and the colony-forming ability of Utx+/++Sox4 and UtxΔ/Δ+Sox4 cells was observed (second row). Colony numbers at rounds 1 to 4 (R1 to R4) of replating, starting at 1 × 10⁴ cells, and representative micrographs of colonies at R4 are shown. *P < .05; ***P < .001. Survival curves of transplant recipients (third row). Representative FACS results of AML cells developed in Utx+/++Sox4 transplant recipients (bottom left). GSEA plots of hedgehog signaling (bottom right). The plots are shown with normalized enrichment score (NES) and false discovery rate (FDR).
Analysis of leukemias developed in MOL4070A-infected UtxΔ/Δand UtxΔ/Utymice. (A) Experimental procedure of retroviral insertional mutagenesis (top). Neonates were infected with MOL4070A, and leukemic mice were analyzed for disease phenotypes and virus integration sites (middle); survival curves are shown. Representative fluorescence-activated cell sorting results of leukemia cells (bottom), including acute myeloid leukemia (AML), T-lineage acute lymphoblastic leukemia (T-ALL), and B-lineage acute lymphoblastic leukemia (B-ALL). (B) Experimental procedure (top). c-kit+ cells were transduced with Sox4-IRES-EGFP EV and EGFP+ cells were subjected to serial replating and BMT assays and the colony-forming ability of Utx+/++Sox4 and UtxΔ/Δ+Sox4 cells was observed (second row). Colony numbers at rounds 1 to 4 (R1 to R4) of replating, starting at 1 × 10⁴ cells, and representative micrographs of colonies at R4 are shown. *P < .05; ***P < .001. Survival curves of transplant recipients (third row). Representative FACS results of AML cells developed in Utx+/++Sox4 transplant recipients (bottom left). GSEA plots of hedgehog signaling (bottom right). The plots are shown with normalized enrichment score (NES) and false discovery rate (FDR).
During a 250-day observation period, although no disease was observed in Utx+/++MOL4070A and Utx+/Uty+MOL4070A mice, all the UtxΔ/Δ+MOL4070A and UtxΔ/Uty+MOL4070A littermates developed leukemia; the former died within 150 days and the latter within 250 days (Figure 3A, middle; supplemental Table 3). To determine the lineage of the leukemias, enlarged spleens containing infiltrating leukemic cells, were subjected to flow cytometric and gene rearrangement analyses. Leukemias were mostly acute myeloid leukemia (AML) or T-cell acute lymphoblastic leukemia (T-ALL), along with B-cell ALL in a few cases (Figure 3A, bottom; supplemental Table 3), closely corresponding to the phenotypes of human leukemias with UTX deficiency.23,28
Next, we investigated virus integration sites by inverse PCR.37 Six common integration sites (Sox4, Mecom, Osbpl1a, Notch1, Ikaros, and Tax1bp1) were identified (supplemental Figure 4; supplemental Table 4), most of which were reported as leukemia-associated genes.38-40 Because Sox4 was highly expressed in tumors (supplemental Figure 4) and reported as a cooperative gene in leukemia development,41,42 we examined the cooperative role of Sox4 overexpression with Utx deficiency (Figure 3B, top). Sox4-expressing UtxΔ/Δ (UtxΔ/Δ+Sox4) cells generated significantly increased colony-forming and replating abilities (Figure 3B, second row) and developed leukemia, classified as AML, at significantly higher frequency than Sox4-expressing Utx+/+ (Utx+/++Sox4) cells (Figure 3B, third row and bottom left). RNA-sequencing (RNA-sea) and gene set enrichment analysis (GSEA) identified the most positively enriched pathway in UtxΔ/Δ+Sox4 cells as “Hedgehog signaling” (Figure 3B, bottom right), which was reported to contribute to hematopoietic malignancies.43 Utx deficiency rendered hematopoietic cells susceptible to leukemia and additional gene alterations, such as Sox4 overexpression, and promoted acute transformation, possibly through activation of aberrant signal(s).
UtxΔ/Δ LSKs exhibited the molecular signature of aged HSPCs
To clarify the molecular mechanisms underlying the Utx deficiency–induced hematopoietic abnormalities, we analyzed the gene expression profiles of Utx+/+ and UtxΔ/Δ LSKs. GSEA indicated that the most positively enriched gene set in UtxΔ/Δ LSKs was “Oxidative phosphorylation” characterized by the upregulation of ATPases, NADH dehydrogenases, and cytochrome c oxidases (Figure 4A, left; supplemental Figure 5A, left; supplemental Table 5). In contrast, the most negatively enriched gene set was “TGF-β signaling,” with downregulation of TGF-β receptors, Activin receptors, and Smad proteins (Figure 4A, right; supplemental Figure 5A, right; supplemental Table 5).

GSEA of RNA expression profiles of UtxΔ/ΔLSKs. (A) GSEA plots of UtxΔ/Δ vs Utx+/+ LSKs. The results of the most positively enriched plot (Oxidative phosphorylation) and most negatively depleted plot (TGF beta signaling) in UtxΔ/Δ LSKs are shown with normalized enrichment score (NES) and false discovery rate (FDR). (B) GSEA plots comparing differently expressed genes in UtxΔ/Δ and Utx+/+ LSKs and aging-associated genes in HSPCs.47 The results of plots that increased with age (Aging Up Top200) and decreased with age (Aging Down Top200) are shown with NES and FDR. (C) GSEA plots comparing UtxΔ/Δ LSK genes with HSPC and myeloid gene signatures. The results of comparison with 3 HSPC expression profiles (Armstrong Laboratory, Lemischka Laboratory, and Goodell Laboratory)50-52 and with a myeloid expression profile (Goodell Laboratory)52 are shown with NES and FDR.
GSEA of RNA expression profiles of UtxΔ/ΔLSKs. (A) GSEA plots of UtxΔ/Δ vs Utx+/+ LSKs. The results of the most positively enriched plot (Oxidative phosphorylation) and most negatively depleted plot (TGF beta signaling) in UtxΔ/Δ LSKs are shown with normalized enrichment score (NES) and false discovery rate (FDR). (B) GSEA plots comparing differently expressed genes in UtxΔ/Δ and Utx+/+ LSKs and aging-associated genes in HSPCs.47 The results of plots that increased with age (Aging Up Top200) and decreased with age (Aging Down Top200) are shown with NES and FDR. (C) GSEA plots comparing UtxΔ/Δ LSK genes with HSPC and myeloid gene signatures. The results of comparison with 3 HSPC expression profiles (Armstrong Laboratory, Lemischka Laboratory, and Goodell Laboratory)50-52 and with a myeloid expression profile (Goodell Laboratory)52 are shown with NES and FDR.
Notably, the phenotypes of UtxΔ/Δ mice, such as myeloid skewing with dysplasia, extramedullary hematopoiesis, impaired reconstitution activity, and leukemia susceptibility, are characteristics of hematopoietic aging.44-46 In addition, upregulation of oxidative phosphorylation and downregulation of TGF-β signaling are hallmarks of an aged hematopoietic system.47-49 Therefore, we compared the gene expression profiles of UtxΔ/Δ LSKs with those reported for young and aged HSPCs.47 Interestingly, genes with enhanced expression in UtxΔ/Δ LSKs correlated significantly with the top 200 upregulated genes in aged HSPCs47 (Aging Up Top200; supplemental Table 6; Figure 4B, left; supplemental Figure 5B, left). In addition, genes with reduced expression in UtxΔ/Δ LSKs correlated significantly with the top 200 downregulated genes in aged HSPCs47 (Aging Down Top200; Supplemental Table 6; Figure 4B, right; supplemental Figure 5B, right). Moreover, the gene expression patterns of UtxΔ/Δ LSKs correlated conversely with molecular signatures of young HSPCs50-52 (Figure 4C, top) and correlated positively with the molecular signature of myeloid cells52 (Figure 4C, bottom). These results collectively indicate that the acquired loss of UTX converts the gene expression patterns of young HSPCs to those of aged cells.
UtxΔ/Δ HSPCs exhibited phenotypes of hematopoietic aging
We then analyzed UtxΔ/Δ HSPCs from the perspective of aging. We first examined changes in Utx expression with aging. The expression levels of Utx in aged (20 months) LT-HSCs, ST-HSCs, and multipotent progenitor cells decreased significantly compared with those in young (2 months) cells, confirming the aging-associated decline in Utx expression in HSC subfractions (Figure 5A). Similarly, the expression levels of Uty were significantly reduced in aged HSCs (supplemental Figure 2C).
![Analysis of aging-associated phenotypes in UtxΔ/ΔHSPCs. (A) Expression changes of Utx in young (2 months [M]) and aged (20 months) HSC subfractions. The results are shown relative to that in LT-HSCs. *P < .05. (B) Expression of CD41, an aging-related marker, in LSK-gated c-kit+ cells of aged (18 months) wild-type (WT) and young (2 months) Utx+/+ and UtxΔ/Δ mice. Representative results of fluorescence-activated cell sorting and a comparison of percentages of CD41+, LSK-gated c-kit+ cells in young Utx+/+ and UtxΔ/Δ mice are shown. **P < .01. (C) ROS levels in LSKs and LT-HSCs of Utx+/+ and UtxΔ/Δ mice. The representative histograms and fluorescence intensities are shown. **P < .01; ***P < .001. (D) Kinetics of DDR in Utx+/+ and UtxΔ/Δ LT-HSCs (0, 3, 18, and 24 hours) after 2 Gy of irradiation. Representative images of γH2AX (green) and 53BP1 (red) foci (top) and the number of γH2AX/53BP1-overlapping foci (bottom) in cells are shown, respectively. Residual γH2AX and 53BP1 foci in UtxΔ/Δ cells at 18 hours after irradiation (arrow). **P < .01.](https://ash.silverchair-cdn.com/ash/content_public/journal/blood/137/7/10.1182_blood.2019001044/2/m_bloodbld2019001044f5.png?Expires=1769157287&Signature=cREuKMY8DWnthyuBJsJcSSO4HkPUgnvak0P12ZcVzdLMDOSnKDo1A7wB2UIQRWU7cWBnpL~Ex2W01Mu9Jm~DVmP0FiAsRok12I~HB~ljwSvL29wgviaJFy7hRBE6onmHMnAPWbC1zZFsoE2GE1KyU8EGhBlW2iVq8GApXHL3qs9d4b4FV42Bs19954sT1UJ~cOiV3wLPVUt75hvN2HbMDUm5gOutXDrnlEpr21ozK659ORvAFsSWtLrmEeUJ0LWdH2J7J2BlnRIHL7ZJqvHRCcXHVCOnkOmkTOAF7n0NbVEOJ-naEIkPeNdV1gsPgvuQdneLh1ljTe8rSacxF52NyQ__&Key-Pair-Id=APKAIE5G5CRDK6RD3PGA)
Analysis of aging-associated phenotypes in UtxΔ/ΔHSPCs. (A) Expression changes of Utx in young (2 months [M]) and aged (20 months) HSC subfractions. The results are shown relative to that in LT-HSCs. *P < .05. (B) Expression of CD41, an aging-related marker, in LSK-gated c-kit+ cells of aged (18 months) wild-type (WT) and young (2 months) Utx+/+ and UtxΔ/Δ mice. Representative results of fluorescence-activated cell sorting and a comparison of percentages of CD41+, LSK-gated c-kit+ cells in young Utx+/+ and UtxΔ/Δ mice are shown. **P < .01. (C) ROS levels in LSKs and LT-HSCs of Utx+/+ and UtxΔ/Δ mice. The representative histograms and fluorescence intensities are shown. **P < .01; ***P < .001. (D) Kinetics of DDR in Utx+/+ and UtxΔ/Δ LT-HSCs (0, 3, 18, and 24 hours) after 2 Gy of irradiation. Representative images of γH2AX (green) and 53BP1 (red) foci (top) and the number of γH2AX/53BP1-overlapping foci (bottom) in cells are shown, respectively. Residual γH2AX and 53BP1 foci in UtxΔ/Δ cells at 18 hours after irradiation (arrow). **P < .01.
Analysis of aging-associated phenotypes in UtxΔ/ΔHSPCs. (A) Expression changes of Utx in young (2 months [M]) and aged (20 months) HSC subfractions. The results are shown relative to that in LT-HSCs. *P < .05. (B) Expression of CD41, an aging-related marker, in LSK-gated c-kit+ cells of aged (18 months) wild-type (WT) and young (2 months) Utx+/+ and UtxΔ/Δ mice. Representative results of fluorescence-activated cell sorting and a comparison of percentages of CD41+, LSK-gated c-kit+ cells in young Utx+/+ and UtxΔ/Δ mice are shown. **P < .01. (C) ROS levels in LSKs and LT-HSCs of Utx+/+ and UtxΔ/Δ mice. The representative histograms and fluorescence intensities are shown. **P < .01; ***P < .001. (D) Kinetics of DDR in Utx+/+ and UtxΔ/Δ LT-HSCs (0, 3, 18, and 24 hours) after 2 Gy of irradiation. Representative images of γH2AX (green) and 53BP1 (red) foci (top) and the number of γH2AX/53BP1-overlapping foci (bottom) in cells are shown, respectively. Residual γH2AX and 53BP1 foci in UtxΔ/Δ cells at 18 hours after irradiation (arrow). **P < .01.
A previous study reported that the expression of CD41, a megakaryocyte/platelet marker, increases with age.53 After confirming that aged (18 months) LSK-gated c-kit+ cells ex‐pressed CD41 at a high level, we measured CD41 expression in young (2 months) Utx+/+ and UtxΔ/Δ cells and found that UtxΔ/Δ cells expressed CD41 at a significantly higher level than Utx+/+ cells (Figure 5B). In addition, the marked enrichment of the oxidative phosphorylation in UtxΔ/Δ LSKs (Figure 4A, left) strongly suggested an increase in reactive oxygen species (ROS), which is implicated in the aging process.49 In fact, measurement of ROS in Utx+/+ and UtxΔ/Δ LSKs and LT-HSCs demonstrated a significant accumulation of ROS in UtxΔ/Δ cells (Figure 5C). We also found positive enrichment of glutathione metabolism pathway in UtxΔ/Δ cells (supplemental Figure 6A), which would be activated to scavenge the accumulated ROS. Another aspect of aged HSPCs is impaired recovery from the DNA damage response (DDR).54,55 The analysis of the behavior and localization of DNA repair proteins in irradiated Utx+/+ and UtxΔ/Δ LT-HSCs showed that, although a similar number of γH2AX/53BP1-overlapping foci developed at 2 hours and finally cleared by 24 hours, UtxΔ/Δ LT-HSCs exhibited significantly delayed repair kinetics and DDR remnants at 18 hours (Figure 5D). Because expression levels of DDR-associated genes were comparable between Utx+/+ and UtxΔ/Δ LSKs, although there was a slight decrease in Xrcc5 in UtxΔ/Δ cells after irradiation56,57 (supplemental Figure 6B), this phenotype may be related to Utx deficiency–induced altered chromatin accessibility at the DNA damage sites, as reported in a previous study.34
Introduction of Utx in aged HSPCs partly restored the impaired repopulating activity and reversed the expression of aging-associated genes
We investigated whether the reexpression of Utx can rescue the functional defects of aged HSPCs in terms of reconstitution ability. To examine the contribution of the demethylase activity of UTX, we transduced aged (20 months) LSKs with EV-, wild-type Utx (UtxWT)-, or demethylase-dead Utx (UtxDD)10 -IRES-EGFP vector (referred to as EV-, UtxWT-, or UtxDD-IRES-EGFP), and c-kit+, EGFP+ cells were subjected to competitive repopulation assays (Figure 6A, top). Whereas all transplant-recipient mice receiving EV-IRES-EGFP–transduced or UtxDD-IRES-EGFP–transduced aged LSKs (Aged+EV and Aged+UtxDD) exhibited failed reconstitution (<1% PB chimerism),58 several recipients transplanted with UtxWT-IRES-EGFP-transduced aged cells (Aged+UtxWT) were successfully reconstituted (>1% PB chimerism)58 (reconstituted mice numbered 1-3; Figure 6A, bottom left). Interestingly, the degree of reconstitution correlated well with increased levels of Utx expression and decreased myeloid-biased differentiation (Figure 6A, bottom right). In addition, we found that the enforced Utx expression in aged cells significantly reduced the H3K27me3 levels and also significantly reversed the expression of P-selectin (Selp) and clusterin (Clu), the hallmark genes of hematopoietic aging (Figure 6B).52 These findings indicate that Utx restores the aging-related phenotypes, at least in part, through reprogramming the H3K27 methylation status.
![Partial restoration of impaired reconstitution ability of aged HSPCs and expression changes of aging-associated genes by reexpression of Utx. (A) Reexpression of Utx in aged HSPCs and the results of reconstitution. Experimental procedure (top). Aged (20 months [M]) LSKs were transduced with empty vector (EV)-, wild-type Utx (UtxWT)-, or demethylase-dead Utx (UtxDD)-IRES-EGFP and c-kit+, EGFP+ cells were subjected to competitive repopulation assays. The PB chimerisms of Aged+EV, Aged+UtxWT, or Aged+UtxDD cell transplant recipients at 3 months after transplantation (bottom left). The successfully reconstituted Aged+UtxWT cell (Ly5.2+ >1.0%) transplant recipients are numbered. Correlation between relative Utx expression levels in Ly5.2+ BM cells and percentages of myeloid cells in Ly5.2+ PB cells in Aged+UtxWT cell recipients (bottom right). The numbered mice are the same in both panels. (B) Changes in H3K27me3 expression (top; ***P < .001) and levels of selectin P (SelP) and clusterin (Clu) in Aged+EV and Aged+Utx c-kit+, EGFP+ cells (bottom). *P < .05; **P < .01.](https://ash.silverchair-cdn.com/ash/content_public/journal/blood/137/7/10.1182_blood.2019001044/2/m_bloodbld2019001044f6.png?Expires=1769157287&Signature=ftYZUDNEFVamcmbFxGrMNRWsdTyb3V0IcvLFvohGvUmeLC~vNaYuNKgf7DqU98ZIi6nGlYe0~oA5l2xjE4CP325DmRIc0bRjVNDLBjpTxHt-DlZg0sygVX0DmAf-Sz3u0Fvv6Z-vJQJaUvO6z-vOTdKjxYsvPTKt28xaqhNkWPA7pbRBq705OrogGS5tmjFjf~RNP-CpBAg3UC-1JYo430XcB-oQZUjcMkygFdoJquNwJ3RfFO-WtKuwRx1KFNYQ23dsPP7ZWHqrd9dAO5ylcjkEw4F1i~VIbUXc~~L1fArCX4HelEDXhqSpiicR2zj~HWQw0UUMzxElsKFRvMLxrg__&Key-Pair-Id=APKAIE5G5CRDK6RD3PGA)
Partial restoration of impaired reconstitution ability of aged HSPCs and expression changes of aging-associated genes by reexpression of Utx. (A) Reexpression of Utx in aged HSPCs and the results of reconstitution. Experimental procedure (top). Aged (20 months [M]) LSKs were transduced with empty vector (EV)-, wild-type Utx (UtxWT)-, or demethylase-dead Utx (UtxDD)-IRES-EGFP and c-kit+, EGFP+ cells were subjected to competitive repopulation assays. The PB chimerisms of Aged+EV, Aged+UtxWT, or Aged+UtxDD cell transplant recipients at 3 months after transplantation (bottom left). The successfully reconstituted Aged+UtxWT cell (Ly5.2+ >1.0%) transplant recipients are numbered. Correlation between relative Utx expression levels in Ly5.2+ BM cells and percentages of myeloid cells in Ly5.2+ PB cells in Aged+UtxWT cell recipients (bottom right). The numbered mice are the same in both panels. (B) Changes in H3K27me3 expression (top; ***P < .001) and levels of selectin P (SelP) and clusterin (Clu) in Aged+EV and Aged+Utx c-kit+, EGFP+ cells (bottom). *P < .05; **P < .01.
Partial restoration of impaired reconstitution ability of aged HSPCs and expression changes of aging-associated genes by reexpression of Utx. (A) Reexpression of Utx in aged HSPCs and the results of reconstitution. Experimental procedure (top). Aged (20 months [M]) LSKs were transduced with empty vector (EV)-, wild-type Utx (UtxWT)-, or demethylase-dead Utx (UtxDD)-IRES-EGFP and c-kit+, EGFP+ cells were subjected to competitive repopulation assays. The PB chimerisms of Aged+EV, Aged+UtxWT, or Aged+UtxDD cell transplant recipients at 3 months after transplantation (bottom left). The successfully reconstituted Aged+UtxWT cell (Ly5.2+ >1.0%) transplant recipients are numbered. Correlation between relative Utx expression levels in Ly5.2+ BM cells and percentages of myeloid cells in Ly5.2+ PB cells in Aged+UtxWT cell recipients (bottom right). The numbered mice are the same in both panels. (B) Changes in H3K27me3 expression (top; ***P < .001) and levels of selectin P (SelP) and clusterin (Clu) in Aged+EV and Aged+Utx c-kit+, EGFP+ cells (bottom). *P < .05; **P < .01.
UTX regulates aging-associated genes via demethylase-dependent and -independent mechanisms
To analyze aging-associated genes regulated by UTX-mediated demethylation, Utx+/+ and UtxΔ/Δ LSKs were subjected to chromatin immunoprecipitation sequencing (ChIP-seq) for H3K27me3. The number of H3K27me3 peaks was higher in UtxΔ/Δ LSKs than in Utx+/+ LSKs (Figure 7A). The genomic regions with H3K27me3 peaks in UtxΔ/Δ LSKs were subjected to the biological processes of DNA binding and transcriptional regulation in gene ontology enrichment analysis (Figure 7B). Of note, motif and pathway analyses revealed that the regions with H3K27me3 peaks in UtxΔ/Δ LSKs were significantly enriched in the expected binding sites of SMAD, SP1, and EGR1, which are downstream transcription factors of TGF-β and are expected to functionally decline during aging47,48 (Figure 7C-D). To investigate the direct regulation of UTX at TGF-β signaling-associated gene loci, we searched for genes with decreased expression and increased H3K27me3 levels around the transcription start site (TSS) ± 5 kb. The results identified Hnf4a and Col1a1, which are TGF-β signaling-associated genes59,60 and are included in Aging Down Top200,47 suggesting that these are direct targets of UTX (Figure 7E).

Results of ChIP-seq analysis for H3K27me3, KMT2D, and SMARCA4. (A) Venn diagram showing the overlap of statistically significant peaks of H3K27me3 between Utx+/+ and UtxΔ/Δ LSKs. (B) Gene ontology (GO) enrichment analysis of the genes with H3K27me3 peaks in UtxΔ/Δ LSKs with the Genomic Regions Enrichment of Annotations Tool (GREAT). The ranks were calculated by P values. (C) Pathway analysis of the genomic regions with H3K27me3 peaks in UtxΔ/Δ LSKs with Enrichr_TRANSFAC and JASPAR position weight matrice (PWM) databases. TGF-β downstream transcription factors are shown in red. (D) SMAD proteins SMAD3, SMAD2, and SMAD4, detected from transcription factor motif analysis of the genomic regions with H3K27me3 peaks in UtxΔ/Δ LSKs with Homer Known Motif Enrichment Results. (E) Venn diagram (left) showing the overlap between genes downregulated (Log2FC < −0.5) by Utx deficiency and those with elevated H3K27me3 peaks around annotated TSS ± 5 kb by Utx deficiency. The overlay of H3K27me3 peaks at the representative TGF-β signaling-associated gene loci (right), Hnf4a and Col1a1, in Utx+/+ and UtxΔ/Δ LSKs. Remarkable H3K27me3 peaks in UtxΔ/Δ LSKs are outlined in red. (F) Venn diagrams showing the overlap between upregulated (Log2FC > 0.5) genes in UtxΔ/Δ LSKs and Aging Up Top200 (Up genes, left) and the overlap between downregulated (Log2FC < −0.5) genes in UtxΔ/Δ LSKs and Aging Down Top200 (Down genes, right). (G) Bar graph (left) showing the percentage of KMT2D binding (TSS ± 5 kb) of Up and Down genes in at least 1 of the published ChIP-seq data sets of mouse blood tissues available in the ChIP Atlas,61 GSE69162,62 and GSE 103508.62 The bigwig files and bed files were obtained from the ChIP Atlas. The significance threshold for significant peaks is defined as q < 1 × 10⁻¹⁰. Overlay of KMT2D peaks at the indicated Down gene loci as representative images (right). Remarkable KMT2D peaks are outlined in red. (H) Histogram (left) showing the percentage of genes bound to SMARCA4 (TSS ± 5 kb) in Up or Down genes in at least 1 of the published ChIP-seq data sets of mouse blood tissues available in ChIP-Atlas,61 GSE23719,64 GSE79391,64 GSE82144,68 GSE52279,65 and GSE66978.66 The bigwig files and bed files were obtained from the ChIP-Atlas. Significance threshold for significant peaks is defined as q < 1 × 10⁻¹⁰. The columns indicate the percentages of Up genes, Down genes, KMT2D peak-positive genes with SMARCA4 peaks, respectively. The number of the horizontal axis shows the overlap of SMARCA4 peaks from different data sets. The overlay of SMARCA4 and KMT2D peaks (TSS ± 5 kb) at the indicated Down genes loci in which SMARCA4 peaks were observed in 3 data sets and a KMT2D peak was overlapped with ≥1 SMARCA4 peaks (right).
Results of ChIP-seq analysis for H3K27me3, KMT2D, and SMARCA4. (A) Venn diagram showing the overlap of statistically significant peaks of H3K27me3 between Utx+/+ and UtxΔ/Δ LSKs. (B) Gene ontology (GO) enrichment analysis of the genes with H3K27me3 peaks in UtxΔ/Δ LSKs with the Genomic Regions Enrichment of Annotations Tool (GREAT). The ranks were calculated by P values. (C) Pathway analysis of the genomic regions with H3K27me3 peaks in UtxΔ/Δ LSKs with Enrichr_TRANSFAC and JASPAR position weight matrice (PWM) databases. TGF-β downstream transcription factors are shown in red. (D) SMAD proteins SMAD3, SMAD2, and SMAD4, detected from transcription factor motif analysis of the genomic regions with H3K27me3 peaks in UtxΔ/Δ LSKs with Homer Known Motif Enrichment Results. (E) Venn diagram (left) showing the overlap between genes downregulated (Log2FC < −0.5) by Utx deficiency and those with elevated H3K27me3 peaks around annotated TSS ± 5 kb by Utx deficiency. The overlay of H3K27me3 peaks at the representative TGF-β signaling-associated gene loci (right), Hnf4a and Col1a1, in Utx+/+ and UtxΔ/Δ LSKs. Remarkable H3K27me3 peaks in UtxΔ/Δ LSKs are outlined in red. (F) Venn diagrams showing the overlap between upregulated (Log2FC > 0.5) genes in UtxΔ/Δ LSKs and Aging Up Top200 (Up genes, left) and the overlap between downregulated (Log2FC < −0.5) genes in UtxΔ/Δ LSKs and Aging Down Top200 (Down genes, right). (G) Bar graph (left) showing the percentage of KMT2D binding (TSS ± 5 kb) of Up and Down genes in at least 1 of the published ChIP-seq data sets of mouse blood tissues available in the ChIP Atlas,61 GSE69162,62 and GSE 103508.62 The bigwig files and bed files were obtained from the ChIP Atlas. The significance threshold for significant peaks is defined as q < 1 × 10⁻¹⁰. Overlay of KMT2D peaks at the indicated Down gene loci as representative images (right). Remarkable KMT2D peaks are outlined in red. (H) Histogram (left) showing the percentage of genes bound to SMARCA4 (TSS ± 5 kb) in Up or Down genes in at least 1 of the published ChIP-seq data sets of mouse blood tissues available in ChIP-Atlas,61 GSE23719,64 GSE79391,64 GSE82144,68 GSE52279,65 and GSE66978.66 The bigwig files and bed files were obtained from the ChIP-Atlas. Significance threshold for significant peaks is defined as q < 1 × 10⁻¹⁰. The columns indicate the percentages of Up genes, Down genes, KMT2D peak-positive genes with SMARCA4 peaks, respectively. The number of the horizontal axis shows the overlap of SMARCA4 peaks from different data sets. The overlay of SMARCA4 and KMT2D peaks (TSS ± 5 kb) at the indicated Down genes loci in which SMARCA4 peaks were observed in 3 data sets and a KMT2D peak was overlapped with ≥1 SMARCA4 peaks (right).
UTX regulates gene expression in a demethylase-independent manner as a component of COMPASS-like and SWI/SNF complexes.5-8 To analyze demethylase-independent roles of UTX in the expression of aging-associated genes, we picked up commonly upregulated and downregulated genes between RNA-seq data of UtxΔ/Δ LSKs and Aging Up/Down Top200 (Figure 7F, named Up genes and Down genes, respectively) and searched for the binding of KMT2D and BRG1/SMARCA4, the key components of COMPASS-like and SWI/SNF complexes, respectively, to the regulatory regions (TSS ± 5 kb) of the genes, by referring to published data sets.61-68 We found KMT2D peaks only in Down genes (∼20%; Figure 7G). In addition, although SMARCA4 binds to both Up and Down genes, the total peak number was much higher in Down genes than in Up genes (430 vs 132) and co-occupancy of KMT2D and SMARCA4 was observed in 13 genes (Figure 7H). These results collectively suggest that UTX mainly regulates the expression of genes downregulated with aging, through both demethylase-dependent and -independent mechanisms.
Discussion
There has been increasing interest in how stem cells maintain tissue homeostasis and in how their dysfunctions induce aging.69,70 Epigenetic deregulation has been reported to contribute to the aging process of HSPCs.71,72 For example, deletion of sirtuin (Sirt) family genes encoding histone deacetylases, such as Sirt1, Sirt3, Sirt6, and Sirt7, was reported to induce hematopoietic aging through accumulating DNA damage, reduced resistance to oxidative stress, aberrant activation of WNT signaling, and impaired mitochondrial biogenesis.73-77 Deregulation of histone methylation is also deeply implicated in aging47,78 ; however, the underlying molecular mechanisms remain less understood.
In this study, we demonstrated that deficiency of UTX, a demethylase for H3K27 and a component of the COMPASS-like and SWI/SNF complexes, induces phenotypes characteristic of hematopoietic aging. UtxΔ/Δ mice exhibited abnormal hematopoietic differentiation with myeloid skewing, MDS-like morphological changes, extramedullary hematopoiesis, impaired repopulation ability, and high susceptibility to leukemia (Figures 1,2-3). RNA-seq analysis revealed that Utx deficiency converted the gene expression profiles of young HSPCs to those of aged cells (Figure 4). The expression levels of Utx in HSCs decline with age, and UtxΔ/Δ HSPCs exhibited an increase in the expression of an aging-associated marker, accumulation of ROS, and impaired DDR after irradiation (Figure 5). These findings collectively indicate that Utx deficiency genetically compromises various metabolic and signaling pathways and phenotypically induces hematopoietic aging.
It remains controversial whether UTX functions as an oncogene or antioncogene.79 In T-ALL cases, a previous report showed that UTX acts as an oncogene in TAL1-driven T-ALL.80 In contrast, we and others36,81 have provided evidence that UTX functions as an antioncogene in T-ALL. The results seem contradictory. However, interestingly, in the report by Van der Meulen et al,81 all the T-ALL cases with UTX mutations were associated with TLX3 and/or NOTCH1 mutations, and none of them cooccurred with TAL1 mutations. In addition, in our mutagenesis study, Tal1 was not detected as a cooperative gene (supplemental Table 4). Thus, whether UTX functions as an oncogene or antioncogene may depend on the driver mutation, and its tumorigenic role may vary in different cellular contexts.
It remains to be clarified whether UTX maintains the functional integrity of HSPCs via demethylase-dependent and/or -independent mechanisms. H3K27me3 staining of Utx+/+ and UtxΔ/Δ LT-HSCs showed graded and significant increases in H3K27me3 levels, along with Utx-deficiency (supplemental Figure 1C). In addition, in our experimental system, demethylase-dead Utx did not rescue the aged phenotype (Figure 6A). Moreover, motif and pathway analyses of the H3K27me3 ChIP data identified transcription factors involved in TGF-β signaling (Figures 7C-D), the most downregulated pathway in UtxΔ/Δ HSPCs (Figure 4A). These data support demethylase-dependent mechanisms. However, the overlap between promoter regions with gains of H3K27me3 by Utx deficiency and Aging Down Top200 was found in a small subset (Figure 7E). In addition, comparison of RNA-seq data of HSPCs deficient in Ezh2, encoding an H3K27 methyltransferase of PRC2,82,83 with those of our UtxΔ/Δ HSPCs showed that EZH2 targets were classified into 2 groups that would represent methylation-dependent and -independent genes (supplemental Figure 7A). Moreover, comparison of the same data with Aging Up/Down Top200 exhibited much less enrichment than UtxΔ/Δ HSPCs (supplemental Figure 7B). These findings suggest that there are demethylase-independent mechanism(s). Indeed, the search for binding of KMT2D and SMARCA4, the key components of COMPASS-like and SWI/SNF complexes, to the regulatory region of aging-associated genes revealed that KMT2D selectively and SMARCA4 preferentially bind to Down genes with frequent co-occupancy (Figure 7F-H). These results collectively suggest that UTX contributes to hematopoietic homeostasis, mainly by maintaining the expression of genes downregulated with aging, through both demethylase-dependent and -independent epigenetic programming. The upregulation of oxidative phosphorylation (Figure 4A) may be a secondary effect, because previous studies demonstrated that TGF-β signaling suppresses oxidative phosphorylation.84,85
Whether stem cell aging undergoes similar genetic and/or epigenetic pathways in the different tissues is an intriguing question. An increase in H3K27me3 levels at the transcription start sites was reported, not only in aged HSPCs but also in muscle stem cells (MSCs),86 suggesting that the functional decline of UTX contributes to MSC aging as well as HSC aging. This idea is supported by a study reporting that UTX promotes MSC regeneration through the demethylation of H3K27me3.87 Therefore, we compared changes in signaling pathways between UtxΔ/Δ LSKs and aged MSCs.88 Interestingly, we found a substantial overlap between positively and negatively enriched pathways. In upregulated pathways, 10 of 17 positively enriched pathways of aged MSCs88 overlapped with the top 50 positively enriched pathways of UtxΔ/Δ LSKs, and in downregulated pathways, 26 of the top 50 negatively enriched pathways of aged MSCs88 overlapped with the top 50 negatively enriched pathways of UtxΔ/Δ LSKs (supplemental Figure 8; see also supplemental Tables 5 and 7). Moreover, we compared the changed pathways not only in aged MSCs but also in aged fibroblasts and aged induced neurons (iNs)89 to those in UtxΔ/Δ LSKs. We found that all of the statistically significantly enriched pathways in aged fibroblasts and aged iNs89 were included in the top 30 significantly downregulated pathways in UtxΔ/Δ LSKs (supplemental Figure 9), strongly suggesting that the deregulation of specific sets of pathways may underlie stem cell aging in different tissues. Of note, the statistical change of calcium pathway was commonly observed in all the cell types examined (indicated by an asterisk in supplemental Figure 9), suggesting that this pathway is pivotal in maintaining the homeostasis of different stem cells, as suggested in previous studies.90,91
Interestingly, although only minimal changes were observed in the hematopoietic parameters of UtxΔ/Uty males (supplemental Figure 2), retroviral insertional mutagenesis induced leukemia in UtxΔ/Uty males (Figure 3A). Our findings, together with the results of previous studies,10,11,16,81 indicate that UTY compensates for the absence of UTX in steady-state hematopoiesis but cannot compensate for UTX function as a tumor suppressor. UTY exerts very low demethylase activity but possesses the TPR domain4,9 ; hence, it is intriguing to clarify the compensatory roles of UTY for UTX deficiency in different physiological and pathological conditions.34,92,93
In summary, our findings demonstrate that UTX plays a pivotal role in the functional integrity of HSPCs and maintenance of hematopoietic homeostasis by globally regulating aging-associated genes. Further studies are necessary to clarify how UTX recognizes aging-related genes and whether the enhanced expression of UTX can prevent aging.
The RNA-seq and ChIP-seq data obtained in this study have been deposited in the DNA Data Bank of Japan (DDBJ) and BioSample (accession numbers DRX046253 and DRX046254 for RNA-seq for Utx+/+ and UtxΔ/Δ LSKs and accession numbers DRA010250 for Utx+/++Sox4 and UtxΔ/Δ+Sox4 cells and DRA010152 for ChIP-seq for H3K27me3).
Original data are available by e-mail request to the corresponding author (honda.hiroaki@twmu.ac.jp).
The online version of this article contains a data supplement.
The publication costs of this article were defrayed in part by page charge payment. Therefore, and solely to indicate this fact, this article is hereby marked “advertisement” in accordance with 18 USC section 1734.
Acknowledgments
The authors thank Yuki Sakai, Sawako Ogata, Rika Tai, and Yoshio Mitamura for providing animal care, genotyping, and performing molecular experiments and Junji Takeda and the RIKEN BioResource Center for providing KY1.1 ES cells and B6-Tg(CAG-FLPe)36 mice (RBRC01834), respectively.
This work was supported by Japanese Society for the Promotion of Science (JSPS) KAKENHI grant 17J05696 (Y. Sera) and grants 19H03693 and 19K22546 (H.H.); a research grant from The Japanese Society of Hematology (Y. Sera); and funding from the Medical Research Institute (MRI), Tokyo Women’s Medical University.
Authorship
Contribution: Y. Sera, Y.N., T.U., T. Inaba, Y. Sotomaru, T. Ichinohe., M.K., Y.M., Z.-i.H., T.S., K.T. and H.H. designed the research, generated the genetically engineered mice, and wrote the manuscript; Y. Sera, Y.N., T.U., N.Y., H.K., K.-i.I., K.K., M.I., A.N., and K.T. performed hematopoietic cell analyses; A.K. analyzed the RNA-seq data; S.K. and A.I. analyzed the ChIP data; H.O. examined pathological specimens; L.W. generated the MOL4070A retrovirus; and all authors reviewed and agreed on the final version of the manuscript.
Conflict-of-interest disclosure: The authors declare no competing financial interests.
Correspondence: Hiroaki Honda. Institute of Laboratory Animals, Tokyo Women’s Medical University, 8-1 Kawada-cho, Shinjuku-ku, Tokyo 162-8666, Japan; e-mail: honda.hiroaki@twmu.ac.jp.
