

Key Points
Primary human AML cells with higher levels of BCL6 expression displayed sensitivity when exposed to BCL6 inhibitors.
BCL6 induction contributed to cytarabine resistance, and inhibition of BCL6 in AML cells decreased leukemia stem cell activity.

Abstract
B-cell lymphoma 6 (BCL6) is a transcription repressor and proto-oncogene that plays a crucial role in the innate and adaptive immune system and lymphoid neoplasms. However, its role in myeloid malignancies remains unclear. Here, we explored the role of BCL6 in acute myeloid leukemia (AML). BCL6 was expressed at variable and often high levels in AML cell lines and primary AML samples. AMLs with higher levels of BCL6 were generally sensitive to treatment with BCL6 inhibitors, with the exception of those with monocytic differentiation. Gene expression profiling of AML cells treated with a BCL6 inhibitor revealed induction of BCL6-repressed target genes and transcriptional programs linked to DNA damage checkpoints and downregulation of stem cell genes. Ex vivo treatment of primary AML cells with BCL6 inhibitors induced apoptosis and decreased colony-forming capacity, which correlated with the levels of BCL6 expression. Importantly, inhibition or knockdown of BCL6 in primary AML cells resulted in a significant reduction of leukemia-initiating capacity in mice, suggesting ablation of leukemia repopulating cell functionality. In contrast, BCL6 knockout or inhibition did not suppress the function of normal hematopoietic stem cells. Treatment with cytarabine further induced BCL6 expression, and the levels of BCL6 induction were correlated with resistance to cytarabine. Treatment of AML patient-derived xenografts with BCL6 inhibitor plus cytarabine suggested enhanced antileukemia activity with this combination. Hence, pharmacologic inhibition of BCL6 might provide a novel therapeutic strategy for ablation of leukemia-repopulating cells and increased responsiveness to chemotherapy.
Introduction
Acute myeloid leukemia (AML) is the most common leukemia in adults, and its incidence increases with age.1,2 It is a highly malignant proliferative disease that originates from myeloid progenitor cells that gradually replace the bone marrow (BM) with leukemic cells, causing cytopenia that eventually leads to hematopoietic failure. The standard treatment strategy for AML includes induction chemotherapy with cytarabine (AraC) and anthracycline that seeks to reduce the abundance of leukemic blasts in the BM.3 This is followed by consolidation chemotherapy with AraC that is administered to eradicate residual leukemic cells. Although some patients can be cured with intensive chemotherapy and allogeneic hematopoietic stem cell transplantation, the prognosis of patients with AML remains dismal as a vast majority of AML patients experience relapse and die of their disease. One reason for this scenario is the persistence of residual leukemia cells that can repopulate the disease. The capacity to repopulate leukemia has been described as being enriched in the fraction of more immature cells often described as “leukemia stem cells” (LSCs); LSCs are relatively quiescent but capable of self-renewal and repopulating the disease.4 However, it is also possible that leukemia relapse is driven by more stochastic stress responses that may not be specific to phenotype LSCs updated or renewed as apart from LSC populations.5-7 Regardless, AML relapse linked to persistent leukemia-repopulating populations remains a daunting challenge, and development of therapeutic strategies to eradicate leukemia cell populations is still a major unmet clinical need.
Herein, we focused our investigation on B-cell lymphoma 6 (BCL6), which is a transcriptional repressor that belongs to the BTB/POZ family of transcription factors.8 BCL6 has been classically described as a proto-oncogene that has a pivotal role in the humoral immune response and lymphomagenesis during which BCL6 mediates aberrant proliferation, genomic instability, and differentiation blockade in diffuse large B-cell lymphoma (DLBCL) cells.9-13 BCL6 mediates its biological effects by repressing numerous target genes through recruitment of specific chromatin-modifying corepressor complexes.14 Among these, the SMRT and NCOR corepressors were shown to directly bind to a groove formed at the interface between homodimerized BCL6 BTB domains.14,15 The binding site for NCOR and SMRT on the surface of the BCL6 BTB dimer is a druggable target, with structural features favorable for the design of competitive pharmacologic inhibitors.8,16 Indeed, several classes of peptidomimetic and small molecule BCL6 inhibitors have been developed with potent activity against BCL6-dependent lymphoma cells, pointing to BCL6 as a novel therapeutic target in B-cell lymphomas.17 Although BCL6 is well known for its fundamental role in B-cell maturation and progression of DLBCLs, the precise role of BCL6 in early hematopoietic cells and AML remains poorly characterized.
We were prompted to explore the potential role of BCL6 in AML having observed that it is expressed in patients with AML upon perusal of publicly available patient gene expression profiles and being aware of its functional significance as an oncoprotein. Herein we explored the pattern of expression of BCL6 in primary human AMLs, its contribution to proliferation and survival of these tumors, and its potential suitability as a therapeutic target for this disease.
Methods
Reagents and cell culture
Primary cryopreserved AML specimens were thawed and cultured for 1 hour at 37°C before drug treatment, as previously described.18 Primary cells were cultured in serum-free medium as detailed elsewhere.18-20 Briefly, serum-free medium consists of Iscove modified Dulbecco medium supplemented with 20% bovine serum albumin (BSA), insulin, and transferrin (BIT), human low-density lipoproteins, and human cytokines: granulocyte colony-stimulating factor, granulocyte-macrophage colony-stimulating factor, interleukin-3, interleukin-6, FLT3 ligand, and stem cell factor. Primary specimens were obtained with appropriate consent and institutional review board approval. AML cell lines were obtained from the ATCC or Deutsche Sammlung von Mikroorganismen und Zellkulturen GmbH and were cultured in Iscove modified Dulbecco medium (Life Technologies) supplemented with 10% to 20% fetal bovine serum and 1% penicillin/streptomycin (PenStrep; Life Technologies). All cell lines have been authenticated and tested for mycoplasma. AraC, lestaurtinib, suberoylanilide-hydroxamic acid (SAHA), 12-O-tetradecanoylphorbol-13-acetate (TPA), and 5-azacytidine were obtained from Sigma-Aldrich, and doxorubicin was purchased from Millipore.
RNA-sequencing
A library for RNA-sequencing was generated as previously described.21 Three primary AML cells (AML37, AML95, and AML98) treated with FX1 (98, 40, and 65 μM, based on 50% effective concentration [EC50]) for 12 hours in triplicates and then RNA was isolated by using TRIzol reagent (Thermo-Fisher), and RNA was prepared by using the RNeasy mini column (Invitrogen). Quality of the RNA library was checked by using the 2100 Bioanalyzer system (Agilent). Reads (paired 50 bp) obtained by HiSeq2500 were aligned with hg19 (GSE133112).
Pathway analysis
Gene expression profiles were obtained by RNA-sequencing. Pathways significantly enriched in AML cells treated with FX1 compared with cells treated with dimethyl sulfoxide were identified by using Gene Set Enrichment Analysis software, as previously described.22 For canonical pathways, the Molecular Signatures Database was downloaded from the Broad Institute, and lymphocyte-specific pathways were obtained by our laboratory’s previous publications.23-28
Small interfering RNA mediated knockdown of BCL6
To knock down BCL6 gene expression either in AML cell lines or primary AML cells, Silencer Select Predesigned small interfering RNA (siRNA) was purchased (HSS100968 Life Technologies). Those siRNA oligos were transfected into AML cells by the electroporation method using the Neon Transfection system (Invitrogen).
Cell viability assay
Cell viability assay was performed as previously described.18 Briefly, AML cell lines were stained with annexin V–fluorescein isothiocyanate (BD Biosciences) and 7-aminoactinomycin (7-AAD; Life Technologies). For primary AML samples, cells were stained with APC-CD34, PE-Cy7-CD38, and APC-H7-CD45 (BD Biosciences) antibodies before annexin V/7-AAD staining. At least 2 × 10⁴ events for cell lines or 2 × 10⁵ events for primary AML samples were analyzed for each condition on a BD LSR II flow cytometer.
Data analysis was performed by using FlowJo 9.3 software for Mac OS X (Treestar). Cells that were negative for annexin V and 7-AAD were scored as viable, and the viability of treated cells was normalized to untreated controls. Data are represented as percent cell death.
Colony-forming assay
Colony-forming assay was performed as described earlier.29 Briefly, primary AML cells were cultured for 24 hours in the presence or absence of BCL6 peptide inhibitor or AraC. Cells were plated at 2.5 × 10⁴ cells/mL in MethoCult H4434 (Stem Cell Technologies). Colonies were scored after 14 days of culture.
Results
BCL6 is expressed in primary human AML cells
To elucidate a potential role of BCL6 in AML cells, we first analyzed its relative transcript abundance among 2 independent cohorts of patients newly diagnosed with AML (520 cases by microarray,30,31 and 531 cases by RNA-sequencing32 ) (Figure1A; supplemental Figure 1, available on the Blood Web site). To facilitate comparison with normal hematopoietic cells, BCL6 expression levels were normalized to a panel of 16 housekeeping genes. BCL6 expression in AML cells was found to be significantly higher than in either hematopoietic stem cells (HSCs) or granulocyte-monocyte progenitor cells (GMPs). Such an increase in BCL6 expression was observed in association with genetic lesions such as inv(16), deletion 3q, and somatic mutations affecting DNMT3A, RAS, and NPM1. When considering FAB status, expression was in the higher range among phenotypically immature AMLs (Figure 1B), as well as the monoblastic and monocytic leukemias (M4 and M5), consistent with the inv(16) cases). Among normal hematopoietic cells, BCL6 was expressed at moderate levels in HSCs and GMPs, and at lower levels in other progenitor subsets. The highest levels were observed in monocytes and neutrophils, where BCL6 is known to contribute to their inflammatory functions.33,34 Analysis of normalized BCL6 expression in a broader set of hematopoietic and lymphoid cells confirmed variable levels of BCL6 in different cell types, with the highest levels occurring in germinal center B cells, monocytes, and neutrophils (supplemental Figure 2).
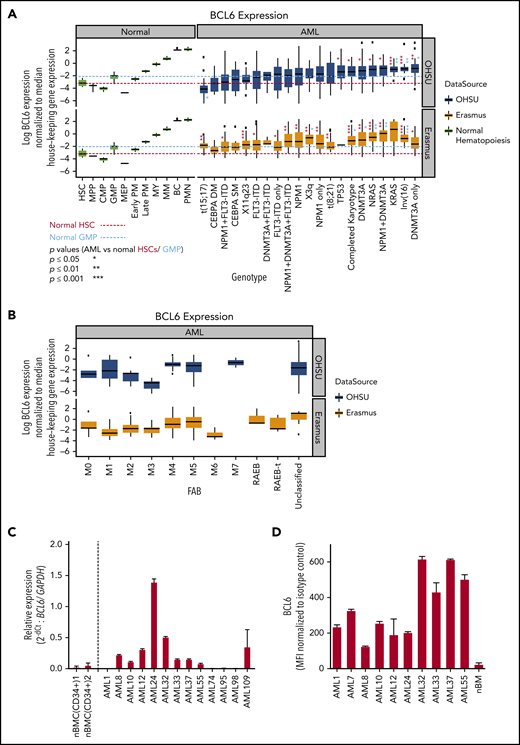
BCL6 expression in AML subclasses is heterogeneous. (A) BCL6 expression was compared between normal human hematopoietic cells (GSE42519 and human primary cell atlas) and human AML cells using 2 different AML cohorts. Using 2 independent cohorts of AML from Oregon Health & Science University (OHSU; 531 cases) and Erasmus (520 cases), BCL6 expression level normalized by housekeeping genes (RRN18S, ACTB, GAPDH, PGK1, PPIA, RPL13A, RPLP0, ARBP, B2M, YWHAZ, SDHA, TFRC, GUSB, HMBS, HPRT1, and TBP) was compared between molecular markers. Trends for biomarkers and BCL6 expression level were compared between 2 cohorts, each of which was compared with normal hematopoietic cells. Red and blue dotted lines are placed as a reference for the levels of expression for HSC and GMP, respectively. Statistical differences for BCL6 expression were calculated between each of the AML categories vs median values of either normal HSCs or GMPs. Asterisks represent the significance in either red or blue in comparisons vs HSCs or GMPs, respectively. (B) Expression level of BCL6 was compared in the same AML cohorts between different FAB subclasses. (C) Primary AML cells were subjected to quantitative reverse transcription polymerase chain reaction to compare expression levels of BCL6 either among primary AML cells or to reference normal donor blood cells. For primary AML specimens, bulk AML cells were subjected to blast purification (MACS sorting to exclude CD3 positive and CD19 positive cells), and BM cells were sorted for CD34 positive cells (using MACS). Relative expression of BCL6 was calculated by normalization to GAPDH (glyceraldehyde-3-phosphate dehydrogenase). Histograms represent averages of duplicates, and error bars are standard deviations. (D) Expression levels of BCL6 were analyzed by intracellular staining and flow cytometry. Expression levels of AML cells were compared vs those of normal BM cells. Mean fluorescence intensity (MFI) values were normalized to isotype control. Experiments were done in triplicates, and the mean from 3 independent experiments was plotted. Error bars indicate standard deviations. BC, band cell; CMP, common myeloid progenitor cell; MEP, megakaryocyte-erythroid progenitor cell; MM, metamyelocytes; MPP, multipotential progenitors; MY, myelocyte; nBMC (CD34+), CD34 positive normal bone marrow cells; PM, promyelocyte; PMN, polymorphonuclear cells.
BCL6 expression in AML subclasses is heterogeneous. (A) BCL6 expression was compared between normal human hematopoietic cells (GSE42519 and human primary cell atlas) and human AML cells using 2 different AML cohorts. Using 2 independent cohorts of AML from Oregon Health & Science University (OHSU; 531 cases) and Erasmus (520 cases), BCL6 expression level normalized by housekeeping genes (RRN18S, ACTB, GAPDH, PGK1, PPIA, RPL13A, RPLP0, ARBP, B2M, YWHAZ, SDHA, TFRC, GUSB, HMBS, HPRT1, and TBP) was compared between molecular markers. Trends for biomarkers and BCL6 expression level were compared between 2 cohorts, each of which was compared with normal hematopoietic cells. Red and blue dotted lines are placed as a reference for the levels of expression for HSC and GMP, respectively. Statistical differences for BCL6 expression were calculated between each of the AML categories vs median values of either normal HSCs or GMPs. Asterisks represent the significance in either red or blue in comparisons vs HSCs or GMPs, respectively. (B) Expression level of BCL6 was compared in the same AML cohorts between different FAB subclasses. (C) Primary AML cells were subjected to quantitative reverse transcription polymerase chain reaction to compare expression levels of BCL6 either among primary AML cells or to reference normal donor blood cells. For primary AML specimens, bulk AML cells were subjected to blast purification (MACS sorting to exclude CD3 positive and CD19 positive cells), and BM cells were sorted for CD34 positive cells (using MACS). Relative expression of BCL6 was calculated by normalization to GAPDH (glyceraldehyde-3-phosphate dehydrogenase). Histograms represent averages of duplicates, and error bars are standard deviations. (D) Expression levels of BCL6 were analyzed by intracellular staining and flow cytometry. Expression levels of AML cells were compared vs those of normal BM cells. Mean fluorescence intensity (MFI) values were normalized to isotype control. Experiments were done in triplicates, and the mean from 3 independent experiments was plotted. Error bars indicate standard deviations. BC, band cell; CMP, common myeloid progenitor cell; MEP, megakaryocyte-erythroid progenitor cell; MM, metamyelocytes; MPP, multipotential progenitors; MY, myelocyte; nBMC (CD34+), CD34 positive normal bone marrow cells; PM, promyelocyte; PMN, polymorphonuclear cells.
To further validate these results, we obtained a randomly selected set of newly diagnosed AML patient specimens as well as normal BM CD34+ cells and performed quantitative reverse transcription polymerase chain reaction to measure BCL6 transcript abundance (Figure 1C). This analysis revealed variable but generally higher expression of BCL6 compared with normal HSCs. We also evaluated BCL6 protein expression using flow cytometry in some of the same primary AML specimens as well as healthy donor BM cells, confirming that BCL6 is generally expressed at higher levels in leukemia cells (Figure 1D). We also measured BCL6 protein abundance in B cells, T cells, monocytes and lineage-negative BM–mononuclear cells (MNCs) sorted from healthy donor BM specimens, as well as from B cells, T cells, and leukemic blasts sorted from 5 additional patients with AML (supplemental Figure 3). The highest expression was observed in monocytes, and in these AML cases, BCL6 protein expression was equivalent to that of BM-MNCs. Collectively, these data show that many patients with AML express significant levels of BCL6, often at higher than normal levels in the case of phenotypically immature AMLs. BCL6 expression was also high in monocytic leukemias, although this may simply reflect the naturally high BCL6 levels observed in monocytes.
BCL6 is required to maintain survival of primary AML cells
We next tested whether pharmacologic inhibition of BCL6 could kill AML cells. A series of 55 newly diagnosed and viable AML specimens were randomly selected for exposure to a retro-inverso BCL6 peptide inhibitor (RI-BPI), a well-characterized and specific inhibitor of the BCL6 BTB domain.17 Primary AML cells were treated with 10 μM RI-BPI (the average EC50 dose for BCL6-dependent DLBCL cells) or vehicle for 48 hours and then examined by annexin V/7-AAD flow cytometry for evidence of cell viability. Among these specimens, 52% (n = 29 of 55) manifested >50% cell death at this time point (Figure 2A-B; supplemental Tables 1 and 2). Segregating these patients according to mutation profiles revealed trends for certain somatic mutations being linked to response or resistance, although this study was underpowered to determine statistical significance (Figure 2C). To determine whether there was any correlation between BCL6 expression and response to RI-BPI, we compared the abundance of this protein in primary AML specimens and AML cell lines, vs the relative fraction of viable cells after exposure to RI-BPI. A significant correlation was observed between BCL6 protein abundance and response to RI-BPI (P = .04 for primary AML cells) (Figure 2D-E; supplemental Figure 4).
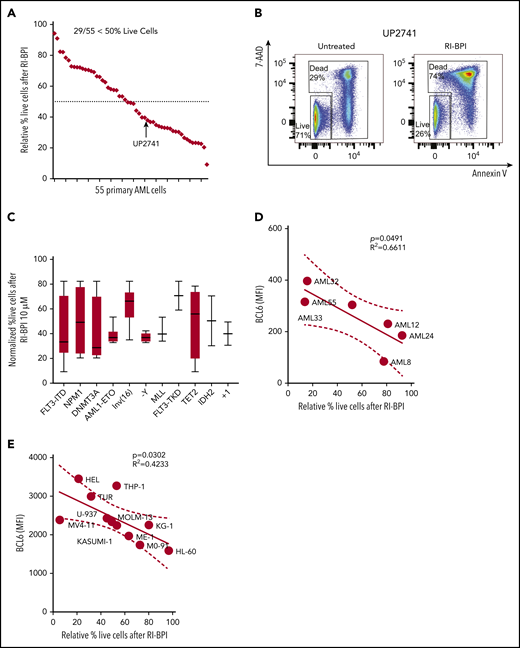
BCL6-targeted peptide inhibitors induced significant apoptosis associated with differential expression of BCL6 genes in primary AML cells. (A) Fifty-five different AML cells were subjected to ex vivo treatment with 10 μM RI-BPI for 48 hours. The relative percentage of live cells (annexin V negative/7-AAD negative) were plotted and sorted from lowest (left) to highest (right) sensitivity to RI-BPI. Dotted line indicates 50% of relative live cell percentage with RI-BPI treatment. Profiles of each of the primary cells used in the analysis are provided in supplemental Table 1. (B) Representative flow cytometry data to show how dead cells were detected, with a comparison between untreated and RI-BPI–treated cells. (C) Based on mutational profiles of the 55 primary AML cells, normalized percent live cells after RI-BPI (10 mM, 48 hours) treatment was compared between subgroups with different molecular markers. Linear regression analysis showing a correlation between sensitivity to RI-BPI and expression level of BCL6 in 6 different primary AML cells (D) and in 11 different AML cell lines (E). MFI, mean fluorescence intensity.
BCL6-targeted peptide inhibitors induced significant apoptosis associated with differential expression of BCL6 genes in primary AML cells. (A) Fifty-five different AML cells were subjected to ex vivo treatment with 10 μM RI-BPI for 48 hours. The relative percentage of live cells (annexin V negative/7-AAD negative) were plotted and sorted from lowest (left) to highest (right) sensitivity to RI-BPI. Dotted line indicates 50% of relative live cell percentage with RI-BPI treatment. Profiles of each of the primary cells used in the analysis are provided in supplemental Table 1. (B) Representative flow cytometry data to show how dead cells were detected, with a comparison between untreated and RI-BPI–treated cells. (C) Based on mutational profiles of the 55 primary AML cells, normalized percent live cells after RI-BPI (10 mM, 48 hours) treatment was compared between subgroups with different molecular markers. Linear regression analysis showing a correlation between sensitivity to RI-BPI and expression level of BCL6 in 6 different primary AML cells (D) and in 11 different AML cell lines (E). MFI, mean fluorescence intensity.
BCL6 is dispensable for normal hematopoietic stem cells
To determine whether BCL6 is also required to maintain the survival of normal hematopoietic cells, we exposed 3 healthy donor BM-MNC specimens to the BCL6 BTB domain inhibitor FX1,16 and observed no evidence of toxicity (supplemental Figure 5A). Analysis of CD34+ cells in these specimens revealed a reduction in these cells in 1 of 3 cases (supplemental Figure 5B-C). However, FX1 did not impair colony formation by BM-MNCs, nor alter the type of colonies formed by these cells (supplemental Figure 6A-E). As expected, FX1 was also nontoxic to B cells, T cells, monocytes, and lineage-negative BM-MNCs (supplemental Figure 7A). To further explore whether BCL6 is important to the function of normal hematopoietic progenitor cells, we compared and contrasted the ability of Bcl6−/− vs WT BM cells to engraft and re-establish hematopoiesis in lethally irradiated syngeneic recipient animals (supplemental Figure 7B). However, there was no evidence of impairment in engraftment or expansion of stem or progenitor cell populations, confirming that BCL6 is not required for normal hematopoiesis. Taken together, these data suggest that BCL6-targeted therapy can kill AML cells without affecting normal hematopoietic stem/progenitor cells, suggesting that BCL6 is a tractable therapeutic target in this disease.
BCL6 inhibitors induce checkpoint response gene sets and suppress stem cell transcriptional programs in AML cells
To identify genes regulated by BCL6 in primary AML cells, RNA-sequencing was performed in triplicate using leukemic blasts from 3 de novo AML patients (supplemental Table 1) after treatment with FX1 at their respective EC50 concentrations for 12 hours. Gene Set Enrichment Analysis based on the ranked genes from these different patient specimens revealed significant perturbation in known BCL6-regulated functions. For example, we observed significant downregulation of E2F target genes associated with proliferation and genes that are downregulated in apoptotic cells35 (Figure 3A-G). We observed upregulation of gene sets known to be repressed by BCL6 such as oxidative stress, TP53 target genes,11,36-38 and UV response genes.39 There was also upregulation of genes induced by FX1 in lymphoma cells,16 genes induced in BCL6-deleted lymphomas,40 and HDAC3 (histone deacetylase 3) target genes.41 Of particular note was the significant downregulation of genes expressed in hematopoietic stem cells, genes induced by HOXA9 and MEIS1, and genes that become repressed in myeloid differentiation, suggesting that BCL6 might contribute to maintaining stem cell–like functions in AML cells. Despite the heterogeneity among AML specimens, we were able to identify a core FX1 transcriptional signature based on genes differentially expressed in all 3 cases, which featured downregulation of cell proliferation genes such as CDK4 and MYC and upregulation of genes linked to p53 and oxidative stress response such as FBXW10, HIPK2, and HMOX1 (supplemental Figure 8; supplemental Table 3). There was also downregulation of MAD2L, which is required for mitotic spindle assembly, and NME1, TFAP4, and MSH5, which are expressed in HSCs. A number of FX1-induced genes in AML overlap with FX1 signatures from B-cell lymphoma cells (eg, autophagy regulator BAG3,42,43 hypoxia-induced ADM44-46 ).
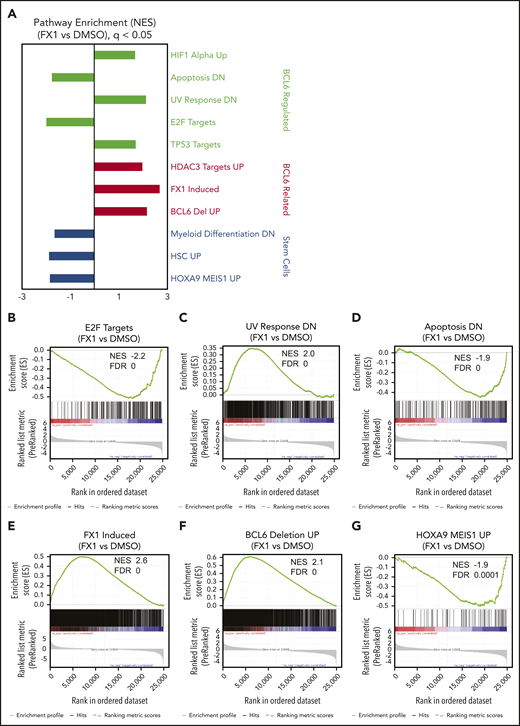
Inhibition of BCL6 in AML cells resulted in regulations of multiple numbers of biologically important pathways. Three primary AML cells (AML37, AML95, and AML98) were treated with FX1 using the concentration for EC50 in pilot ex vivo treatment experiments, for 12 hours. RNA was extracted from dimethyl sulfoxide (DMSO)- or FX1-treated cells and subjected to RNA-sequencing. (A) After a consensus clustering of gene expression profiles, GSEA was performed between FX1-treated and DMSO-treated AML cells. Representative gene signatures are highlighted and sorted with biological functions shown at the right. (B-G) Enrichment plots of regulated gene signatures of interest obtained by GSEA analysis showing enrichments in FX1-treated vs DMSO. NES and FDR values are attached for each of the gene sets.
Inhibition of BCL6 in AML cells resulted in regulations of multiple numbers of biologically important pathways. Three primary AML cells (AML37, AML95, and AML98) were treated with FX1 using the concentration for EC50 in pilot ex vivo treatment experiments, for 12 hours. RNA was extracted from dimethyl sulfoxide (DMSO)- or FX1-treated cells and subjected to RNA-sequencing. (A) After a consensus clustering of gene expression profiles, GSEA was performed between FX1-treated and DMSO-treated AML cells. Representative gene signatures are highlighted and sorted with biological functions shown at the right. (B-G) Enrichment plots of regulated gene signatures of interest obtained by GSEA analysis showing enrichments in FX1-treated vs DMSO. NES and FDR values are attached for each of the gene sets.
BCL6 inhibitors suppress leukemia stem/repopulating cell functions
Given the link between BCL6 and stem cell transcriptional profiles, we next quantified BCL6 protein levels in immunophenotypically defined LSCs (CD45dim, CD34+/CD38–) vs more mature progenitor-like cells (CD45dim, CD34+/CD38+) from primary AML specimens. These studies revealed that BCL6 protein is generally expressed at fairly equivalent levels in LSCs and bulk AML cells (Figure 4A-B). In AMLs, LSCs have been described as contributing to disease relapse. We therefore evaluated the sensitivity of LSCs from 3 different primary AML specimens to RI-BPI and observed dose-dependent killing of the LSCs at similar concentrations as bulk AML cells (Figure 4C-D). A similar effect was observed using FX1 against AML specimens examining cell viability by flow cytometry using Zombie Green dye (BioLegend) (supplemental Figure 9A-B). Because leukemia stem/repopulating cell capacity is not necessarily restricted to phenotypic LSCs but is believed to be critical for relapse, we next evaluated colony-forming ability from 9 newly diagnosed primary AML samples treated with RI-BPI (5 μM). We found that BCL6 inhibition resulted in significant reduction of colony formation compared with vehicle in most cases (Figure 4E). We next tested whether RI-BPI could impair the leukemia-initiating capacity of AML cells implanted in immunodeficient mice.38 For this, primary AML cells from 2 different patients were treated with RI-BPI, control peptide, or vehicle for 24 hours ex vivo and then administered to NOD/SCID mice (Figure 4F). Inhibition of BCL6 resulted in significant reduction of engraftment compared with controls (P = .002) (Figure 4G). As an alternative approach for inhibition of BCL6, AML cells were transfected with a previously published and validated specific siRNA to knock down BCL6 before engraftment (Figure 4H; supplemental Figure 9C).47-50 Similar to the case of RI-BPI, BCL6 knockdown resulted in impaired development of leukemia in recipient mice compared with control siRNA (P = .01) (Figure 4I). Collectively, the data suggest that targeting BCL6 impairs leukemia self-renewal and repopulating capacity.
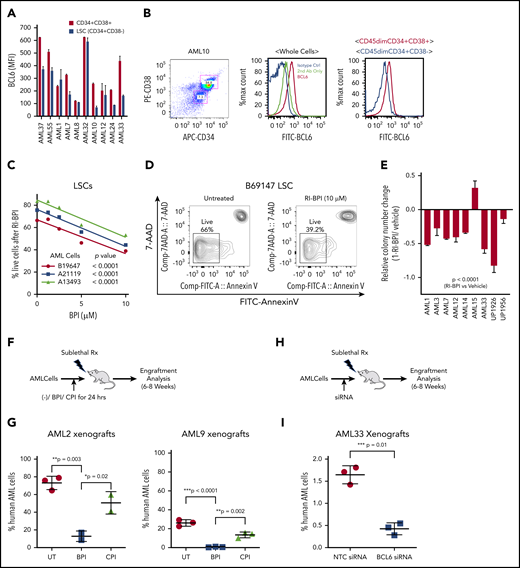
BCL6 inhibition ablates LSCs. (A) Measurement of expression levels of BCL6 in LSCs (CD45dim, CD34+, and CD38–) and blast cells (CD45dim, CD34+, and CD38+) were measured by intracellular staining and flow cytometry. Averages of absolute mean fluorescence intensity (MFI) values of PE-BCL6 are shown from triplicates, with standard deviations as error bars. (B) Representative flow cytometry data of the analysis done in (A). (C) Three different primary AML cells were treated with 10 μM RI-BPI for 48 hours, and percentages of dead cells were measured by using annexin V–fluorescein isothiocyanate (FITC) staining and flow cytometry. P values indicate significance of correlations between dose and percent live cells for each of the primary AML cells. (D) Representative flow cytometry density plots to compare untreated and RI-BPI treatment. (E) Primary AML cells were treated with 10 μM RI-BPI for 24 hours in duplicates, and colony numbers were counted after 14 days. Values were normalized to vehicle-treated controls. The data are plotted as mean of duplicates. Error bars indicate standard deviation. (F) Schematic illustration and (G) comparison of results in 2 different in vivo behaviors of AML cells treated with a BCL6 inhibitor. Two primary AML cells (AML2 and AML9) were subjected to 24 hours of ex vivo pretreatment with either RI-BPI (5 μM), control peptide inhibitor (CPI), or were untreated (UT). The treated cells were then injected into patient-derived xenograft recipient mice. Six to 8 weeks after the injection, percentages of human AML cells were monitored by measuring mCD45–, hCD45+, and hCD33+ cells in the BM aspirates. Schematic illustration (H) and comparison of results (I) of in vivo engraftment of AML cells transfected with BCL6 siRNA. BCL6 or nonspecific control siRNA transfected AML cells (AML33) were injected in mice. The plot shows the percentages of human AML cells in the presence or absence of BCL6 knockdown. Rx, radiation.
BCL6 inhibition ablates LSCs. (A) Measurement of expression levels of BCL6 in LSCs (CD45dim, CD34+, and CD38–) and blast cells (CD45dim, CD34+, and CD38+) were measured by intracellular staining and flow cytometry. Averages of absolute mean fluorescence intensity (MFI) values of PE-BCL6 are shown from triplicates, with standard deviations as error bars. (B) Representative flow cytometry data of the analysis done in (A). (C) Three different primary AML cells were treated with 10 μM RI-BPI for 48 hours, and percentages of dead cells were measured by using annexin V–fluorescein isothiocyanate (FITC) staining and flow cytometry. P values indicate significance of correlations between dose and percent live cells for each of the primary AML cells. (D) Representative flow cytometry density plots to compare untreated and RI-BPI treatment. (E) Primary AML cells were treated with 10 μM RI-BPI for 24 hours in duplicates, and colony numbers were counted after 14 days. Values were normalized to vehicle-treated controls. The data are plotted as mean of duplicates. Error bars indicate standard deviation. (F) Schematic illustration and (G) comparison of results in 2 different in vivo behaviors of AML cells treated with a BCL6 inhibitor. Two primary AML cells (AML2 and AML9) were subjected to 24 hours of ex vivo pretreatment with either RI-BPI (5 μM), control peptide inhibitor (CPI), or were untreated (UT). The treated cells were then injected into patient-derived xenograft recipient mice. Six to 8 weeks after the injection, percentages of human AML cells were monitored by measuring mCD45–, hCD45+, and hCD33+ cells in the BM aspirates. Schematic illustration (H) and comparison of results (I) of in vivo engraftment of AML cells transfected with BCL6 siRNA. BCL6 or nonspecific control siRNA transfected AML cells (AML33) were injected in mice. The plot shows the percentages of human AML cells in the presence or absence of BCL6 knockdown. Rx, radiation.
BCL6 expression is induced by chemotherapeutic agents
The requirement of BCL6 to maintain AML cell repopulating properties prompted us to explore whether expression of BCL6 was linked to chemotherapy responsiveness. Indeed, we observed a significant inverse correlation between basal abundance of BCL6 protein and response to AraC among AML cell lines (Figure 5A). BCL6 is induced at both the messenger RNA and protein levels by a variety of cellular stresses, including exposure to chemotherapy, which may enable cells to tolerate stressors such as cytotoxic agents.51 Along these lines, we observed that exposure to AraC induced variable upregulation of BCL6 in primary AML and cell lines (Figure 5B-D; supplemental Figure 11). Moreover, the extent of AraC-associated BCL6 induction was inversely correlated with the cell-killing effect of this chemotherapy drug. To determine whether AraC-associated BCL6 upregulation also occurs in vivo, we allowed primary AML cells to engraft in sublethally irradiated NOD/SCID mice (Figure 5E). Once leukemia cells had engrafted, mice were randomized to receive either AraC (60 mg/ kg) or vehicle intraperitoneally for 5 days, after which BM cells were collected for flow cytometry. Gating on human CD45+ AML cells revealed that AraC induced a significant increase in the abundance of BCL6 compared with vehicles (Figure 5F). Finally, we also examined if other drugs with activity against AML cells could induce BCL6 expression. AML cells were exposed to the topoisomerase II inhibitor doxorubicin (500 nM), the FLT3 inhibitor lestaurtinib (500 nM), the HDAC inhibitor SAHA (2 μM), the PKC activator and differentiating agent TPA (20 nM), and the DNA methyltransferase inhibitor 5-azacytidine (5 μM), as well as AraC (625 nM) and BCL6 abundance measured by using flow cytometry. Doxorubicin induced consistent upregulation of BCL6 in all 3 cell lines, whereas AraC and TPA upregulated BCL6 in 2 of the 3 cell lines tested. In contrast, lestaurtinib SAHA and 5-azacytidine did not induce BCL6 (Figure 5G; supplemental Figure 10). Hence, reactive induction of BCL6 in AML is most strongly linked with exposure to chemotherapy drugs.
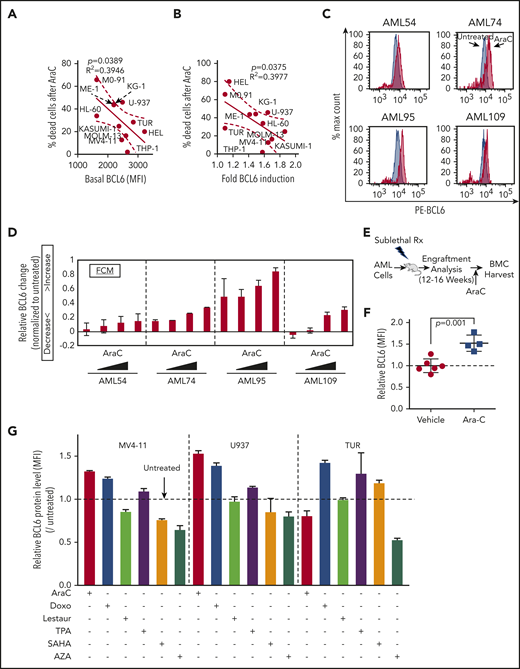
BCL6 is induced in AML cells treated with chemotherapeutic agents. (A) Linear regression analysis showing correlation between basal BCL6 expression and sensitivity to AraC treatment in 11 different AML cell lines. (B) Linear regression analysis showing correlation between fold induction of BCL6 expression and sensitivity to AraC treatment (1.25 μM) using 11 different AML cell lines. Fold inductions in each of the cells were calculated based on mean fluorescence intensity (MFI) values by comparing treated vs untreated cells. (C-D) Induction of BCL6 in 4 different primary AML cells (AML54, AML74, AML95, and AML109) treated with AraC (111, 333, 1000, and 3000 nM, for 24 hours) in duplicates. Relative MFI of PE-BCL6 in each of the cells. The fold induction was calculated by normalization to untreated samples, and fractions of increase/decrease are presented. The data are plotted as averages of duplicates. Error bars indicate standard deviation. (E) Schematic illustration of BCL6 expression analysis after Ara C in vivo treatment of AML patient-derived xenografts. (F) Plot showing induction of BCL6 expression following engraftment of AML cells pretreated with AraC. (G) Analysis of BCL6 protein levels in AML cell lines treated with 6 different therapeutic drugs. BCL6 expression was evaluated by using flow cytometry. Rx, radiation.
BCL6 is induced in AML cells treated with chemotherapeutic agents. (A) Linear regression analysis showing correlation between basal BCL6 expression and sensitivity to AraC treatment in 11 different AML cell lines. (B) Linear regression analysis showing correlation between fold induction of BCL6 expression and sensitivity to AraC treatment (1.25 μM) using 11 different AML cell lines. Fold inductions in each of the cells were calculated based on mean fluorescence intensity (MFI) values by comparing treated vs untreated cells. (C-D) Induction of BCL6 in 4 different primary AML cells (AML54, AML74, AML95, and AML109) treated with AraC (111, 333, 1000, and 3000 nM, for 24 hours) in duplicates. Relative MFI of PE-BCL6 in each of the cells. The fold induction was calculated by normalization to untreated samples, and fractions of increase/decrease are presented. The data are plotted as averages of duplicates. Error bars indicate standard deviation. (E) Schematic illustration of BCL6 expression analysis after Ara C in vivo treatment of AML patient-derived xenografts. (F) Plot showing induction of BCL6 expression following engraftment of AML cells pretreated with AraC. (G) Analysis of BCL6 protein levels in AML cell lines treated with 6 different therapeutic drugs. BCL6 expression was evaluated by using flow cytometry. Rx, radiation.
Therapeutic targeting of BCL6 sensitizes AMLs to chemotherapy
The fact that BCL6 expression was negatively correlated with response to AraC prompted us to investigate whether targeting BCL6 could enhance the response of AML cells to chemotherapy. To assess for a potential additive or synergistic effect between BCL6 inhibitor and chemotherapy, we exposed 5 primary AML specimens to increasing doses of AraC and FX1 ex vivo and then examined viable cell counts after 48 hours. These results revealed that this combination was synergistic in most cases, although synergy was concentration dependent in 3 of the cases52,53 (Figure 6A). We next examined the effect of combination treatment on the colony-forming capacity of primary AML cells using colony formation assays. AraC generally enhanced suppression of colonies by RI-BPI with the exception of one case that manifested marked suppression of colonies by AraC (Figure 6B; supplemental Figure 11A). We also tested the impact of BCL6 knockdown on response to AraC. Primary AML cells were transfected with BCL6 siRNA or control and after 48 hours exposed to AraC (312 nM). BCL6 knockdown sensitized primary AML cells to this chemotherapy agent (Figure 6C). The same cells were examined in colony-forming cell assays in which knockdown of BCL6 caused modest but significant reduction (Figure 6D-F). Consistent with our cell line data indicating that higher levels of BCL6 was linked to lesser response to AraC, we also observed that normalized lower quartile BCL6 expression was significantly associated with outcome in a Cox proportional hazards model (supplemental Figure 11B). Collectively, these data suggest that BCL6 can at least partially protect AML cells from the effect of chemotherapy drugs, and BCL6 inhibitors can overcome this effect.
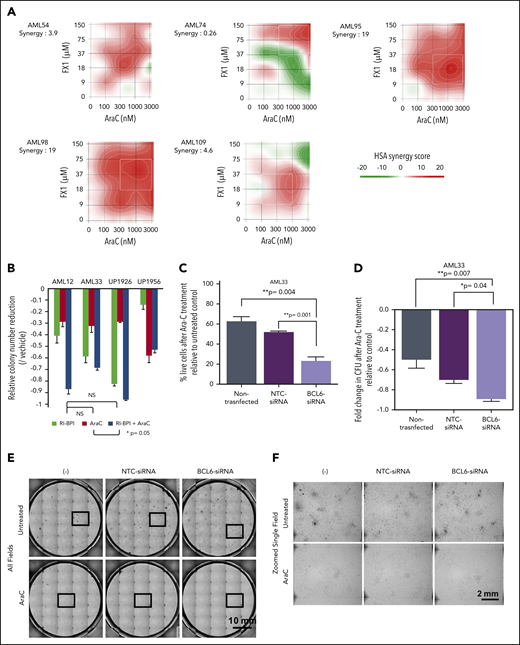
Combination of BCL6 inhibitor and AraC mediates synergistic effects. (A) Five primary AML specimens (AML54, AML74, AML95, AML98, and AML109) were subjected to ex vivo combination therapy using AraC and FX1 with various combinations of limiting dilution assay. Matrices indicate calculated synergy scores obtained from each pair of combination doses. Synergy scores were calculated by using SynergyFinder software. The highest single agent (HSA) algorithm was used to calculate synergy scores, and color keys indicate the scores in heatmaps. (B) Colony formation assay in primary AML cells treated with AraC, BPI, or combination of both. Statistical significance between each of the conditions was calculated by one-way analysis of variance. (C) Evaluation of cell deaths in primary AML cells (AML33) treated with AraC in the presence or absence of siRNA-induced BCL6 knockdown. Primary AML cells (AML33) were transiently transfected with control or BCL6 siRNA; the cells were then treated with AraC in duplicates. Relative percent dead cells were calculated by normalization to untreated cells. Comparing the relative percent dead cells vs that of parental AML33 cells treated with AraC, the increase of dead cells with each siRNA is presented as relative values. Averages were obtained from duplicates, and error bars represent standard deviations. (D) The same series of primary AML33 cells as (C) were subjected to colony formation assays after 24 hours of ex vivo treatment with AraC. The number of colonies was evaluated after 14 days. Colony counts were compared between untreated and AraC treatment to obtain relative colony numbers, and relative colony number reductions were obtained by comparing the relative values vs parental AML cells. In (C) and (D), statistical significance was evaluated by using an unpaired Student t test. (E) Representative photographs of colony formation assays. Thirty-five (7 × 5) pictures of single fields were tiled to show entire views of each plate. (F) Representative fields marked by the box in (E) were presented in zoomed views. CFU, colony-forming unit; NS, not significant; NTC, nontargeting control.
Combination of BCL6 inhibitor and AraC mediates synergistic effects. (A) Five primary AML specimens (AML54, AML74, AML95, AML98, and AML109) were subjected to ex vivo combination therapy using AraC and FX1 with various combinations of limiting dilution assay. Matrices indicate calculated synergy scores obtained from each pair of combination doses. Synergy scores were calculated by using SynergyFinder software. The highest single agent (HSA) algorithm was used to calculate synergy scores, and color keys indicate the scores in heatmaps. (B) Colony formation assay in primary AML cells treated with AraC, BPI, or combination of both. Statistical significance between each of the conditions was calculated by one-way analysis of variance. (C) Evaluation of cell deaths in primary AML cells (AML33) treated with AraC in the presence or absence of siRNA-induced BCL6 knockdown. Primary AML cells (AML33) were transiently transfected with control or BCL6 siRNA; the cells were then treated with AraC in duplicates. Relative percent dead cells were calculated by normalization to untreated cells. Comparing the relative percent dead cells vs that of parental AML33 cells treated with AraC, the increase of dead cells with each siRNA is presented as relative values. Averages were obtained from duplicates, and error bars represent standard deviations. (D) The same series of primary AML33 cells as (C) were subjected to colony formation assays after 24 hours of ex vivo treatment with AraC. The number of colonies was evaluated after 14 days. Colony counts were compared between untreated and AraC treatment to obtain relative colony numbers, and relative colony number reductions were obtained by comparing the relative values vs parental AML cells. In (C) and (D), statistical significance was evaluated by using an unpaired Student t test. (E) Representative photographs of colony formation assays. Thirty-five (7 × 5) pictures of single fields were tiled to show entire views of each plate. (F) Representative fields marked by the box in (E) were presented in zoomed views. CFU, colony-forming unit; NS, not significant; NTC, nontargeting control.
BCL6 inhibitors enhance chemotherapy response and suppress leukemia repopulating activity in vivo
To determine whether the benefit of combining AraC and BCL6 inhibitors would yield superior efficacy in vivo, we implanted primary AML cells into NOD/SCID mice. After confirming the engraftment by measuring percentages of hCD45+ cells in BM, mice were randomized to receive AraC (10 mg/kg, once a day, 5 days), RI-BPI (25 mg/kg, twice a week for 3 weeks), or combination therapy (Figure 7A). The abundance of human AML cells in the BM was measured upon completion of treatment. Whereas AraC alone did not induce any reduction of human AML cells, RI-BPI did significantly reduce tumor burden vs controls (P = .01) (Figure 7B). The combination of AraC with RI-BPI yielded the highest effects among all (lowest P value compared with control, P = .0003). Although there was a trend for improved response vs RI-BPI alone, this did not reach statistical significance.

Combination therapy using BCL inhibitor and AraC. (A) Schematic illustration of serial BM transplantation (BMT) assay. (B) Primary AML cells were transplanted in recipient mice and treated with AraC (10 mg/kg), BPI (25 mg/ kg), or in combination for 3 weeks after confirming engraftment. Percent human AML cells in each arm was compared. (C) BM cells were harvested and transplanted into new recipient mice (secondary transplant). NS, not significant; PDX, patient-derived xenograft.
Combination therapy using BCL inhibitor and AraC. (A) Schematic illustration of serial BM transplantation (BMT) assay. (B) Primary AML cells were transplanted in recipient mice and treated with AraC (10 mg/kg), BPI (25 mg/ kg), or in combination for 3 weeks after confirming engraftment. Percent human AML cells in each arm was compared. (C) BM cells were harvested and transplanted into new recipient mice (secondary transplant). NS, not significant; PDX, patient-derived xenograft.
To evaluate whether this therapeutic benefit extended to enhanced suppression of leukemia repopulating activity, we next performed secondary transplantation using an equal number of viable human AML cells from the mice treated earlier to secondary recipients (Figure 7A). Tumor burden was assessed 8 weeks after transplant. As before, AMLs treated with AraC alone were barely affected by this drug, whereas RI-BPI treatment yielded significant suppression of leukemia burden (P = .005) (Figure 7C). The effect of combination therapy seemed even greater than RI-BPI alone but again did not reach statistical significance. Taken together, these data underline the potent antileukemia repopulating cell effect of BCL6-targeted therapy and suggest that combination of chemotherapy plus RI-BPI can yield superior antileukemic effects.
Discussion
Our findings clearly suggest that BCL6 plays an important role in maintaining proliferation, survival, and the undifferentiated state of AML, especially those with less mature phenotypes. Here we show that BCL6 is expressed in AML, although the level of expression is varied among cases with distinct genetic backgrounds. Our data suggest that BCL6 expression in AML cells occurs through several different scenarios. First and foremost, we observed an apparent pathogenic expression of BCL6 in immature, progenitor-like AML cells, in association with certain oncogenic mutations, such as RAS, NPM1, and DNMT3A. This is in contrast to normal hematopoietic stem and progenitor cells, which mostly express BCL6 at lower levels. Moreover, we show that BCL6 loss of function through genetic ablation or the use of BTB domain–targeted inhibitors has no deleterious effects against normal hematopoietic stem and progenitor cells, underlining the pathogenic nature of BCL6 function in immature phenotype AMLs. Second, we observed a relatively high expression of BCL6 in monocyte leukemias such as inv(16) AMLs. This outcome is in line with the normally high expression of BCL6 in normal monocytes and is most likely simply a reflection of the monocytic lineage of these tumors.8,54 Finally, we observed inducible expression of BCL6 due to exposure of AML cells to chemotherapy drugs, consistent with reports indicating that BCL6 functions downstream of stress response pathways to induce stress tolerance.51
BCL6 contains 3 distinct protein domains (N-terminal BTB domain, intermediate RD2 domain, and C-terminal Zn finger domain), each of which mediates different biochemical and biological functions.8 The BCL6 BTB domain plays a key role in its transcriptional repressor function and its evolutionarily conserved stress response function.51 This function is critical to the survival of lymphomas, as well as B-cell acute lymphoblastic leukemia and solid tumors.55-57 However, recruitment of corepressors through the BTB domain is not crucial to the effect of BCL6 in monocytes, perhaps explaining why inv(16) AMLs are not highly responsive to BCL6 BTB domain inhibitors, Indeed, the effect of BCL6 in normal monocytes is largely confined to suppressing inflammatory gene expression under basal conditions, through direct competition with STAT proteins for chemokine and other inflammatory genes.38,58 Along these lines, mice bearing mutations in the BCL6 BTB domain exhibit perfectly normal monocyte functions but complete loss of the BCL6 survival mechanism in germinal center B cells.59 Our data suggest that immature AMLs are dependent on BCL6 in a manner that is at least partially reflective of the germinal center function of BCL6. This is further supported by our RNA-sequencing data showing that BCL6 inhibitors induce upregulation of canonical checkpoint gene sets that limit proliferation and survival.
Our data suggest that in addition to the classical stress response and checkpoint function, BCL6 contributes to maintain leukemia repopulating activity in AML cells. Although further work is required to deconvolute the mechanistic basis for this effect, this aspect of BCL6’s actions in AML are especially intriguing from the therapeutic standpoint, as very few therapies are able to suppress leukemia relapse even after inducing complete clinical remission. It is notable that a role for BCL6 in maintaining stemness was also reported to occur in the case of chronic myeloid leukemia, in which BCL6 inhibitors could impair CML stem functions that were not affected by tyrosine kinase inhibitors.60 Expression of BCL6 in AML was associated with increased dependency on BCL6 but also on reduced responsiveness to chemotherapy. This is likely a reflection of the stress response function of BCL6, and consistent with this notion, exposure to chemotherapy could further induce BCL6 in primary AML specimens. These considerations point to the rationale for combinatorial therapy using chemotherapy plus BCL6 inhibitors in AML. This treatment would be expected to benefit patients with AML, both by enhancing response to chemotherapy drugs as well as suppressing the ability of leukemia cell subpopulations from repopulating the disease to cause relapse.
RNA-sequencing data are available in the Gene Expression Omnibus database (accession number GSE133112).
The online version of this article contains a data supplement.
The publication costs of this article were defrayed in part by page charge payment. Therefore, and solely to indicate this fact, this article is hereby marked “advertisement” in accordance with 18 USC section 1734.
Acknowledgments
A.M. is supported by grants from the National Institutes of Health, National Cancer Institute (R01 CA198089 and 1UG 757 CA233332); LLS Specialized Center of Research 7013, LLS Specialized Center of Research 7006; the Chemotherapy Foundation; and the Samuel Waxman Cancer Research Foundation (1U01 CA180827). M.G. is supported by the National Cancer Institute (R01 CA172546 and R01 CA234478-01) and the Irma T. Hirschl/Monique Weill-Caulier Charitable Trust. B.W. and R.D. are funded by grants and fellowships from the Dutch Cancer Society, “Koningin Wilhelmina Fonds.”
Authorship
Contribution: K.C.K. conducted experiments, analyzed and interpreted data, organized the directions of computational analysis, and prepared the manuscript; H.Z. and S.W. conducted experiments and analyzed data; C.M. conducted computational analyses and prepared figures for those analyses; B.J.W., M.C., and R.D. provided primary cells and patient information on those samples; M.S. and S.G. partially conducted revised experiments; Z.C. assisted in data analyses and discussed the concepts; C.E.M. assisted in data analysis and discussed concepts; M.A. assisted with experiments; W.Y. provided technical support in the animal experiments; G.J.R. designed experiments and contributed to discussions; and M.L.G. and A.M. supervised and designed the whole project, wrote the paper, and discussed the concepts.
Conflict-of-interest disclosure: A.M. has research funding from Janssen and Sanofi; has consulted for Epizyme, Constellation, and Jubilant; and is on the advisory board of KDAC. M.G. has research funding from Cellectis, LAM Therapeutics, TemED ON therapeutics; and is a consultant for SeqRX. The remaining authors declare no competing financial interests.
Correspondence: Ari Melnick, Departments of Medicine and Pharmacology, Weill Cornell Medicine, 413 E. 69th St, New York, NY 10021, e-mail: amm2014@med.cornell.edu or Monica L. Guzman, Division of Hematology and Medical Oncology, Department of Medicine, Weill Cornell Medical College, 1300 York Ave, Box 113, New York, NY 10065; e-mail: mlg2007@med.cornell.edu.

This feature is available to Subscribers Only
Sign In or Create an Account Close Modal