

Key Points
Single-cell DNA amplicon sequencing reveals heterogeneity of NOTCH1 mutations at diagnosis of T-ALL.
Single-cell DNA amplicon sequencing detects clinically relevant clones at diagnosis and residual leukemic cells at remission.

Abstract
T-cell acute lymphoblastic leukemia (T-ALL) is an aggressive leukemia that is most frequent in children and is characterized by the presence of few chromosomal rearrangements and 10 to 20 somatic mutations in protein-coding regions at diagnosis. The majority of T-ALL cases harbor activating mutations in NOTCH1 together with mutations in genes implicated in kinase signaling, transcriptional regulation, or protein translation. To obtain more insight in the level of clonal heterogeneity at diagnosis and during treatment, we used single-cell targeted DNA sequencing with the Tapestri platform. We designed a custom ALL panel and obtained accurate single-nucleotide variant and small insertion-deletion mutation calling for 305 amplicons covering 110 genes in about 4400 cells per sample and time point. A total of 108 188 cells were analyzed for 25 samples of 8 T-ALL patients. We typically observed a major clone at diagnosis (>35% of the cells) accompanied by several minor clones of which some were less than 1% of the total number of cells. Four patients had >2 NOTCH1 mutations, some of which present in minor clones, indicating a strong pressure to acquire NOTCH1 mutations in developing T-ALL cells. By analyzing longitudinal samples, we detected the presence and clonal nature of residual leukemic cells and clones with a minor presence at diagnosis that evolved to clinically relevant major clones at later disease stages. Therefore, single-cell DNA amplicon sequencing is a sensitive assay to detect clonal architecture and evolution in T-ALL.
Introduction
T-cell acute lymphoblastic leukemia (T-ALL) is an aggressive hematologic disease that arises from the malignant transformation of T-cell progenitors.1,2 During the development of T-ALL, the leukemia cells accumulate chromosomal rearrangements and mutations. Recurrent chromosomal aberrations include the deletion of cell cycle regulators (CDKN2A, CDKN2B) and chromosomal translocations, duplications, or inversions leading to overexpression of transcription factors (TLX1/TLX3, TAL1/TAL2, HOXA, NKX2.1, MYB).3,4 Although T-ALL cases typically have only a few chromosomal rearrangements, they harbor on average 10 to 20 somatic mutations and small insertions and deletions (indels) in protein-coding genes. Recurrently mutated genes or pathways include NOTCH1, NRAS/KRAS, IL7R/JAK/STAT pathway, PI3K pathway, ribosomal genes, and chromatin modifiers.4-8 NOTCH1 mutations are found in all T-ALL subgroups, whereas IL7R/JAK/STAT pathway mutations are more common in TLX1/TLX3/HOXA subgroups, and PI3K/AKT1 pathway mutations are highly associated with TAL1 expression.9-11
NOTCH1 signaling is essential for normal T-cell development and lineage commitment.12 The NOTCH1 protein is a transmembrane receptor that, on cleavage by the γ-secretase complex, migrates to the nucleus and functions as a transcriptional regulator. NOTCH1 gain-of-function mutations can result in ligand-independent activation of NOTCH1 (HD domain mutations) or in its protection from proteasomal degradation (PEST domain mutations).13 All mutations result in increased NOTCH1 activation and consequently in enhanced proliferation and survival. Importantly, mutant NOTCH1 still requires cleavage by the γ-secretase complex to become active, and therefore the γ-secretase complex is a potential therapeutic target in T-ALL.14,15 Activated kinases such as ABL1, FLT3, JAK1/JAK3, and PI3K/AKT are another group of recurrently activated proteins in T-ALL and interesting targets for therapy.1,2
Although we have a clear view on the different mutations that are present in T-ALL, its heterogeneity at diagnosis has not been studied in detail. Genetic evidence supports a stepwise accumulation of mutations during T-ALL development, with selection for those mutations contributing to T-cell proliferation and survival and interfering with differentiation. Next-generation sequencing studies have also provided first indications that some mutations are present at low variant allele frequency (VAF) and are therefore expected to be subclonal.4 However, without single-cell data, it remains difficult to impossible to delineate the order and co-occurrence of subclonal mutations. To date, only few ALL cases have been studied at the single-cell level with various technologies, confirming heterogeneity of ALL at diagnosis, and providing first data on the order of mutational acquisition.16-18
Recently developed single-cell methodologies have enabled the isolation of hundreds to thousands of cells for single-cell RNA or DNA sequencing.19 Especially the droplet technology is of high interest, becuse this allows for the isolation and processing of thousands of single cells in very low volumes.20,21 In this study, we developed a custom library to screen for single-nucleotide variants (SNVs) and indels in 305 genomic regions, covering the regions of 110 genes that are frequently mutated in ALL. We used droplet-based microfluidics technology (Tapestri22 ; MissionBio) to genotype approximately 4400 cells per sample simultaneously, with high coverage to allow accurate SNV and indel calling. We applied this to paired T-ALL samples taken at diagnosis, during treatment, and at relapse. Our data provide a comprehensive view on the clonality of T-ALL at diagnosis in both bone marrow and blood and illustrate a surprising heterogeneity of NOTCH1 mutations within individual samples. In addition, we were able to track the fate of the diagnostic clones during treatment and detect persistent clones and the appearance of new ones.
Methods
Patients and samples
Bone marrow (BM) and peripheral blood (PB) samples obtained at diagnosis, during treatment, and at relapse were collected from children diagnosed with T-ALL at University Hospital Leuven, as approved by the local Ethical Committee. All patients were treated according to European Organisation for Research and Treatment of Cancer study protocol 58081. Written informed consent was obtained from the parents of every pediatric patient in accordance with the Declaration of Helsinki. Mononuclear cells were isolated using Ficoll-Paque and viably frozen in 95% fetal bovine serum and 5% dimethyl sulfoxide. We included 25 samples (12 BM and 13 PB mononuclear cells) from 8 male pediatric T-ALL patients in our study (supplemental Tables 1 and 2 available on the Blood Web site). Of the 8 patients, 4 were analyzed at diagnosis only, 3 were also analyzed during treatment, and 1 was also analyzed at first and second relapse (supplemental Methods).
Single-cell DNA sequencing
Single-cell amplicon-based DNA sequencing was performed using the Tapestri platform (MissionBio) and a custom amplicon panel, which assesses ALL variant hotspots across 305 genomic regions of 110 genes (supplemental Table 3; Figure 1A). Cryopreserved mononuclear cells were thawed, washed with phosphate-buffered saline, filtered with a 40-μm cell strainer, and counted with an automated cell counter. Approximately 172 000 ± 7000 (standard error of the mean) viable cells were loaded on the Tapestri platform for cell encapsulation and subsequent barcoding after the droplet workflow (chemistry V1) as described by Pellegrino et al22 and in supplemental Methods. Libraries were analyzed with a High Sensitivity DNA Kit on a Bioanalyzer (Agilent Technologies) and sequenced on a NovaSeq 6000 instrument (Illumina).

Custom ALL panel coverage and metrics of patient samples processed with the Tapestri platform for single-cell DNA sequencing. (A) The 110 genes included in the custom 305 amplicon ALL panel, which covers reported mutational hotspots (SNVs and small indels) in acute lymphoblastic leukemia. The text size is proportional to the number of amplicons per gene. The red color gradient is proportional to the number of reported mutations in previous sequencing studies that are covered by the panel amplicons of that gene. The number of reported mutations in ALL was according to the Pediatric Cancer Mutation (PeCan) and Catalogue of Somatic Mutations In Cancer (COSMIC) databases at the time of panel design. Genes with few reported mutations, 1 to 5, are denoted in gray. Details of the genomic regions covered in the custom ALL panel are in supplemental Table 3. (B) Total number of sequenced cells (i), average reads per amplicon per cell (ii), and average allele dropout rate (ADO, iii) per sample. Each point represents a sample (n = 25) from 1 of the 8 T-ALL patients. Median value is shown by a horizontal line. Detailed sample and sequencing metrics are in supplemental Table 2 and ADO details are in supplemental Table 5. (C) Bar plot with the distribution of sequencing reads across the 305 amplicons. Each bar represents an amplicon, and the height of the bar shows the average number of raw sequenced reads per cell (n = 25 samples). Amplicon name is shown for the 8 amplicons with highest coverage (left) and for the 16 lowest performing amplicons (right), which are below the minimum coverage of 10 reads (dashed red horizontal line). Amplicon coverage distribution per sample is in supplemental Table 4.
Custom ALL panel coverage and metrics of patient samples processed with the Tapestri platform for single-cell DNA sequencing. (A) The 110 genes included in the custom 305 amplicon ALL panel, which covers reported mutational hotspots (SNVs and small indels) in acute lymphoblastic leukemia. The text size is proportional to the number of amplicons per gene. The red color gradient is proportional to the number of reported mutations in previous sequencing studies that are covered by the panel amplicons of that gene. The number of reported mutations in ALL was according to the Pediatric Cancer Mutation (PeCan) and Catalogue of Somatic Mutations In Cancer (COSMIC) databases at the time of panel design. Genes with few reported mutations, 1 to 5, are denoted in gray. Details of the genomic regions covered in the custom ALL panel are in supplemental Table 3. (B) Total number of sequenced cells (i), average reads per amplicon per cell (ii), and average allele dropout rate (ADO, iii) per sample. Each point represents a sample (n = 25) from 1 of the 8 T-ALL patients. Median value is shown by a horizontal line. Detailed sample and sequencing metrics are in supplemental Table 2 and ADO details are in supplemental Table 5. (C) Bar plot with the distribution of sequencing reads across the 305 amplicons. Each bar represents an amplicon, and the height of the bar shows the average number of raw sequenced reads per cell (n = 25 samples). Amplicon name is shown for the 8 amplicons with highest coverage (left) and for the 16 lowest performing amplicons (right), which are below the minimum coverage of 10 reads (dashed red horizontal line). Amplicon coverage distribution per sample is in supplemental Table 4.
Data analysis
Sequencing data were processed using Mission Bio’s Tapestri Pipeline (Tapestri 1.8.6) for adapter trimming (Cutadapt), sequence alignment (reference genome hg19), barcode correction, cell finding, and variant calling (GATK). Please see supplemental Methods and supplemental Tables 2 and 4 for full details. Low-quality cells and variants were removed when complying any of these 6 filter parameters: genotype quality score <30, read depth <10 reads, single-cell variant allele frequency <25%, variant genotyped in <60% of the cells, cell with <50% of the genotypes present, and variant mutated in <0.5% of cells. We applied further filtering with custom R scripts to exclude noisy variants resulting from technical artifacts (supplemental Methods). The annotations of the filtered variants were curated in Integrative Genomics Viewer, and annotation errors or redundant annotations were corrected. As a result, a total of 143 variants across the 8 T-ALL patients passed all quality controls (supplemental Figure 1B). From the good quality variants, we selected nonintronic and somatic variants for downstream analysis. Germline variants were identified as specified in supplemental Methods and supplemental Figure 2.
Clonal architectures were initially determined by genotype clustering analysis including zygosity information with the Tapestri Insight software package and visualized using custom pipelines in R software. We included somatic coding (nonsynonymous) variants and cells with complete genotypes. The minimum clone size was 10 cells, and variants only present in such small clones (<10 cells) were therefore removed. The variant metrics (VAF, genotype quality, and read depth) of each clone was inspected to identify small clones that were likely the result of allele dropout (ADO; supplemental methods; supplemental Table 5). Small clones below the ADO sample rate genotyped as wild type (WT) or homozygous for a given variant but with decreased quality and read depth were considered false positives, and the cells were appointed to the closest clone (supplemental Figure 3). Because ADO can generate false-positive homozygous variant calling, we finally represented the clonal architectures without zygosity information in Figures 2B and 4.
To infer the phylogenetic trees of the somatic mutations at diagnosis we used the infSCITE (Single-Cell Inference of Tumor evolution) software,23 which performs a stochastic search to find the maximum likelihood or maximum a posteriori tree. In this model, we applied the infinite sites assumption and did not allow for re-occurrences or losses of variants. This software was run in 3 repetitions with a chain length of 100 000. Furthermore, we assumed the false-positive rate to be 0.001 and used the following parameters: -fn 0.001 -ad 0.001 0.001 -cc 0.3 (supplemental Methods). Further data analysis to count the number of cells per node in the graph was performed with a custom R script.
Lolli plot was used to visualize the NOTCH1 variants and was generated with the trackViewer package.24 Clonal evolution was visualized in fish plots generated with the Tapestri Insight software.
Results
A novel panel to detect gene mutations at single-cell level in ALL
To characterize the clonal architecture of T-ALL in primary patient samples, we performed single-cell DNA sequencing with the Tapestri platform. Tapestri provides a 2-step droplets microfluidics approach that enables the identification of genomic alterations (SNVs and small indels) across thousands of cells at single-cell resolution and in a targeted amplicon-based manner.22 For the multiplex polymerase chain reaction amplification, we designed a custom panel that targets mutational hotspots in ALL, as defined by the Catalogue of Somatic Mutations In Cancer and Pediatric Cancer Mutation25,26 databases. The panel consists of 305 amplicons with a median length of 192 bp that cover 110 genes (Figure 1A). Detailed panel coverage is shown in supplemental Table 3.
In this study, we sequenced a total of 108 188 cells from 25 samples collected from 8 male pediatric T-ALL patients at diagnosis, during treatment, and at relapse (supplemental Table 2). We obtained a median throughput of 4444 cells per sample (interquartile range [IQR]: 3786-4863) and a median sequencing coverage of 110 reads per amplicon per cell (IQR: 100X-131X; Figure 1B). However, sequencing reads were unevenly distributed, in a gene-independent manner, across the 305 amplicons (Figure 1C; supplemental Table 4). From the low performing amplicons, 16 had insufficient coverage (average read depth across 25 samples <10 reads) and were discarded from further analysis (supplemental Figure 1A). This poor amplicon performance can be caused by primers interaction, differential priming efficiencies, and extension rates or impaired genome accessibility among other factors. High GC-content amplicons (>70%) were excluded during in silico design and GC content, and amplicon length did not correlate with amplicon performance (supplemental Figure 4). Importantly, almost 95% of the panel amplicons in each sample had sufficient coverage to annotate variants (Figure 1C; supplemental Table 4). The estimated median ADO rate was 8.7% (IQR: 6.5%-9.3%; Figure 1B; supplemental Table 5).
From the variants annotated for each sample, we first removed low-quality and low-frequency variants. As a result, we detected a total of 226 different variants passing the prefiltering step across the 8 patients (supplemental Figure 1B), with a median of 68 variants per patient (IQR: 57-72). However, further filtering steps, as described in “Methods,” were required to exclude error-prone variants. For instance, we observed a high number of falsely annotated variants at the first to fifth nucleotide of the sequencing read (23%, lower pie chart in supplemental Figure 1B), highlighting the importance of trimming the reads resulting from targeted approaches. Overall, 37% of the candidate variants that passed prefiltering criteria were further excluded (supplemental Figure 1B), yielding to 20 to 29 (IQR) good-quality variants per patient (supplemental Table 6).
To further validate the custom ALL panel, we compared the single-cell mutational findings of 3 patients with their corresponding bulk whole genome sequencing (WGS) results.17 For that, we selected all somatic variants called by WGS coming from genomic regions included in the ALL panel. Among those variants, 100% (9 SNV and 2 indels) were also detected by the single-cell approach at similar VAF (supplemental Figure 5), and with a direct measurement of the percentage of mutated cells. Additionally, Tapestri was able to detect 7 subclonal variants that were previously missed by the bulk sequencing approach. This increased sensitivity of the single-cell method is essential to identify minor clones in patients with complex clonal compositions.
Single-cell DNA sequencing reveals similar leukemic clonal composition in the BM and blood
All patients presented with elevated white blood cell counts (IQR: 64 × 106-172 × 106 cells/mL) and high percentages of blasts in the BM (IQR: 77%-93%; supplemental Table 1). As a first step in our analysis, we determined to what extent the clonal heterogeneity in the blood resembles to that of the BM. To address this, we first compared the mutational profile in BM and blood from the 5 T-ALL patients for which both tissues were available (4 diagnostic cases, 1 relapse case). We found that 100% of the variants were identified both in the BM and blood and at similar frequencies (Figure 2A).
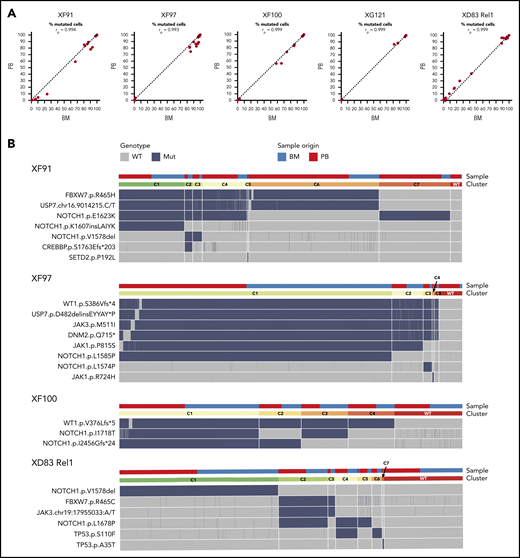
ALL has a similar mutational profile in the bone marrow and blood of the same patient. (A) Scatter plot with the percentage of mutated cells in PB vs BM per patient at diagnosis (XF91, XF97, XF100, and XG121) or at relapse (XD83). Each dot is a variant and the dashed diagonal is the perfect correlation (rp = Pearson correlation value). Included are all the filtered and curated variants per patient (supplemental Figure 1; supplemental Table 6). Of note, there are no unique variants in BM and PB, and the shift toward BM for some patients is in line with the clinically reported higher percentage of lymphoblasts in BM. (B) Clonal architecture analysis for the indicated patients and variants. Cells with complete genotype from BM and PB samples at diagnosis (XF91 = 3063 cells, XF97 = 5847 cells, and XF100 = 4665 cells) or relapse (XD83 = 3968 cells) are included. Horizontal bars on the top depict the clone (lower bar) or the sample origin (higher bar). For visual purposes, cells in the sample origin bar are sorted per clone according to their origin (PB in red and BM in blue). Remarkably, all clones have cells from both BM and PB. Heatmap shows the cell genotype without zygosity (wild type = gray, mutated = dark blue) for each selected somatic variant. Small genotype combinations (<5% of the cells) that are likely to represent false-positive clones as a result of ADO were not computed as a separate clone. For instance, cells with a wild-type genotype for 1 of the 6 mutated variants in the C1 clone of XF97 patient are caused by ADO (supplemental Figure 3 with zygosity and read depth information).
ALL has a similar mutational profile in the bone marrow and blood of the same patient. (A) Scatter plot with the percentage of mutated cells in PB vs BM per patient at diagnosis (XF91, XF97, XF100, and XG121) or at relapse (XD83). Each dot is a variant and the dashed diagonal is the perfect correlation (rp = Pearson correlation value). Included are all the filtered and curated variants per patient (supplemental Figure 1; supplemental Table 6). Of note, there are no unique variants in BM and PB, and the shift toward BM for some patients is in line with the clinically reported higher percentage of lymphoblasts in BM. (B) Clonal architecture analysis for the indicated patients and variants. Cells with complete genotype from BM and PB samples at diagnosis (XF91 = 3063 cells, XF97 = 5847 cells, and XF100 = 4665 cells) or relapse (XD83 = 3968 cells) are included. Horizontal bars on the top depict the clone (lower bar) or the sample origin (higher bar). For visual purposes, cells in the sample origin bar are sorted per clone according to their origin (PB in red and BM in blue). Remarkably, all clones have cells from both BM and PB. Heatmap shows the cell genotype without zygosity (wild type = gray, mutated = dark blue) for each selected somatic variant. Small genotype combinations (<5% of the cells) that are likely to represent false-positive clones as a result of ADO were not computed as a separate clone. For instance, cells with a wild-type genotype for 1 of the 6 mutated variants in the C1 clone of XF97 patient are caused by ADO (supplemental Figure 3 with zygosity and read depth information).
Next, we investigated the clonal architecture of these BM and blood samples in more detail. XG121 was excluded from the analysis because only 1 synonymous and 2 minor missense somatic variants were identified (supplemental Figure 1; supplemental Table 6). For the remaining 4 patients, cells were grouped into clones based on the genotype call of the selected variants. The number of clones was carefully reviewed and crossed with zygosity and quality metrics information to identify false subclones resulting from ADO (supplemental Figure 3). We were then able to identify the final number and distribution of clones per patient, with the per-clone genotype shown in Figure 2B heatmaps. By labeling the origin of the cell (BM or blood), we did not identify any BM- or blood-specific clones (Figure 2B, upper bars). Therefore, although clonal frequencies can fluctuate between both tissues, leukemia in BM and blood is largely similar. Overall, these data indicate that there is little or no differential clonal selection of the leukemia cells in blood vs BM and that molecular analysis of a blood sample is representative of the blasts in the BM.
Single-cell amplicon sequencing detects subclonal mutations in most T-ALL cases
We next analyzed the specific mutations in more detail. From all variants passing the preprocessing and filtering steps (supplemental Figure 1B), we detected a total of 89 coding somatic mutations in 37 ALL-related genes across 8 T-ALL patients (Figure 3A). Among those variants, 60 (67%) were SNVs including 50 missense, 8 synonymous, and 2 nonsense variants; 21 (24%) were small indels with either frameshift (13) or in-frame (8) protein translation implications, and 8 (9%) were associated with splicing (Figure 3B). We observed a largely patient-specific mutational profile at diagnosis with varying mutational load, ranging from only 3 variants in the XG121 patient to 15 variants in the XF100 patient (Figure 3A). The relapse samples from the XD83 patient accumulated the highest number of somatic mutations (21 and 26).
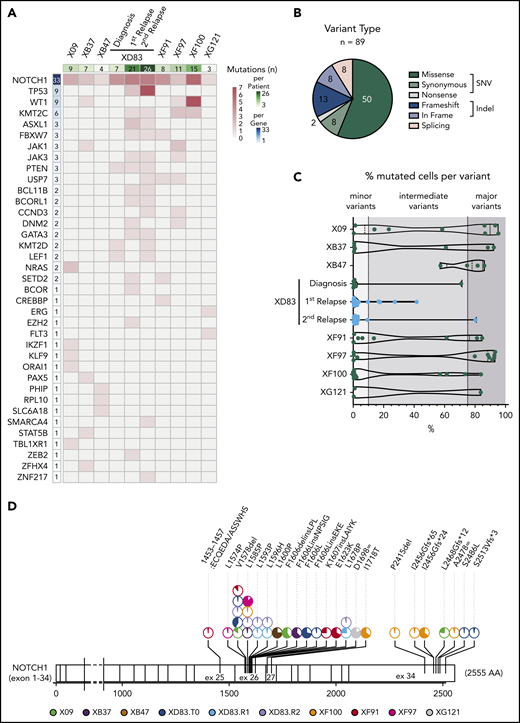
T-ALL mutational landscape based on single-cell DNA sequencing of 8 pediatric patients. (A) Heatmap with the oncoprint of patient samples at diagnosis (and relapse for XD83 patient) analyzed by single-cell DNA sequencing. Each column represents a patient, and each row represents a gene with at least 1 detected protein-coding somatic variant (89 different variants across 37 genes). The total number of mutations detected per gene is shown in the left column with a blue color gradient and the number of mutations detected per patient is shown in the upper row with a green color gradient. The heatmap red color gradient indicates the number of variants per patient and gene. (B) Pie chart with the distribution of the 89 different variants according to the protein translation implication (missense, synonymous, nonsense, frameshift, in frame, or splicing). Green denotes SNV variants, whereas blue denotes small indel variants. Splicing variants (pink) can be either SNV or indels. (C) Percentage of mutated cells per variant (dot) and patient (row) at diagnosis (and relapse for XD83 patient). The number of mutations per patient corresponds to the upper row in panel A. The variant frequency distribution for a given patient is represented with a violin plot. All variants reported are mutated in at least 0.5% of the cells from a given sample. (D) Lolli plot showing the somatic mutation spectra throughout the protein sequence of NOTCH1. The scale bar represents the length (amino acids) of the protein sequence, and the corresponding exons are indicated with vertical lines. Each lolli plot represents a NOTCH1 variant identified in this study (patient origin is indicated by color and results for the diagnostic (T0), relapse 1 (R1), and relapse 2 (R2) samples of XD83 are reported separately. The corresponding variant name is shown on the top of the lolli plot specifying the coding impact. Recurrent mutations are indicated with multiple pie charts at the same position (total count 2-5). The colored part of the pie chart corresponds to the fraction of mutated cells for that variant.
T-ALL mutational landscape based on single-cell DNA sequencing of 8 pediatric patients. (A) Heatmap with the oncoprint of patient samples at diagnosis (and relapse for XD83 patient) analyzed by single-cell DNA sequencing. Each column represents a patient, and each row represents a gene with at least 1 detected protein-coding somatic variant (89 different variants across 37 genes). The total number of mutations detected per gene is shown in the left column with a blue color gradient and the number of mutations detected per patient is shown in the upper row with a green color gradient. The heatmap red color gradient indicates the number of variants per patient and gene. (B) Pie chart with the distribution of the 89 different variants according to the protein translation implication (missense, synonymous, nonsense, frameshift, in frame, or splicing). Green denotes SNV variants, whereas blue denotes small indel variants. Splicing variants (pink) can be either SNV or indels. (C) Percentage of mutated cells per variant (dot) and patient (row) at diagnosis (and relapse for XD83 patient). The number of mutations per patient corresponds to the upper row in panel A. The variant frequency distribution for a given patient is represented with a violin plot. All variants reported are mutated in at least 0.5% of the cells from a given sample. (D) Lolli plot showing the somatic mutation spectra throughout the protein sequence of NOTCH1. The scale bar represents the length (amino acids) of the protein sequence, and the corresponding exons are indicated with vertical lines. Each lolli plot represents a NOTCH1 variant identified in this study (patient origin is indicated by color and results for the diagnostic (T0), relapse 1 (R1), and relapse 2 (R2) samples of XD83 are reported separately. The corresponding variant name is shown on the top of the lolli plot specifying the coding impact. Recurrent mutations are indicated with multiple pie charts at the same position (total count 2-5). The colored part of the pie chart corresponds to the fraction of mutated cells for that variant.
In almost all patients, we detected at least 1 somatic and nonsynonymous variant that was mutated in >75% of the cells (range, 0-7 variants per case), defining the major clone (Figure 3C; supplemental Table 6). Interestingly, we detected subclonal variants at intermediate frequencies (mutated in 10%-75% of the cells) in most cases and a substantial number of minor subclonal variants (mutated in 0.5%-10% of the cells; Figure 3C). Remarkably, 7 of the 8 T-ALL cases showed various mutations at very low frequency, indicating the common presence of minor subclones in T-ALL and the capability of this custom ALL panel for single-cell DNA sequencing to detect mutations in such small populations.
We detected 1 to 3 mutations per gene, and as expected and previously reported, NOTCH1 emerged as the most frequently mutated gene in T-ALL, with 33 variants detected across the 8 patients (Figure 3A). This was followed by TP53 (n = 9, at relapse samples only) and WT1 (n = 9 across 3 patients). All patients harbored at least 1 NOTCH1 variant, and 4 patients had more than 2 NOTCH1 variants at low-to-intermediate frequencies (Figure 3A,D). Although each patient had a different combination of NOTCH1 variants (Figure 3D), they were concentrated in expected hotspots. Variants in exons 26 and 27 (coding for the LNR-HD domains) were mostly single amino acid substitutions or in-frame indels, whereas variants in exon 34 (coding for the PEST domain) were mostly frameshift indels resulting in premature stop codons. We identified a valine deletion at position 1578 (NOTCH1.pV1578del) and a lysine-to-proline substitution (NOTCH1.pL1585P) as the most frequent variants in the cohort (Figure 3D).
Clonal architectures and mutational histories in T-ALL reveal NOTCH1 mutations as late subclonal events
Next, we investigated the co-occurrence and order of acquisition of all mutations at clonal resolution. We first determined the clonal architectures for all patients (Figures 2B and 4A). Subsequently, using the infSCITE algorithm, we inferred the most probable order of somatic events (Figure 4B). We found that the clonal architecture of T-ALL at diagnosis is typically composed by a major clone harboring 2 to 6 variants and comprising 38% to 79% of the cells and 2 to 6 minor subclones with less than 20% of the cells (Figures 2B and 4A). For instance, XF97 had a major clone (6 variants in 79% of the cells) and 4 minor clones, whereas XF91 had a more complex genetic architecture with the major clone FBXW7R465H/USP7215.C/T-splicing comprising only 38% of the cells (Figure 2B).
![Inference of mutational history from single-cell genotype data using the infSCITE algorithm. (A) Clonal architecture analysis for X09, XB37, and XB47. Only cells with complete genotype from one diagnostic sample (X09: n = 2101 cells, XB37: n = 1905 cells, and XB47: n = 1484 cells) are included. The heatmap shows the genotype consequence of each identified somatic variant in the given clone without zygosity (wild type [WT] = gray, mutated [Mut] = dark blue). The horizontal bar at the top illustrates the clonal composition. The clone name matches the name in the circles of the corresponding phylogenetic tree in panel B. Wild-type genotypes that are likely the result of ADO (supplemental Figure 3) are not computed as a separate clone. (B) Phylogenetic trees illustrating the maximum likelihood order at which mutations were acquired during T-ALL development in the indicated patients. The mutational history was reconstructed with the genotype data from the samples at diagnosis (PB for X09, BM for XB37 and XB47; BM and PB for XF91, XF97, and XF100). Arrows are labeled with the mutations acquired and illustrate branching or linear patterns of clonal evolution, with dotted arrows indicating less probable paths. Circles represent the clones (clone names are matched with those in Figure 2B or 4A) and the size of the circle denotes the relative clone size in the samples (frequency indicated next to the circles).](https://ash.silverchair-cdn.com/ash/content_public/journal/blood/137/6/10.1182_blood.2020006996/3/m_bloodbld2020006996f4.png?Expires=1769085088&Signature=4ZB0It6sRwCrSgxP5KQRmjPQaBdxdByeO-ZkSO~xK1vA9YpoEhsoucG8rgyncEyZ0z~c2RvKl1dz5CpBvYFsHkPgfVAkUqEuVdP0ieZBYpcuBRaxLOL0olSpvmex9~n6ion4vrTAruA0c4RppoQap53QbgIV5KmB6LlSzUU2qfzIBKs20YVq~TZAT8AEJWHNonEt8tib~imdVcmGp6N7Hv8iQ2CRO2cbzcDl6oZznUbrMp1qRyBsBJhwyaM-Lv~itHNWMgYudMFD-0RZ3TdDOXnCBnYkehaE2JP~SXpW37zgXEXaSBf68IQwwPuHeeI-CahmhRHBwTIQoVIDWUVQmg__&Key-Pair-Id=APKAIE5G5CRDK6RD3PGA)
Inference of mutational history from single-cell genotype data using the infSCITE algorithm. (A) Clonal architecture analysis for X09, XB37, and XB47. Only cells with complete genotype from one diagnostic sample (X09: n = 2101 cells, XB37: n = 1905 cells, and XB47: n = 1484 cells) are included. The heatmap shows the genotype consequence of each identified somatic variant in the given clone without zygosity (wild type [WT] = gray, mutated [Mut] = dark blue). The horizontal bar at the top illustrates the clonal composition. The clone name matches the name in the circles of the corresponding phylogenetic tree in panel B. Wild-type genotypes that are likely the result of ADO (supplemental Figure 3) are not computed as a separate clone. (B) Phylogenetic trees illustrating the maximum likelihood order at which mutations were acquired during T-ALL development in the indicated patients. The mutational history was reconstructed with the genotype data from the samples at diagnosis (PB for X09, BM for XB37 and XB47; BM and PB for XF91, XF97, and XF100). Arrows are labeled with the mutations acquired and illustrate branching or linear patterns of clonal evolution, with dotted arrows indicating less probable paths. Circles represent the clones (clone names are matched with those in Figure 2B or 4A) and the size of the circle denotes the relative clone size in the samples (frequency indicated next to the circles).
Inference of mutational history from single-cell genotype data using the infSCITE algorithm. (A) Clonal architecture analysis for X09, XB37, and XB47. Only cells with complete genotype from one diagnostic sample (X09: n = 2101 cells, XB37: n = 1905 cells, and XB47: n = 1484 cells) are included. The heatmap shows the genotype consequence of each identified somatic variant in the given clone without zygosity (wild type [WT] = gray, mutated [Mut] = dark blue). The horizontal bar at the top illustrates the clonal composition. The clone name matches the name in the circles of the corresponding phylogenetic tree in panel B. Wild-type genotypes that are likely the result of ADO (supplemental Figure 3) are not computed as a separate clone. (B) Phylogenetic trees illustrating the maximum likelihood order at which mutations were acquired during T-ALL development in the indicated patients. The mutational history was reconstructed with the genotype data from the samples at diagnosis (PB for X09, BM for XB37 and XB47; BM and PB for XF91, XF97, and XF100). Arrows are labeled with the mutations acquired and illustrate branching or linear patterns of clonal evolution, with dotted arrows indicating less probable paths. Circles represent the clones (clone names are matched with those in Figure 2B or 4A) and the size of the circle denotes the relative clone size in the samples (frequency indicated next to the circles).
We observed co-occurring mutations of the JAK-STAT signaling pathway in the same clone; for example, JAK3M511l/DNM2Q715/JAK1P815S mutations in XF97 and STAT5BN6242H/JAK1E730K mutations in XB37 (Figure 4). Multiple hits in the same signaling pathway within the same leukemia clone suggests an additive effect of such mutations of the JAK-STAT pathway, as previously reported.8,27 In contrast, we also identified mutations that occurred in the same gene that were mutually exclusive, for example, JAK1P8015S and JAK1R724H in different clones of XF97 (Figure 4). Most of the patients carried multiple NOTCH1 mutations that were present in different clones (eg, X09, XF91, XF97, XF100) or were accumulating within the same cells (eg, NOTCH1I1718T/NOTCH1I2456del in XF100; Figures 2B and 4).
Inferred mutational histories revealed stepwise (XB47 or XF100) and branching patterns of clonal evolution (X09 or XF91). Besides initial founder genomic lesions, additional mutations are necessary to drive transformation and leukemia progression. Frameshift mutations in the WT1 gene (S386Vfs.4* in XF97 and V376Cfs.14* in XF100; Figure 4B) were identified as the most common early and driving event, whereas NOTCH1 variants emerged as subclonal and late events (Figure 4B).
Clonal evolution during treatment and at relapse
Treatment of pediatric T-ALL consists of intensive combination chemotherapy regimens over 2 years. All patients in this study were treated according to the European Organisation for Research and Treatment of Cancer 58081 protocol, which starts with 1 week of pretreatment with glucocorticoids (prednisone), followed by a 4-week induction phase with intensive intravenous and intrathecal chemotherapy. To study the clonal evolution in response to treatment, we collected and analyzed longitudinal samples during the glucocorticoids phase (PB T1), after the first dose of chemotherapy (PB T2), and at the end of the induction phase (clinical assessment of minimal residual disease [MRD], BM and PB samples). Three T-ALL cases were analyzed at multiple time points during treatment.
The XF97 patient achieved a complete clinical remission, and consistently, none of the somatic mutations detected at diagnosis could be identified at MRD in the bone marrow (day 35 of treatment) by single-cell DNA sequencing (Figure 5A). However, patient XF100 showed a poor response to prednisone, and at T1 leukemia burden, only decreased by half and all identified clones persisted (Figure 5B). Between T1 and T2, because of the start of chemotherapy, there was a gradual but rapid eradication of leukemia cells, achieving cytological complete remission after 5 weeks (MRD; Figure 5B). However, molecular complete remission was not reached as detected by the persistence of TLX3 positivity using reverse transcription quantitative polymerase chain reaction as part of the molecular follow-up of this patient. Our single-cell approach could detect this molecular failure with high sensitivity by mutational analysis that allowed us to dissect the clonal background of the persistent leukemic cells. Although the major C1 clone was no longer identified after the induction phase, single-cell DNA sequencing detected residual leukemic cells of the C2 (WT1V376Cfs*/NOTCH1l2456del) and C4 (WT1V376Cfs*) subclones. Therefore, Tapestri has the potential to detect the presence and clonal nature of residual leukemic cells that could be missed in routine clinical assessment, which depends on the marker used for follow-up. This is particularly valuable for patients who lack a molecular marker at diagnosis.
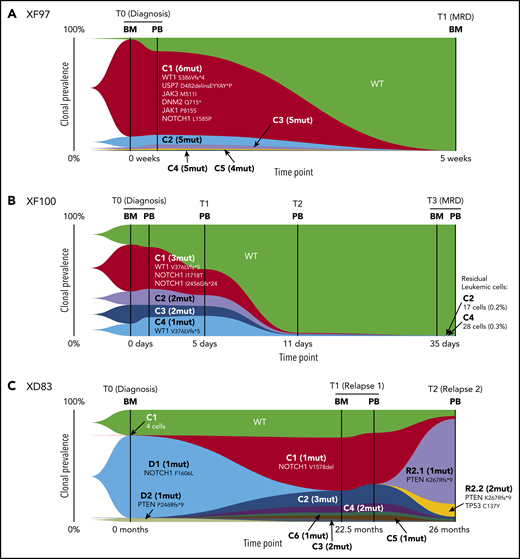
Clonal evolution of T-ALL during chemotherapy and at relapse. (A-C) The fish plot shows the clonal evolution in 3 T-ALL patients carrying multiple somatic mutations. Each color represents a clone, and the clone name (C1-Cn) matches the clones of Figure 2B. The number of mutations per clone is specified between brackets, and the set of mutations is shown for the major C1 clone and for clones with 1 mutation. For the genotype of all clones, please refer to Figure 2B. (A) Clonal evolution of XF97 patient from diagnosis (BM and PB) until MRD time point (5 weeks after diagnosis) showing a complete remission. (B) Clonal evolution of XF100 patient. Longitudinal single-cell analysis of 6 samples collected at 4 time points. The patient showed resistance to prednisone (high leukemia burden at T1) and showed residual leukemic cells at MRD time point (day 35 of treatment, end of the induction phase). (C) Clonal evolution of patient XD83 from diagnosis to relapse. XD83 showed distinct clonal compositions at diagnosis (BM), first relapse (BM and PB, 22.5 months after diagnosis), and second relapse (3.5 months after the first relapse). D1 and D2 nomenclature denote clones present at diagnosis whereas R2.1 and R2.2 are clones present at relapse 2.
Clonal evolution of T-ALL during chemotherapy and at relapse. (A-C) The fish plot shows the clonal evolution in 3 T-ALL patients carrying multiple somatic mutations. Each color represents a clone, and the clone name (C1-Cn) matches the clones of Figure 2B. The number of mutations per clone is specified between brackets, and the set of mutations is shown for the major C1 clone and for clones with 1 mutation. For the genotype of all clones, please refer to Figure 2B. (A) Clonal evolution of XF97 patient from diagnosis (BM and PB) until MRD time point (5 weeks after diagnosis) showing a complete remission. (B) Clonal evolution of XF100 patient. Longitudinal single-cell analysis of 6 samples collected at 4 time points. The patient showed resistance to prednisone (high leukemia burden at T1) and showed residual leukemic cells at MRD time point (day 35 of treatment, end of the induction phase). (C) Clonal evolution of patient XD83 from diagnosis to relapse. XD83 showed distinct clonal compositions at diagnosis (BM), first relapse (BM and PB, 22.5 months after diagnosis), and second relapse (3.5 months after the first relapse). D1 and D2 nomenclature denote clones present at diagnosis whereas R2.1 and R2.2 are clones present at relapse 2.
Finally, we analyzed samples from a patient that experienced a first relapse (T1) during maintenance treatment, 22.5 months after the original diagnosis of T-ALL, and had a second relapse (T2) 3 months later. This case showed that, although D1 (NOTCH1F1606L) and D2 (PTENP246Rfs*) clones responded to therapy, the C1 (NOTCH1V1578del) minor clone that originally only constituted 0.2% of the diagnostic sample became the major clone at relapse 1, both in BM and PB, with almost 50% of the cells harboring this mutation (Figure 5C). The mechanism of relapse in this patient can only be partially explained by clonal selection because previously undetected clones emerged, harboring mutations in FBXW7, JAK3, and TP53 genes (C2-C7 clones in Figures 2B and 5C). After reinduction, the bone marrow was cleared of leukemic cells (BM morphology complete remission, MRD <1× 10⁻⁴). However, consolidation treatment was delayed for 5 weeks because of severe infection, and before consolidation started, he developed a central nervous system and BM relapse. A few days after termination of consolidation, blasts reappeared in PB, and no response was achieved with Nelarabine salvage treatment. This final relapse was mainly driven by a loss-of-function PTENK267Rfs*9 mutation (alone in 74% of the cells or co-occurring with TP53 mutation, Figure 5C), which was different to the PTEN minor clone at diagnosis. Overall, these data exemplify distinct clonal architectures at diagnosis and relapse and the feasibility of the technology to detect very rare but clinically relevant subclones at diagnosis.
Discussion
Single-cell sequencing technologies have evolved rapidly over the last few years. Droplet technology now enables the accurate analysis of thousands of cells in heterogeneous mixtures. Although most attention has gone to single-cell RNA sequencing to map transcriptional profiles to individual cells in complex mixtures, single-cell DNA sequencing is also emerging to map mutational data to individual cells.22,28,29 In this study, we used the Tapestri technology to dissect T-ALL heterogeneity at diagnosis and clonal evolution during chemotherapy treatment. Tapestri is amplicon based, and we designed a panel to interrogate 305 genomic regions that are frequently mutated in ALL. We benchmarked this technology to WGS and found that mutations identified by bulk genome sequencing were also detected by Tapestri, illustrating the robustness of this technology. Moreover, using this single-cell sequencing approach, we detected additional mutations in minor subclones that remained undetected by WGS. Such minor subclones were identified in most T-ALL cases at diagnosis and indicate the pressure of the leukemia cells to further evolve and mutate during progression to the acute disease phase.
We found a surprisingly high heterogeneity of NOTCH1 mutations at diagnosis in T-ALL. Indeed, NOTCH1 mutations are frequent in T-ALL, and it has been reported that 2 NOTCH1 mutations (1 in the HD domain and 1 in the PEST domain) can be present in a sample.13 Through single-cell sequencing, we observed that half of the T-ALL cases harbored >2 NOTCH1 mutations. We found that 1 or 2 NOTCH1 mutations were typically present in the major leukemia clone and the additional NOTCH1 mutations in minor subclones. NOTCH1 mutations were often acquired at later stages, after disease initiating mutations had accumulated. This conclusion is in line with previous studies.4,17,30 The observation that multiple cells acquire independent NOTCH1 mutations is remarkable and highlights the importance of these mutations in T-ALL progression. Similar findings were made for NRAS and JAK1 mutations, where such parallel evolution occurred as well, likely reflecting the importance of activating these pathways in the mutational context of those cases.
Single-cell analysis can also be very useful to evaluate the response to therapy and the development of relapse. T-ALL cases are often sensitive to corticosteroids, and we also observed this by a dramatic decrease of the mutated cells during the first week of treatment. One case, however, presented a suboptimal response to corticosteroids, which was evidenced by a partial reduction of the mutant cells. Single-cell analysis for this patient revealed a variable clonal response to the treatment, with the clone carrying most mutations showing the greatest reduction. Moreover, we show the feasibility to detect residual cells of particular subclones during treatment and demonstrate that this technology enables the early detection of preexisting relapse clones. The prognostic role of PTEN alterations remains controversial in T-ALL,31,32 and single-cell analysis may provide new insights into this question. Together, these data illustrate the potential of single-cell DNA analysis for the longitudinal follow-up of T-ALL. Similar studies with more patients, more cells, and integration of other omics will contribute to the identification of predictive biomarkers informing treatment decisions and to the development of treatment strategies targeting clonal diversity.
The single-cell DNA-seq data (fastQ and vcf files) have been deposited in the EGA database (https://ega-archive.org) under accession number EGAS00001004440.
The online version of this article contains a data supplement.
The publication costs of this article were defrayed in part by page charge payment. Therefore, and solely to indicate this fact, this article is hereby marked “advertisement” in accordance with 18 USC section 1734.
Acknowledgments
The authors thank Mission Bio for early access to Tapestri and for help with data analysis.
This project was funded by grants from Kom op tegen Kanker (Stand up to Cancer), the Flemish Cancer Society, VIB Technology Watch Fund (J.C.), the KU Leuven (C14/18/104; J.C., K.D.K., J.M., N.B., H.S.), Fonds Wetenschappelijk Onderzoek and European Marie Sklodowska-Curie Actions fellowships to L.A.-S., and Foundation Against Cancer fellowship to S.D. This study was supported by the VIB Nucleomics Core and the VIB Technology Innovation Laboratory.
Authorship
Contribution: L.A.-S. designed the study, performed experiments, analyzed experimental and bioinformatics data, and wrote the manuscript; S.D. performed computational data analysis; I.G. and T.S. performed experiments and analyzed data; O.G. and M.B. performed experiments; K.D.K. analyzed data; J.D.B., L.M., J.M., A.U., N.B., and H.S. provided samples and analyzed clinical and genetic data; and J.C. designed and supervised the study, analyzed data, and wrote the manuscript.
Conflict-of-interest disclosure: The authors declare no competing financial interests.
Correspondence: Jan Cools, Center for Human Genetics, Herestraat 49 (Box 912), 3000 Leuven, Belgium; e-mail: jan.cools@kuleuven.be; and Heidi Segers, Pediatric Oncology, Herestraat 49 (Box 400), 3000 Leuven, Belgium; e-mail: heidi.segers@uzleuven.be.

This feature is available to Subscribers Only
Sign In or Create an Account Close Modal