

Key Points
Functional genomics screening shows that MALT1 sits at crossroads between multiple oncogenic signaling pathways, including PI3K and MTORC1.
Simultaneous MALT1/MTORC1 inhibition abrogates survival feedback activation of MTORC1 and triggers synergistic killing of ABC-DLBCL.

Abstract
MALT1 inhibitors are promising therapeutic agents for B-cell lymphomas that are dependent on constitutive or aberrant signaling pathways. However, a potential limitation for signal transduction–targeted therapies is the occurrence of feedback mechanisms that enable escape from the full impact of such drugs. Here, we used a functional genomics screen in activated B-cell–like (ABC) diffuse large B-cell lymphoma (DLBCL) cells treated with a small molecule irreversible inhibitor of MALT1 to identify genes that might confer resistance or enhance the activity of MALT1 inhibition (MALT1i). We find that loss of B-cell receptor (BCR)- and phosphatidylinositol 3-kinase (PI3K)-activating proteins enhanced sensitivity, whereas loss of negative regulators of these pathways (eg, TRAF2, TNFAIP3) promoted resistance. These findings were validated by knockdown of individual genes and a combinatorial drug screen focused on BCR and PI3K pathway–targeting drugs. Among these, the most potent combinatorial effect was observed with PI3Kδ inhibitors against ABC-DLBCLs in vitro and in vivo, but that led to an adaptive increase in phosphorylated S6 and eventual disease progression. Along these lines, MALT1i promoted increased MTORC1 activity and phosphorylation of S6K1-T389 and S6-S235/6, an effect that was only partially blocked by PI3Kδ inhibition in vitro and in vivo. In contrast, simultaneous inhibition of MALT1 and MTORC1 prevented S6 phosphorylation, yielded potent activity against DLBCL cell lines and primary patient specimens, and resulted in more profound tumor regression and significantly improved survival of ABC-DLBCLs in vivo compared with PI3K inhibitors. These findings provide a basis for maximal therapeutic impact of MALT1 inhibitors in the clinic, by disrupting feedback mechanisms that might otherwise limit their efficacy.
Introduction
Constitutive activation of the B-cell receptor (BCR), phosphatidylinositol 3-kinase (PI3K), and Toll-like receptor (TLR) pathways is a hallmark of activated B-cell–like (ABC) diffuse large B-cell lymphoma (DLBCL).1 Activation of these pathways is attributed to mutations in their components (most frequently CD79A/B, CARD11, TNFAIP3, and MYD88) and leads to chronic activation of NF-κB signaling, proliferation, and survival.2-5 Within this context, the CBM (CARD11-BCL10-MALT1) complex acts as a supramolecular organizing center to set the activation threshold and amplify BCR signaling to the IKK complex and NF-κB.6,7 Moreover, the CBM complex colocalizes with TLR pathway components and MTOR in ABC-DLBCL cells,8 forming a My-T-BCR supercomplex that integrates signaling from these pathways.
BCR signaling leads to CARD11 phosphorylation and BCL10 recruitment, which forms filaments supporting MALT1 binding and activation. MALT1 recruits TRAF6 and TAK1 that ultimately activate IKK and NF-κB. MALT1 is also a protease and modulates NF-κB and AP-1 activation through cleavage of TNFAIP3 and other substrates.9 Most importantly, ABC-DLBCLs are critically dependent on MALT1 protease activity for proliferation and survival.10-12
These considerations led to the development of MALT1 inhibitors. The first MALT1 protease inhibitor was MI-2, a covalent active site inhibitor, with activity against ABC-DLBCL in vitro and in vivo11 and other lymphomas.13-15 C3, a cell-permeable irreversible peptidomimetic inhibitor,16 displayed greater potency against MALT1-dependent ABC-DLBCL lines and primary specimens.17 Instead, phenothiazines are allosteric reversible inhibitors of MALT1 that also suppress growth of ABC-DLBCLs in vivo.18 Other allosteric compounds have been described,19-21 but their anti–ABC-DLBCL activity in vivo has not been reported.
Taken together, MALT1 inhibition (MALT1i) has emerged as a promising therapeutic approach against lymphomas that are dependent on chronic BCR and TLR signaling, including ABC-DLBCL, chronic lymphocytic lymphoma (CLL),22 and mantle cell lymphoma (MCL).23 MALT1 is downstream of the most frequently mutated genes in these pathways, including BTK, PLCγ, or CARD11, that confer resistance to BTK inhibition. Accordingly, MALT1 inhibitors are active in ibrutinib-resistant BTK-mutant CLLs,22 and CARD11-mutant ABC-DLBCLs are hypersensitive to MALT1i.17 Nonetheless, most tumors engage feedback mechanisms limiting single-agent activity of signal transduction inhibitors. The intrinsic complexity and high degree of coordination of the BCR-PI3K-TLR superpathway suggest that combinatorial therapy will be needed to effectively kill these lymphomas. Herein, we used functional genomics to map the MALT1i resistance/sensitivity landscape in ABC-DLBCL to identify putative feedback mechanisms and design highly active MALT1 inhibitor combinatorial therapies.
Materials and methods
Short hairpin RNA library screen
Procedures followed Cellecta’s shRNA Libraries user manual. DECIPHER Lentiviral shRNA Library, Human Module 1 (Addgene; cat. no. 28286) was a gift from Alex Chenchik and Gus Frangou. Cells were treated as indicated, genomic DNA was extracted, and short hairpin RNA (shRNA) barcodes were amplified using polymerase chain reaction and sequenced. Cellecta’s Deconvoluter software was used to annotate and count reads for each hairpin. Results were analyzed using the RNAi Gene Enrichment Ranking (RIGER) algorithm.24
Growth inhibition assay and synergy calculations
Cell proliferation was determined using CellTiter-Glo (Promega). Cell viability was normalized to vehicle (fractional viability). Combination Index-50 was calculated using CompuSyn software (Biosoft, Cambridge, UK). In another set of experiments, cell proliferation was determined by flow cytometry as the percentage of DAPI− cells, and Zero Interaction Potency (ZIP) synergy δ-scores of dose-response matrix data were calculated25 (https://synergyfinder.fimm.fi).
Mouse xenograft experiments
All procedures involving animals were approved by the Institutional Animal Care and Use Committee at Weill Cornell Medicine. Eight- to 10-week-old NOD.CB17-Prkdcscid female mice were injected subcutaneously with 107 low-passage TMD8 cells suspended in phosphate-buffered saline/Matrigel. Treatments were given as indicated, and tumor volumes were calculated as (smallest diameter)2 × largest diameter × 0.5.
Three-dimensional organoid cell culture
Established patient-derived tumor xenograft (PDTX) samples were subcutaneously implanted into NSG mice and allowed to grow to 1500 mm3. Cells were collected and grown in 3-dimensional (3D) organoids containing 3% silicate nanoparticles and 5% gelatin-Iscove modified Dulbecco medium.26 3D organoids were exposed to a matrix of serial dilutions of drugs in triplicate for 6 days. Cells were treated every 3 days and cell count and viability were assessed by flow cytometry at the end of the experiment. For imaging, optically clear organoids of bioadhesive polyethylene glycol hydrogels were used.27
Statistical analysis
All statistical analyses were performed with Prism8 software.
Additional details can be found in supplemental Methods (available on the Blood Web site).
Results
Identification of genes that enhance or impair MALT1 inhibitor effect in ABC-DLBCL cells
To identify genes modulating MALT1i response, we conducted a functional genomics screen in a MALT1i-sensitive cell line (HBL-1) treated with MI-2.11 We used an shRNA library harboring 27 500 shRNAs targeting 5043 genes involved in signal transduction to uncover feedback mechanisms affecting MALT1i effects. Following shRNA library infection and selection, HBL-1 cells were cultured with dimethyl sulfoxide (DMSO) or 300 nM MI-2 for 20 days or collected as Input (Figure 1A). At 20 days, MI-2–treated cells were 96% viable and were considered resistant to MALT1i (supplemental Figure 1A). Average hairpin representation of Input samples was >900-fold per experiment (supplemental Figure 1B). Log2 normalized read counts showed a high correlation between experiments (Figure 1B). We used the RIGER algorithm to evaluate gene enrichment due to MALT1i.24 First, to assess assay performance, we evaluated enrichment of “Essential genes”8 (supplemental Table 1). Essential genes were significantly depleted in DMSO-treated cells vs Input (normalized enrichment score [NES], −3.03; false discovery rate [FDR], 1e-04) (Figure 1C) but not in MI-2–treated cells vs DMSO-treated cells (NES, 1.19; FDR, 0.137) (Figure 1D).
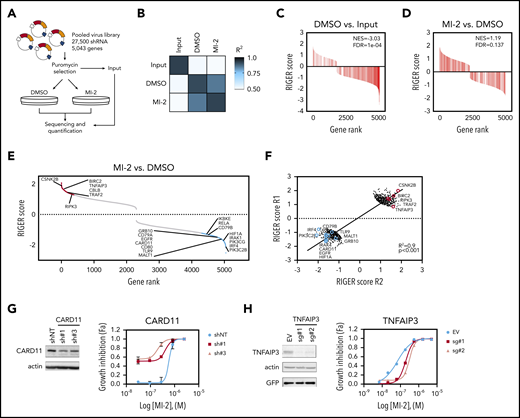
Loss-of-function MALT1i screen identifies modulators of MALT1i response in ABC-DLBCL. (A) Scheme of screen experimental design. (B) Correlation matrix of normalized shRNA read counts for 2 independent replicate experiments. Gene-set enrichment analysis of a list of “pan-essential genes” in Control vs Input (C) and MI-2–treated vs DMSO-treated cells (D). (E) Plot of gene enrichment MI-2–treated vs DMSO-treated cells ranked by RIGER score. Genes for relevant enriched functional networks are shown. (F) Correlation plot of gene RIGER scores in MI-2–treated cells vs DMSO-treated cells in 2 independent screen replicates. Plotted 500 top and bottom ranked genes (average of 2 replicates). Validation of screen targets using shRNAs against CARD11 (G) or single guide (sg) RNA against TNFAIP3 (H). The effect of gene knockdown on IC50 of MI-2 was assessed by cell count by flow cytometry of live GFP+ cells. Gene knockdown was evaluated by western blot. EV, empty vector; shNT, nontargeting shRNA.
Loss-of-function MALT1i screen identifies modulators of MALT1i response in ABC-DLBCL. (A) Scheme of screen experimental design. (B) Correlation matrix of normalized shRNA read counts for 2 independent replicate experiments. Gene-set enrichment analysis of a list of “pan-essential genes” in Control vs Input (C) and MI-2–treated vs DMSO-treated cells (D). (E) Plot of gene enrichment MI-2–treated vs DMSO-treated cells ranked by RIGER score. Genes for relevant enriched functional networks are shown. (F) Correlation plot of gene RIGER scores in MI-2–treated cells vs DMSO-treated cells in 2 independent screen replicates. Plotted 500 top and bottom ranked genes (average of 2 replicates). Validation of screen targets using shRNAs against CARD11 (G) or single guide (sg) RNA against TNFAIP3 (H). The effect of gene knockdown on IC50 of MI-2 was assessed by cell count by flow cytometry of live GFP+ cells. Gene knockdown was evaluated by western blot. EV, empty vector; shNT, nontargeting shRNA.
We next characterized the differential enrichment and depletion of genes in MI-2–treated vs DMSO-treated samples. We found 373 shRNAs that increased sensitivity to MI-2 and 721 shRNAs that decreased sensitivity to MI-2 (cutoff P value = .1) (Figure 1E; supplemental Table 2). There was a strong correlation among differentially enriched or depleted genes (R2 = .9; Figure 1F). Among others, we observed selective depletion of shRNAs against BCR activators, including CD79A and CD79B, CARD11, MALT1, RELA, and IRF4, TLR activators TLR9 and IRAK1, and PI3K activators, such as PIK3CG and PIK3C2B, in MI-2–resistant cells (Figure 1E). Reciprocally, there was enrichment of shRNAs against negative regulators of BCR and NF-κB signaling (including BIRC2, CBLB, TNFAIP3, TNIP, and TRAF2; Figure 1E). This was confirmed in independent validation experiments, showing, for example, that loss of CARD11 and CD79B cooperated with MI-2 in killing HBL-1 cells (Figure 1G; supplemental Figure 1C-D). CARD11 knockdown reduced the 50% inhibitory concentration (IC50) of MI-2 by 1.4- to 2.9-fold (Figure 1G), consistent with a synthetic lethal effect whereby reducing overall CBM complex activity enhances the effects of MALT1 inhibitors. Although BTK scored low in our screen (RIGER score, 0.51-1.11), because synergy between BTK and MALT1i was reported previously,28 we evaluated BTK knockdown in combination with MI-2, which significantly improved the killing effect of MI-2 (supplemental Figure 1E). Conversely, loss of TNFAIP3 enhanced HBL-1 cell growth and favored MI-2 resistance in HBL-1 cells, increasing IC50 of MI-2 by fourfold to sevenfold (supplemental Figure 1H).
MALT1i is modulated through specific pathways in ABC-DLBCL cells
Genes whose knockdown decreased sensitivity to MI-2 (n = 80; MI-2 vs DMSO: RIGER-score > 1.2 and P < .1 in both replicates) were used to identify pathways enriched in MI-2–resistant cells using STRING29 (Figure 2A; supplemental Figure 2A; supplemental Table 3). Among these, “NF-κB signaling pathway” (P = 4.90e-04) was the most enriched and encompassed negative regulators of noncanonical NF-κB signaling. We also observed significant enrichment for “Metabolic pathways” (P = 4.90e-04), “Citrate cycle” (TCA cycle; DLST, FH, OGDH) (P = .0156), and “Amino sugar and nucleotide sugar” metabolism (GMDS, MPI, PGM1) (P = .0323), suggesting that metabolic adaptation is essential to ABC-DLBCL survival upon MALT1i. Indeed, MALT1 has been implicated in glutamine metabolism and redox homeostasis in lymphocytes.30
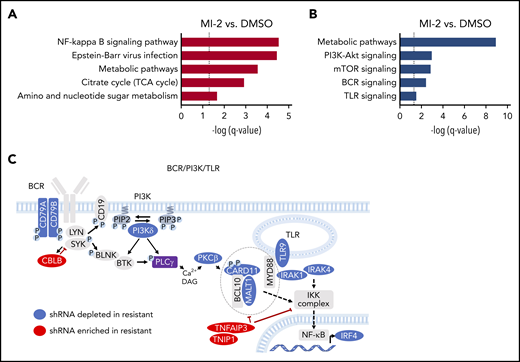
BCR-PI3K-TLR is a major determinant of sensitivity/resistance to MALT1 inhibitors. (A) Graph representing significantly enriched Kyoto Encyclopedia of Genes and Genomes pathways among genes whose knockdown decreased (A) and increased (B) sensitivity to MI-2 using STRING. (C) Graph picturing modulators of response to MALT1i significantly enriched in MI-2 shRNA combinatorial screen. Depleted (blue) or enriched (red) shRNAs in MI-2 vs. DMSO-treated cells and their relative position in the BCR/PI3K/TLR pathway network.
BCR-PI3K-TLR is a major determinant of sensitivity/resistance to MALT1 inhibitors. (A) Graph representing significantly enriched Kyoto Encyclopedia of Genes and Genomes pathways among genes whose knockdown decreased (A) and increased (B) sensitivity to MI-2 using STRING. (C) Graph picturing modulators of response to MALT1i significantly enriched in MI-2 shRNA combinatorial screen. Depleted (blue) or enriched (red) shRNAs in MI-2 vs. DMSO-treated cells and their relative position in the BCR/PI3K/TLR pathway network.
Reciprocally, genes whose knockdown increased sensitivity to MI-2 (n = 328; RIGER score < −1.0 and P < .15) were used to explore MALT1i sensitizers (Figure 2B; supplemental Figure 2B; supplemental Table 4). “Metabolic pathways” (including “Amino acid biosynthesis,” “Purine metabolism,” and “Glycolysis”; P = 1.19e-09) were depleted from MI-2–resistant cells, pointing to the dependency of ABC-DLBCL on anabolic pathways and high glucose usage. Loss of proteins in the “PI3K-Akt signaling pathway” (ANGPT2, EGFR, MAP2K2, MAPK3) (P = 1.10e-03), the “MTOR signaling pathway” (EIF4B, EIF4E2, GRB10 or LAMTOR5) (P = 1.40e-03), the “B-cell receptor signaling pathway” (CARD11, MALT1, NFATC1, SYK) (P = 3.70e-03), and the “Toll-like receptor signaling pathway” (TLR9, IKBKE, IRAK4, MAP2K2) (P = 3.00e-02) also sensitized cells to MALT1i.
Collectively these analyses emphasized MALT1’s role as an integrator of the BCR and TLR pathways, which are critical in ABC-DLBCL. In fact, MALT1 colocalizes with MYD88 and MTOR in the lysosomal My-T-BCR supercomplex.8 Accordingly, depletion of key activators of the BCR, PI3K/MTOR, and TLR pathways sensitized cells to MALT1i, whereas loss of negative regulators of these pathways was associated with resistance (Figure 2C).
MALT1/PI3K-inhibition combinations are particularly synergistic against ABC-DLBCL cell lines
Our functional genomics screen pointed to BCR, PI3K, and TLR signaling mediators as putative MALT1i-sensitizing genes that are amenable to pharmacologic targeting. Thus, we designed a MALT1i combinatorial screen against signaling hubs in these pathways, prioritizing drugs that are approved by the US Food and Drug Administration or that are in clinical trials for cancer. We included the following PI3K inhibitors: BKM120 (buparlisib, panPI3K), GDC-0941 (pictilisib, PI3Kα/δ), BYL719 (alpelisib, PI3Kα), and CAL-101 (idelalisib, PI3Kδ). We also targeted SYK, BTK, PKC, MEK, IRAK4, and AKT.
Compounds were administered to 4 MALT1i-sensitive ABC-DLBCL lines: TMD8, HBL-1, OCI-Ly10 (CD79A/B mutant and CARD11WT), and OCI-Ly3 (CD79A/BWT and CARD11 mutant). All 4 cell lines harbor MYD88L265P mutation. Each drug was studied first individually in dose-response experiments. BCR-targeted inhibitors against SYK (PRT062070), PKC (sotrastaurin), and BTK (ibrutinib) were highly active in all cells with the exception of CARD11-mutant OCI-Ly3 cells (Figure 3A). Similarly, all cell lines with the exception of OCI-Ly3 cells were highly sensitive to PI3K inhibition (PI3Ki) (Figure 3A). In contrast, all cell lines were resistant to AKT inhibition by MK-2206 at up to 1 μM, as well as MEK inhibition by selumetinib, confirming previously reported data.31 All cells with the exception of the HBL-1 line were sensitive to IRAK4 inhibitor Compound 26.32
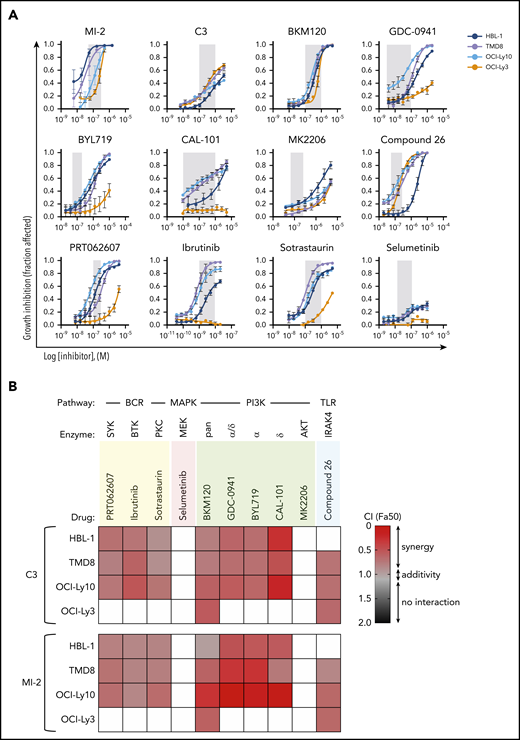
MALT1i is highly synergistic with PI3K inhibition in ABC-DLBCL. (A) Dose response for individual drugs against signaling hubs in the BCR, PI3K, and TLR pathways in 4 ABC-DLBCL lines. Gray shaded area represents on-target dose. (B) Heat map of CIs at fraction affected 50% (Fa50) for the indicated drugs in combination with C3 or MI-2 in 4 ABC-DLBCL cell lines. For white boxes, CI50 (combination index) was not calculated because GI50 (growth inhibition) was not reached.
MALT1i is highly synergistic with PI3K inhibition in ABC-DLBCL. (A) Dose response for individual drugs against signaling hubs in the BCR, PI3K, and TLR pathways in 4 ABC-DLBCL lines. Gray shaded area represents on-target dose. (B) Heat map of CIs at fraction affected 50% (Fa50) for the indicated drugs in combination with C3 or MI-2 in 4 ABC-DLBCL cell lines. For white boxes, CI50 (combination index) was not calculated because GI50 (growth inhibition) was not reached.
Next, combinations of these drugs with 2 structurally unrelated irreversible MALT1 inhibitors, MI-2 and C3,17 were studied at fixed ratios, and their combination indexes (CIs) were calculated using the Chou-Talalay method.33 SYKi, PKCi, and BTKi combinations with MALT1i were mostly additive in CARD11WT cell lines (CI range, 0.52-0.94) (Figure 3B). In contrast, PI3K inhibitors were mostly synergistic for these cell lines, particularly in the case of the PI3Kδ inhibitor CAL-101 (CI range, 0.16-0.85). CAL-101 was also synergistic with the allosteric MALT1 inhibitor mepazine (supplemental Figure 3). CIs could not be calculated in OCI-Ly3 cells because they were baseline resistant to SYK, PKC, BTK, and most PI3K inhibitors. The same was true for AKTi and MEKi combinations (Figure 3A). MALT1/IRAK4 inhibition combinations were synergistic in IRAK4i-sensitive cell lines (CI range, 0.64-0.94; Figure 3B). In conclusion, most BCR, PI3K, and TLR pathway inhibitors were additive or synergistic with MALT1i, further validating our screen results in the CD79B-mutant cell line HBL-1. This effect was most striking for PI3K inhibitors, with the exception of OCI-Ly3 cells.
MALT1/PI3Kδ combinatorial inhibition yields enhanced, but not sustained, antilymphoma effects in vivo
Given that MALT1/PI3Kδ combinatorial inhibition was most highly synergistic against ABC-DLBCL lines, and because CAL-101 is approved by the US Food and Drug Administration for lymphoid neoplasms, we further investigated the efficacy of this combination. MALT1/PI3Kδ-i combination significantly decreased cell numbers compared with PI3Kδ-i or MALT1i alone at 96 hours through a combination of increased apoptosis (Figure 4A-B; supplemental Figure 4A-B) and decreased proliferation (Figure 4C-D; supplemental Figure 4C-D). PI3K inhibitors were shown to reduce MALT1 activity in CD79B-mutant DLBCL lines,34 which could explain, in part, their added effects on viability.
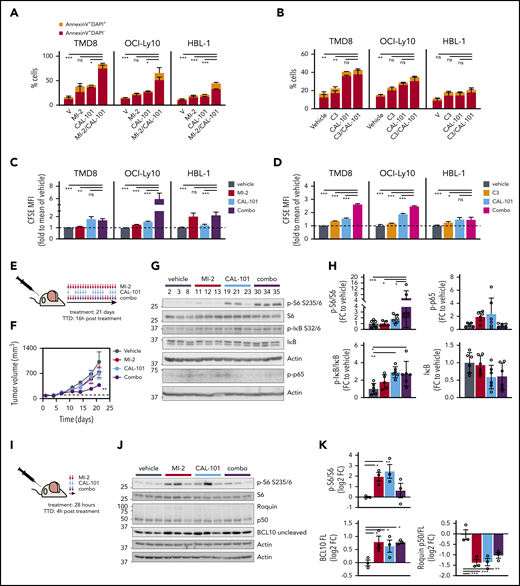
MALT1/PI3Kδ simultaneous inhibition synergistically kills ABC-DLBCL in vitro and in vivo. Apoptosis for CAL-101 combinations with structurally unrelated MALT1 inhibitors MI-2 (A) and C3 (B) was studied using annexin V/DAPI staining in the indicated cell lines. Cells were treated for 4 days, and the following drug concentrations were used: 1 μM CAL-101, 250 nM MI-2 (100 nM for HBL-1), and 1 μM C3. Results are the percentage of cells ± standard error of the mean (SEM) of ≥2 independent experiments in triplicate. CFSE dilution assay results for CAL-101 combinations with MI-2 (C) or C3 (D) in the indicated cell lines, treated as above. The y-axis shows CFSE mean fluorescence intensity (MFI) fold to vehicle ± SEM of ≥2 independent experiments in triplicate. (E) Dosing schedule of MI-2/CAL-101 combinations in vivo. TTD, time to death. (F) Tumor growth curve for TMD8 xenografts (n = 6 per group). Mice were treated with 25 mg/kg per day of MI-2, 30 mg/kg per day of CAL-101, their combination, or the same volume of vehicle for 21 days, following the schedule in (E). (G) Representative western blot results for the indicated targets in TMD8 xenografted tumors treated long-term (21 days) with vehicle, MI-2, CAL-101, or their combination (n = 3 per group). (H) Quantification of western blots in (G) for all mice (n = 6 per group). Protein levels were normalized to actin and are relative to the average of vehicle-treated mice. (I) Short-term treatment schedule of TMD8 xenografted mice. Dosing as in (F). (J) Western blot results for the indicated targets in TMD8 xenografted tumors treated short-term (28 hours) with vehicle, MI-2, CAL-101, or their combination (n = 3 per group). (K) Quantification of results in (J). Protein levels were normalized to actin and are relative to the average of vehicle-treated mice. *P < .05, **P < .01, ***P < .001, 1-way analysis of variance corrected for multiple comparisons 5% FDR. FC, fold change; ns, not significant (P > .05).
MALT1/PI3Kδ simultaneous inhibition synergistically kills ABC-DLBCL in vitro and in vivo. Apoptosis for CAL-101 combinations with structurally unrelated MALT1 inhibitors MI-2 (A) and C3 (B) was studied using annexin V/DAPI staining in the indicated cell lines. Cells were treated for 4 days, and the following drug concentrations were used: 1 μM CAL-101, 250 nM MI-2 (100 nM for HBL-1), and 1 μM C3. Results are the percentage of cells ± standard error of the mean (SEM) of ≥2 independent experiments in triplicate. CFSE dilution assay results for CAL-101 combinations with MI-2 (C) or C3 (D) in the indicated cell lines, treated as above. The y-axis shows CFSE mean fluorescence intensity (MFI) fold to vehicle ± SEM of ≥2 independent experiments in triplicate. (E) Dosing schedule of MI-2/CAL-101 combinations in vivo. TTD, time to death. (F) Tumor growth curve for TMD8 xenografts (n = 6 per group). Mice were treated with 25 mg/kg per day of MI-2, 30 mg/kg per day of CAL-101, their combination, or the same volume of vehicle for 21 days, following the schedule in (E). (G) Representative western blot results for the indicated targets in TMD8 xenografted tumors treated long-term (21 days) with vehicle, MI-2, CAL-101, or their combination (n = 3 per group). (H) Quantification of western blots in (G) for all mice (n = 6 per group). Protein levels were normalized to actin and are relative to the average of vehicle-treated mice. (I) Short-term treatment schedule of TMD8 xenografted mice. Dosing as in (F). (J) Western blot results for the indicated targets in TMD8 xenografted tumors treated short-term (28 hours) with vehicle, MI-2, CAL-101, or their combination (n = 3 per group). (K) Quantification of results in (J). Protein levels were normalized to actin and are relative to the average of vehicle-treated mice. *P < .05, **P < .01, ***P < .001, 1-way analysis of variance corrected for multiple comparisons 5% FDR. FC, fold change; ns, not significant (P > .05).
To evaluate the efficacy of this combination in vivo, TMD8 cells were engrafted in NOD-SCID mice. When tumors reached ∼100 mm3, mice were randomized to 4 treatment arms: MALT1i (MI-2), PI3Kδi (CAL-101), combination (combo), or vehicle (n = 6 per group). The dosing schedule consisted of daily MI-2 treatment, CAL-101 5 days per week, or both (Figure 4E). No changes in body weight were attributable to drug treatment (supplemental Figure 4E). MALT1/PI3Kδ-i combination treatment significantly impaired tumor growth (q-value < 0.0151), whereas each drug alone had only a modest effect (Figure 4F).
However, after 15 days of treatment, MALT1/PI3Kδ-i–treated tumors resumed growth, which prompted us to evaluate signaling events bypassing MALT1/PI3Kδ-i in the xenografted tumors. PI3Kδ is essential for BTK activation, contributing to NF-κB activation, whereas MALT1 protease enhances NF-κB signaling by attenuating signaling shutdown.9 PI3K also induces MTOR activation. Therefore, we evaluated NF-κB and MTOR activation in tumors collected after 21 days of treatment (Figure 4E). CAL-101 and combo-treated tumors showed a significant increase in phosphorylated (p-)IκB/IκB (mean fold change over vehicle, 2.9; q-value < 0.01), a trend toward lower total IκB levels (q-value = 0.15), and increased p-p65 (q-value = 0.14 and 0.053, respectively) (Figure 4G-H) compared with controls, suggesting increased canonical NF-κB signaling in these escaping tumors. To evaluate MTOR signaling, we assessed S6 phosphorylation and observed a significant increase in p-S6-S235/6 in MALT1/PI3Kδ-i combo–treated tumors (mean fold change over vehicle > 5.4; q-value = 0.02), indicative of increased MTOR activity (Figure 4G-H). These findings indicate that MALT1/PI3Kδ-i combo treatment potentiated NF-κB and MTOR activation, suggesting that these activities might constitute feedback mechanisms that could attenuate MALT1i response.
Next, we evaluated the short-term effect of MI-2, CAL-101, or their combination in vivo, focusing on MTOR signaling. TMD8 xenografted mice were treated with MI-2, CAL-101, or combo for 2 consecutive days and were euthanized 4 hours after treatment (Figure 4I). As expected, both drugs attenuated MALT1 protease activity over its targets BCL10 and Roquin (Figure 4J-K). We also observed a strong induction of S6 phosphorylation by MI-2 and CAL-101 and, to a lesser extent, by their combination (Figure 4J-K), although p-S6 was clearly even more enriched in the longer-exposure combo-resistant lymphomas (Figure 4G-H). These findings prompted us to explore whether MTOR inhibitors could yield synthetic lethal effects together with MALT1i.
MALT1i induces MTORC1 activation and manifests potent synergy with MTOR inhibitors
MTOR forms 2 complexes: MTORC1 mediates phosphorylation of S6K, which, in turn, induces S6-S235/6 phosphorylation, and MTORC2 phosphorylates AKT at S473, which, in turn, can activate MTORC1, although MTORC1 can also be activated in an AKT-independent manner.35 Given that ABC-DLBCL cell lines are resistant to AKT inhibition (Figure 3A), we reasoned that MTORC1 is more essential. To test this, we treated HBL-1 and TMD8 cells for 1 hour with CAL-101, MK-2206, or rapamycin and evaluated their effects on the phosphorylation of S6 at S235/6 (MTORC1 specific) and AKT at S473 (MTORC2 specific). CAL-101 decreased AKT-S473 phosphorylation but only partially inhibited S6-S235/6 phosphorylation (supplemental Figure 5A-B, lanes 2 and 3), suggesting that PI3Kδ is only partially responsible for MTORC1 activation in ABC-DLBCL. Conversely, AKT inhibition by MK-2206 completely blocked AKT-S473 phosphorylation but had little effect on S6-S235/6 (supplemental Figure 5A-B, lanes 4 and 5), confirming that ABC-DLBCL cells are AKT independent (Figure 3A). In contrast, rapamycin profoundly inhibited S6-S235/6 phosphorylation but enhanced AKT-S473 phosphorylation (supplemental Figure 5A-B, lanes 6 and 7). This is consistent with previous studies showing that rapamycin induces AKT-S473 phosphorylation, likely as a result of increased MTORC2 activity following MTORC1 blockade.36
To compare the effects of MALT1i/PI3Kδ-i and MALT1i/MTORC1-i on S6 and AKT phosphorylation, ABC-DLBCL cells were treated for 1 hour with individual drugs or their combinations, and p-S6-S235/6 and p-AKT-S473 levels were assessed (Figure 5A). Consistent with effects in vivo, MI-2 and C3 induced a strong and significant increase in S6 phosphorylation (Figure 5A-B), whereas CAL-101 and rapamycin decreased basal S6 phosphorylation partially and completely, respectively. Both drugs prevented MALT1-mediated induction of p-S6, indicating that this effect is mediated through PI3K signaling. In contrast, p-AKT-S473 was not changed or was slightly increased by MI-2 or C3 (Figure 5A,C). CAL-101, but not rapamycin, strongly blocked AKT-S473 phosphorylation, alone or in combination (Figure 5A,C). Consistent with our longer-term in vivo data, MALT1i by MI-2, C3, or mepazine yielded an enhanced abundance of p-S6K1 T389 and p-S6-S235/6, suggesting that ABC-DLBCL cells surviving exposure to MALT1i exhibit MTORC1 activation, again pointing to this effect as a potential resistance mechanism (supplemental Figure 5C).
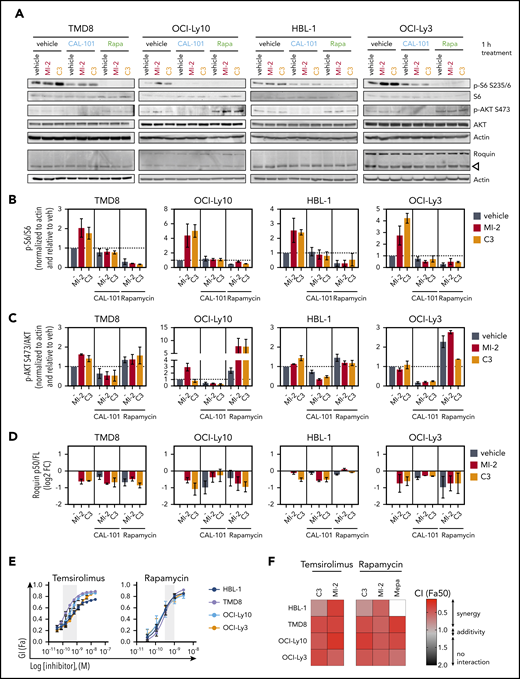
MALT1/MTORC1 combinations are highly synergistic against ABC-DLBCL. (A) ABC-DLBCL cell lines were treated for 1 hour with MI-2 (250 nM), C3 (1 μM), CAL-101 (1 μM), rapamycin (Rapa; 1 nM), or their combinations, as indicated, and proteins were extracted. Levels of phosphorylated and total proteins were evaluated by western blot. (B-D) Quantification of p-6/S6 levels (B), p-AKT/AKT levels (C) and Roquin p50/full length (D) for experiments in (A), respectively. Protein levels were normalized to actin and are relative to the average of vehicle-treated cells. Data are average ± standard error of the mean (SEM) of ≥2 independent experiments. (E) Dose response for temsirolimus (left panel) and rapamycin (right panel) in 4 ABC-DLBCL lines. Gray shaded area represents on-target dose. (F) Heat map of CIs at fraction affected 50% (Fa50) for C3 or MI-2 with temsirolimus or rapamycin in the indicated cell lines. (G-H) ZIP δ-score synergy plots for rapamycin in combination with MI-2 (G) or C3 (H) in the indicated cell lines and primary ABC-DLBCL specimens treated ex vivo in 3D organoids. *P < .05, **P < .01, ***P < .001, 1-way analysis of variance corrected for multiple comparisons 5% FDR. ns, not significant (P > .05).
MALT1/MTORC1 combinations are highly synergistic against ABC-DLBCL. (A) ABC-DLBCL cell lines were treated for 1 hour with MI-2 (250 nM), C3 (1 μM), CAL-101 (1 μM), rapamycin (Rapa; 1 nM), or their combinations, as indicated, and proteins were extracted. Levels of phosphorylated and total proteins were evaluated by western blot. (B-D) Quantification of p-6/S6 levels (B), p-AKT/AKT levels (C) and Roquin p50/full length (D) for experiments in (A), respectively. Protein levels were normalized to actin and are relative to the average of vehicle-treated cells. Data are average ± standard error of the mean (SEM) of ≥2 independent experiments. (E) Dose response for temsirolimus (left panel) and rapamycin (right panel) in 4 ABC-DLBCL lines. Gray shaded area represents on-target dose. (F) Heat map of CIs at fraction affected 50% (Fa50) for C3 or MI-2 with temsirolimus or rapamycin in the indicated cell lines. (G-H) ZIP δ-score synergy plots for rapamycin in combination with MI-2 (G) or C3 (H) in the indicated cell lines and primary ABC-DLBCL specimens treated ex vivo in 3D organoids. *P < .05, **P < .01, ***P < .001, 1-way analysis of variance corrected for multiple comparisons 5% FDR. ns, not significant (P > .05).
Given these considerations, we next evaluated whether MTORC1-targeted therapy could enhance the effects of MALT1i on ABC-DLBCLs. All cell lines were sensitive to MTOR inhibitors rapamycin and temsirolimus (Figure 5D), and their combination with MALTi yielded striking synergistic effects (CI range, 0.24-0.79) (Figure 5E). To further validate this finding, we studied matrices of 6×6 drug combinations of rapamycin and C3 or MI-2 in TMD8, HBL-1, OCI-Ly10, OCI-Ly3, and 2 primary ABC-DLBCL patient samples grown in 3D organoid culture. Synergy was calculated by ZIP synergy algorithm. The ZIP model considers differences in the percentage of killing and drug concentration and, as such, constitutes an integration of the Bliss independence and the Loewe additivity models. ZIP δ-scores of 0, >0, and <0 correspond to zero interaction, synergy, and antagonism, respectively.25 In all cases, MALT1/MTOR combinations were again shown to be highly synergistic (Figures 5F-G; supplemental Figure 5D-E).
Collectively, these data suggest that MALT1i induces MTORC1 activity as a potential feedback mechanism, and this activation is partially PI3K dependent and largely AKT independent. In support of this hypothesis, we found that AMPK and related genes that can block MTORC1 function were enriched in our shRNA screen. More specifically, AMPK genes (PRKAA1, PRKAB1, PRKAG1) and AMPK-activating genes (ADIPOR1, CAMKK1, CAMKK2) were among the genes whose knockdown decreased sensitivity to MI-2 (supplemental Figure 6A), whereas AMPK negative regulators (PPP2CA, PPP2R2C, NR4A1) or AMPK substrates (RPTOR, GRB10, AKAP1) were among the genes whose knockdown increased sensitivity to MI-2 (supplemental Figure 6A). Loss of AMPK-activating genes could facilitate MTORC1 activity by inhibiting or reducing activity of AMPK and support the notion that enhanced MTORC1 activity is associated with MALT1i resistance (supplemental Figure 6B).
Enhanced cell killing and proliferation arrest in ABC-DLBCL cells treated with MTORC1 and MALT1 inhibitors
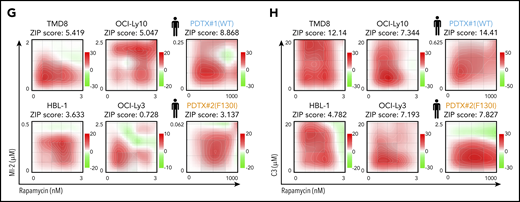
Given the synergy of MALT1i/MTORC1-i combinations, we next evaluated the impact of these drugs on apoptosis and proliferation. For this, we exposed 4 ABC-DLBCL lines to MALT1i (C3 or MI-2), rapamycin, or their combination for 4 days. MALT1/MTORC1-i combination significantly increased apoptotic (annexin V+) and dead cell (annexin V+, DAPI+) fractions compared with single compounds (Figure 6A-B; supplemental Figure 7A-B). As measured by carboxyfluorescein diacetate succinimidyl ester (CFSE) dilution, each drug alone inhibited proliferation to a variable extent, whereas the MALT1/MTORC1-i combination had a generally greater effect than did each drug alone (Figure 6C-D; supplemental Figure 7C-D). MALT1/MTORC1-i was even more effective at killing ABC-DLBCL cells grown in 3D organoids (Figure 6E-F), suggesting that this combination could be particularly useful for in vivo treatment.
MALT1/MTORC1 inhibition suppresses growth of ABC-DLBCL through decreased proliferation and increased cell death. Apoptosis for rapamycin (Rapa) combinations with structurally unrelated MALT1 inhibitors MI-2 (A) and C3 (B) was studied using annexin V/DAPI staining in the indicated cell lines. Cells were treated for 4 days, and the following drug concentrations were used: 1 nM Rapa, 250 nM MI-2 (100 nM for HBL-1), and 1 μM C3. Results are percentage of cells ± standard error of the mean (SEM) of ≥2 independent experiments in triplicate. CFSE dilution assay results for rapamycin combinations with MI-2 (C) or C3 (D) in the indicated cell lines, treated as above. The y-axis shows CFSE mean fluorescence intensity fold to vehicle ± SEM of ≥2 independent experiments in triplicate. (E) OCI-Ly3 cells were seeded in 2-dimensional (2D) or 3D conditions, and their response to C3, rapamycin, or their combination was evaluated using Calcein-AM (for live cells) and propidium iodide staining (for dead cells). (F) Plot for live/dead quantification of OCI-Ly3 cells grown in 2D vs 3D conditions for 6 days. Results are percentage of cells ± SEM of 4 replicates. *P < .05, **P < .01, ***P < .001, 1-way analysis of variance corrected for multiple comparisons 5% FDR. ns, not significant (P > .05).
MALT1/MTORC1 inhibition suppresses growth of ABC-DLBCL through decreased proliferation and increased cell death. Apoptosis for rapamycin (Rapa) combinations with structurally unrelated MALT1 inhibitors MI-2 (A) and C3 (B) was studied using annexin V/DAPI staining in the indicated cell lines. Cells were treated for 4 days, and the following drug concentrations were used: 1 nM Rapa, 250 nM MI-2 (100 nM for HBL-1), and 1 μM C3. Results are percentage of cells ± standard error of the mean (SEM) of ≥2 independent experiments in triplicate. CFSE dilution assay results for rapamycin combinations with MI-2 (C) or C3 (D) in the indicated cell lines, treated as above. The y-axis shows CFSE mean fluorescence intensity fold to vehicle ± SEM of ≥2 independent experiments in triplicate. (E) OCI-Ly3 cells were seeded in 2-dimensional (2D) or 3D conditions, and their response to C3, rapamycin, or their combination was evaluated using Calcein-AM (for live cells) and propidium iodide staining (for dead cells). (F) Plot for live/dead quantification of OCI-Ly3 cells grown in 2D vs 3D conditions for 6 days. Results are percentage of cells ± SEM of 4 replicates. *P < .05, **P < .01, ***P < .001, 1-way analysis of variance corrected for multiple comparisons 5% FDR. ns, not significant (P > .05).
MALT1-MTORC1 combination therapy induces complete regression of ABC-DLBCLs in vivo
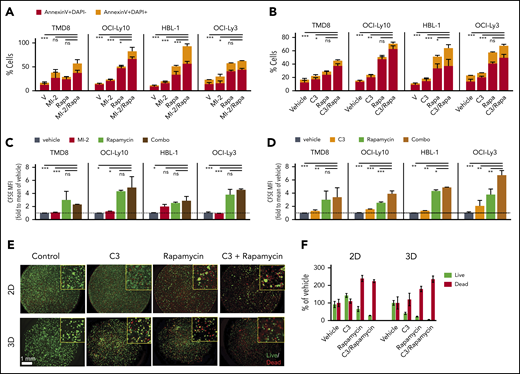
To assess MTORC1/MALT1i combination in vivo, we implanted TMD8 cells in NOD-SCID mice. When tumors reached 200 mm3, we randomized mice to receive vehicle, MI-2 (25 mg/kg), rapamycin (1 mg/kg), or their combination (n = 5). Mice were treated daily for 15 days (Figure 7A), at which point vehicle-treated mice were euthanized because of tumor burden, and drug-treated mice were followed for tumor growth and survival. Strikingly, all tumors in MALT1i/MTORC1i-treated mice exhibited a marked regression in size, whereas, in contrast, each drug alone attenuated the rate of tumor growth to different degrees (Figure 7B; supplemental Figure 8A). Accordingly, the change in tumor volume between day 0 and day 15 was reduced significantly for the combination vs vehicle, in contrast to each of the individual treatments (Figure 7C). Upon treatment suspension, tumor growth resumed in all treatment arms (Figure 7B). However, we observed a significant difference in survival in combo-treated mice compared with vehicle-treated mice [log-rank test, p(Bonferroni-Hochberg [BH]) = 0.009], MI-2–treated mice [log-rank test, p(BH) = 0.004], or rapamycin-treated mice [log-rank test, p(BH) = 0.025] (Figure 7D). Median survival more than doubled in combination-treated mice compared with vehicle-treated (37 days vs 15 days, respectively) (Figure 7E). MALT1i/MTORC1i-treated mice experienced 10% weight loss, which remained within the normal weight for strain and age (supplemental Figure 8B).
MTORC1-MALT1i combination promoted ABC-DLBCL regression in vivo. (A) Experimental scheme of the in vivo MI-2/rapamycin combination experiment. (B) Tumor growth curve for TMD8 xenografts (n = 5 per group). Mice were treated with vehicle, 25 mg/kg per day of MI-2, 1 mg/kg per day of rapamycin, or their combination for 15 days. (C) Change in tumor volume at day 15 compared with day 0 for each mouse. The p values were determined using analysis of variance and Tukey's multiple-comparisons test. (D) Survival curves for mice in (B). The P values were calculated using log-rank Bonferroni-Hochberg-adjusted survival analysis. (E) Median survival for the different treatment groups in (D). (F) Dosing schedule for a short-term experiment to evaluate the effect of the combinations in signaling. Arrows, dosing event. (G) Immunohistochemistry was used to study p-S6-S235/6 levels in TMD8 xenografted mice that were treated twice (28 hours) with the indicated inhibitors and their combinations, as indicated in (F). Samples were stained with anti-phospho-S6 antibody. (H) p-S6-S235/6 levels in TMD8 xenografted tumors treated with the indicated drugs and combinations. Data correspond to 5 high-powered fields per tumor in 3 or 4 mice per treatment group. *P < .05, **P < .01, ****P < .0001. ns, not significant (P > .05).
MTORC1-MALT1i combination promoted ABC-DLBCL regression in vivo. (A) Experimental scheme of the in vivo MI-2/rapamycin combination experiment. (B) Tumor growth curve for TMD8 xenografts (n = 5 per group). Mice were treated with vehicle, 25 mg/kg per day of MI-2, 1 mg/kg per day of rapamycin, or their combination for 15 days. (C) Change in tumor volume at day 15 compared with day 0 for each mouse. The p values were determined using analysis of variance and Tukey's multiple-comparisons test. (D) Survival curves for mice in (B). The P values were calculated using log-rank Bonferroni-Hochberg-adjusted survival analysis. (E) Median survival for the different treatment groups in (D). (F) Dosing schedule for a short-term experiment to evaluate the effect of the combinations in signaling. Arrows, dosing event. (G) Immunohistochemistry was used to study p-S6-S235/6 levels in TMD8 xenografted mice that were treated twice (28 hours) with the indicated inhibitors and their combinations, as indicated in (F). Samples were stained with anti-phospho-S6 antibody. (H) p-S6-S235/6 levels in TMD8 xenografted tumors treated with the indicated drugs and combinations. Data correspond to 5 high-powered fields per tumor in 3 or 4 mice per treatment group. *P < .05, **P < .01, ****P < .0001. ns, not significant (P > .05).
We next evaluated the effect of these treatments on p-S6-S235/6 in vivo. Mice bearing 300 mm3 TMD8 xenografts were randomized to receive vehicle, MI-2 (25 mg/kg), rapamycin (1 mg/kg), or their combination (n = 3 mice per group) for 2 consecutive days and were euthanized 4 hours after the last dosing (Figure 7F). Consistent with our in vitro studies, MI-2 promoted a significant increase in p-S6-S235/6 in vivo compared with vehicle treatment (Figure 7G-H). In contrast, rapamycin effectively suppressed levels of p-S6-S235/6 and fully rescued MI-2–induced p-S6-S235/6 (Figure 7H). All of these results were concordant with our in vitro findings and indicate that MALT1i induces MTORC1 activation. Blocking MTORC1 in combination with MALT1i overcomes this effect and yields enhanced therapeutic efficacy.
Discussion
A first-in-man MALT1-targeting clinical trial recently began accruing patients, so identifying putative resistance and feedback mechanisms against MALT1i is critically important. Herein, we used a functional genomic screen in MALT1i-treated lymphoma cells to identify such mechanisms. Notably, the genes involved in the BCR-PI3K-TLR pathways were modulators of response to MALT1i. Most strikingly, loss of pathway activators (CARD11, IRAK4, PIK3CG, among others) sensitized lymphoma cells to MALT1i, whereas loss of recurrently mutated pathway repressors (BIRC2, CBLB, TNFAIP3, TRAF2) conferred resistance. Loss of TNFAIP3 (20%-30% in ABC-DLBCL2 ) in our screen provided resistance to MALT1i, as previously noted.11 TNFAIP3 loss also correlated with innate or acquired resistance to BTK inhibition.37,38 Notably, TRAF2, whose loss was enriched in MI-2–resistant cells, is recurrently truncated in CLL, and its loss yielded BAFF independence in a lymphoma mouse model.39 Loss of negative regulators TNFAIP3, TNIP, BIRC2, and TRAF2 suggests that noncanonical NF-κB signaling might protect ABC-DLBCL upon MALT1i. Overall, our findings confirm the importance of BCR-PI3K-TLR signaling in ABC-DLBCLs40 and highlight the extraordinary degree of coordination among these pathways. This provides numerous opportunities for combinatorial regimens, as well as many routes of escape. Although beyond the scope of this article, we also found interesting connections to cell metabolism (eg, loss of TCA enzymes favoring resistance and loss of glycolysis-related enzymes causing sensitization).
Using a directed combinatorial pharmacologic screen, we validated therapeutically relevant functional screen results. As previously shown for mepazine-ibrutinib combinations,28 MI-2 and C3 enhanced the effect of BTK inhibition. Used like this, MALT1 inhibitors could prevent resistance to BTK inhibition. However, MALT1/BTK-i was not highly synergistic, suggesting that targeting the same signaling axis twice (BCR-PKC) is less impactful than targeting more distant signaling mediators (eg, BCR-PKC and PI3K-MTORC). MALT1/PI3Kδ-i combinations were highly synergistic, particularly for lower drug concentrations, suggesting that MALT1 inhibitors could allow for lower doses of PI3Ki to be used, thus preventing the toxicities associated with PI3K-targeted therapy.41
However, MALT1/PI3Kδ-i in vivo responses were transitory, and tumors kept growing during treatment, which suggested activation of feedback mechanisms. At the protein level, tumors treated with the MALT1/PI3Kδ-i combination showed increased p-S6-S235/6, which is indicative of MTORC1 activation. MTORC1 activation mediates resistance to other targeted agents.42 Persistent activation of MTORC1 is a hallmark of PI3Kα inhibition resistance in squamous cell carcinomas,43 and it enabled adaptive resistance to anti-VEGF agents44 or glycolytic block by 2-deoxy-D-glucose.45 Similarly, we found that MALT1i promoted S6K1-T389 and S6-S235/6 phosphorylation. Accordingly, MALT1/MTORC1-i combination was highly synergistic in vitro and led to tumor regression in vivo. Interestingly, chronic treatment with ibrutinib rewired the kinome of MCL cells and promoted MTORC1 activation and survival in the presence of ibrutinib treatment through PI3K and integrin signaling.46 Analogous to our findings, combinatorial BTK and MTOR treatment with ibrutinib and AZD-8055 was synergistic in vitro and in vivo in MCL.46 These findings were independently reproduced with a different BTK inhibitor, PLS-123, in combination with everolimus.47 Comparably, rapalogs cooperated with ibrutinib to inhibit cell growth in ABC-DLBCL cells.48,49 Also, dual mTORC1/2 inhibitor (AZD2014) with ibrutinib in ABC-DLBCL induced tumor regression in vivo.50 Given the critical role of MALT1 downstream of BTK signaling (eg, CARD11-activating mutations abrogate response to BTK inhibitors37 ), these data lend further support to our findings.
MALT1 and MTOR colocalize in My-T-BCR supercomplexes formed by CBM proteins, TLR9-MYD88, and MTORC1 in ABC-DLBCL.8 However, it is unknown whether MALT1 and MTOR interact directly or through accessory proteins. One or more MTORC1 proteins could be MALT1 substrates, and their inhibition led to increased activity. On the other hand, the MALT1 target Roquin can attenuate AMPK signaling and promote MTORC1 activity during T follicular helper cell differentiation.51 Conversely, however, Roquin inhibited the PI3K-MTOR signaling pathway in regulatory T cells.52 Therefore, MTORC1 activation following MALT1i could be due to direct or indirect MALT1 protease effects through known or new substrates.
MTOR inhibition by rapalogs showed a significant clinical effect in phase 1 trials in DLBCL and follicular lymphoma.53,54 MTOR inhibition showed moderate efficacy in DLBCL, with 28%-29% or 37.5% overall response rate, alone or in combination with rituximab, respectively.55 MTOR inhibition toxicity was low and nonhematologic toxicity events were rare when serum levels of MTOR inhibitor were within the therapeutic range.56 However, MTOR inhibition alone is largely cytostatic, and research efforts are directed at identifying combinations that can synergistically kill cancer cells.55 MALT1-MTORC1-i combinations are very synergistic and a promising therapeutic option. First, unlike other BCR-directed inhibitors, CARD11WT and mutant ABC-DLBCL lines were sensitive to MALT1/MTORC1-I, which broadens the spectrum of patients benefitting from this intervention. Second, chronic inhibition in MALT1 protease-dead murine models led to serious autoimmune disease.57-59 Conversely, MTORC1 inhibition leads to immunosuppression and is used to prevent organ rejection. Therefore, MTORC1 inhibition would not only synergize to kill lymphoma but would potentially control the negative effects associated with continued MALT1 protease inhibition.
Data sharing requests should be sent to Lorena Fontan (lof2005@med.cornell.edu).
The online version of this article contains a data supplement.
The publication costs of this article were defrayed in part by page charge payment. Therefore, and solely to indicate this fact, this article is hereby marked “advertisement” in accordance with 18 USC section 1734.
Acknowledgments
The authors thank the Epigenomics Core Facility at Weill Cornell Medicine for assistance with shRNA barcoding sequencing and the Sandra and Edward Meyer Cancer Center PDTX Shared Resource for support with PDTX studies.
L.F. acknowledges funding from the Department of Defense (grant W81XWH-15-1-0418), National Institutes of Health, National Cancer Institute Specialized Program of Research Excellence (P50-CA192937), and The Lymphoma Research Foundation. A.S. acknowledges funding from National Institutes of Health/National Cancer Institute (grants 1R01CA238745-01A1 and 5R33CA212968-03), National Institutes of Health/National Institute of Allergic and Infectious Diseases (grant 5R01AI132738-03), and Department of Defense (grant W81XWH-17-1-0215). A.M. acknowledges funding from National Institutes of Health/National Cancer Institute (grant R35 CA220499), National Institutes of Health National Cancer Institute Specialized Program of Research Excellence (P50 CA192937-01), The Chemotherapy Foundation, and The Samuel Waxman Cancer Research Foundation.
Authorship
Contribution: L.F. and A.M. designed the research and wrote the manuscriupt; L.F., R.G., G.C., M.D., J.W., S.S., H.S., and I.U. conducted experiments and/or acquired data; L.F., R.G., M.R.T., M.X., J.P., and A.S. analyzed data; and G.I. provided PDTX specimens.
Conflict-of-interest disclosures: A.M. receives research support from Janssen Pharmaceuticals and is a consultant for Epizyme and Constellation. The remaining authors declare no competing financial interests.
Correspondence: Lorena Fontan, 413 E. 69th St, BB-1462, New York, NY 10021; e-mail: lof2005@med.cornell.edu; and Ari Melnick, 413 E. 69th St, BB-1430, New York, NY 10021; e-mail: amm2014@med.cornell.edu.

This feature is available to Subscribers Only
Sign In or Create an Account Close Modal