

Key Points
Flotetuzumab is associated with acceptable safety and evidence of activity in AML patients with PIF/ER.
A 10-gene immune signature predicts response to flotetuzumab with greater accuracy than the ELN risk classifier.

Abstract
Approximately 50% of acute myeloid leukemia (AML) patients do not respond to induction therapy (primary induction failure [PIF]) or relapse after <6 months (early relapse [ER]). We have recently shown an association between an immune-infiltrated tumor microenvironment (TME) and resistance to cytarabine-based chemotherapy but responsiveness to flotetuzumab, a bispecific DART antibody-based molecule to CD3ε and CD123. This paper reports the results of a multicenter, open-label, phase 1/2 study of flotetuzumab in 88 adults with relapsed/refractory AML: 42 in a dose-finding segment and 46 at the recommended phase 2 dose (RP2D) of 500 ng/kg per day. The most frequent adverse events were infusion-related reactions (IRRs)/cytokine release syndrome (CRS), largely grade 1-2. Stepwise dosing during week 1, pretreatment dexamethasone, prompt use of tocilizumab, and temporary dose reductions/interruptions successfully prevented severe IRR/CRS. Clinical benefit accrued to PIF/ER patients showing an immune-infiltrated TME. Among 30 PIF/ER patients treated at the RP2D, the complete remission (CR)/CR with partial hematological recovery (CRh) rate was 26.7%, with an overall response rate (CR/CRh/CR with incomplete hematological recovery) of 30.0%. In PIF/ER patients who achieved CR/CRh, median overall survival was 10.2 months (range, 1.87-27.27), with 6- and 12-month survival rates of 75% (95% confidence interval [CI], 0.450-1.05) and 50% (95% CI, 0.154-0.846). Bone marrow transcriptomic analysis showed that a parsimonious 10-gene signature predicted CRs to flotetuzumab (area under the receiver operating characteristic curve = 0.904 vs 0.672 for the European LeukemiaNet classifier). Flotetuzumab represents an innovative experimental approach associated with acceptable safety and encouraging evidence of activity in PIF/ER patients. This trial was registered at www.clinicaltrials.gov as #NCT02152956.
Introduction
Acute myeloid leukemia (AML) is a highly heterogeneous disease.1 Despite the recent approval of several new drugs, cure rates remain largely unsatisfactory, with the majority of patients being either refractory to currently available therapeutics or relapsing after achieving remission.1,2 Primary refractory and relapsed (R/R) AML are usually treated as 1 single clinical entity, even though the probability of success of subsequent salvage therapy differs substantially between affected individuals.3-8 Particularly poor outcomes have been observed in patients with primary induction failure (PIF) or those with an initial remission duration of <6 months (early relapse [ER]). Differences in outcomes have been recently associated with immune transcriptomic profiles of the tumor microenvironment (TME), which stratify AML cases into an immune-infiltrated and immune-depleted subgroup, with the former being enriched in interferon γ (IFN- γ)-related messenger RNA (mRNA) profiles and showing resistance to cytotoxic chemotherapy but an enhanced probability of response to immunotherapy.9
Given the success of bispecific antibodies, including the T-cell–engaging single-chain antibody construct blinatumomab, in the treatment of B-cell malignancies,10,11 similar therapeutic approaches are being developed in AML. CD123, the low-affinity interleukin-3 receptor α subunit (IL3RA), is expressed in 60% to 80% of patients with AML.12-15 What makes CD123 particularly appealing as a therapeutic target in AML is not only that high expression of CD123 is enriched in PIF/ER AML patients but also that high CD123 on AML blasts is associated with poor outcomes.16-18 Although CD123 is not specifically expressed in putative AML progenitor and stem cells, its targeting could lead to the eradication of leukemia stem cell pools.16
Flotetuzumab (MGD006) is an investigational bispecific antibody-based molecule to CD3ε and CD123 engineered in a DART format.19 CD3-engaging bispecific molecules bind both tumor and effector cells to promote an immunologic synapse and redirect polyclonal effectors to kill tumor cells in an major histocompatibility complex (MHC)-independent fashion. In preclinical models, flotetuzumab mediated target-effector cell association, T-cell activation and proliferation, and potent killing of CD123+ AML blasts in vitro and in vivo.20,21 Herein, we report the results of a phase 1/2 study of flotetuzumab in R/R AML. Furthermore, given the preliminary evidence of an association between an immune-infiltrated TME and responsiveness to flotetuzumab that we recently reported,9 we explored this agent’s activity specifically in the PIF/ER AML subset.
Methods
Study design
This open-label, multidose, single-arm, multicenter, phase 1/2, dose-escalation study was designed by the sponsor (MacroGenics Inc) in collaboration with the investigators to evaluate the toxicity profile, maximum tolerated dose (MTD), immunogenicity, pharmacokinetic (PK), and potential antitumor activity of flotetuzumab in patients with R/R AML or intermediate-2/high-risk myelodysplastic syndrome (MDS). The trial (NCT02152956) was approved by the institutional review boards of participating centers and was conducted according to the International Conference on Harmonization (ICH) Guideline for Good Clinical Practice (ICH E6), all applicable local and national regulations, and in accordance with the ethical principles of the Declaration of Helsinki. All participants provided written informed consent prior to enrollment.
The trial was conducted as a standard 3+3 dose-escalation study with expansion of the studied population at the protocol-defined MTD (500 ng/kg per day administered as a continuous infusion) (supplemental Figure 1, available on the Blood Web site).
Two dosing schedules were tested during the dose-escalation portion of the trial: intermittent dosing of 4 days on/3 days off per week and continuous 7-day infusion (CIV), at each target dose. The highest dose that was tested in the clinic was 700 ng/kg per day, at which dose 8 AML patients were treated, 5 on a 4 days on/3 days off per week schedule and 3 on a CIV schedule. Overall, this dose level exceeded the MTD, as evidenced by dose-limiting toxicity (DLT): 1 event of grade 3 delirium, 1 event of grade 3 acute confusional state, and 1 event of grade 3 cytokine release syndrome (CRS). At this dose, the high frequency and severity of the observed CRS and other adverse events (AEs) was in part managed by frequent dose reductions and dose interruptions, which had a significant impact on the dose intensity (DI; defined as the fraction of flotetuzumab delivered relative to the intended dose over time). The DI at the 700 ng/kg per day target dose level (post the lead-in dose [LID] phase) was 64.5% and 50.2%, for intermittent and CIV dosing, respectively, compared with 85.7% and 57.2% to 64.5%, respectively, for the 500 ng/kg per day target dose after the LID phase. PK and exposure-response analyses indicated that MGD006 exposure plateaus following the dose of 500 ng/kg per day (supplemental Figure 2), with exposure at doses above 500 ng/kg per day remaining equivalent to the exposure observed at the 500 ng/kg per day dose level, owing to a disproportional decreased DI in the 700 ng/kg per day cohort. The goal of the LID step-up dosing was to mitigate CRS and, consequently, improve the DI throughout the dosing period. Once the dose of 500 ng/kg per day was determined as the MTD and specified as the recommended phase 2 dose (RP2D), a “multistep LID” (MS-LID) scheme was introduced during week 1 cycle 1. The MS-LID comprised the following dosing: 30, 60, 100, 200, 300, 400 ng/kg per day each for 24 hours, and, on day 7, the dose increased to 500 ng/kg per day and was administered as a continuous infusion for the remainder of cycle 1.
Overall, the 3 LID schedules during week 1 were as follows: 1-step LID (100 ng/kg per day on days 1-4, cohort 2), 2-step LID (30 ng/kg per day on days 1-3 followed by 100 ng/kg per day), and MS-LID (supplemental Table 1). At the RP2D (500 ng/kg per day), 30 patients received the 2-step LID and 20 patients received the MS-LID.
The dosing regimens tested were intermittent dosing (4 days on/3 days off per week, cohort 2a) and continuous infusion dosing (cohorts 7, expansion, and ruxolitinib). Impact of LID on CRS (Figure 1B) and DI (Figure 1C-D) is notably improved with multiple small step-up dosing.
![LID and use of tocilizumab decrease CRS incidence, severity and duration, and lead to increase in total dose intensity. (A) Summary of dose and dosing schedule for flotetuzumab: MS-LID of 30, 60, 100, 200, 300, 400, 500 ng/kg per day for 24 hours each for days 1 through 7 given via CIV infusion, followed by 500 ng/kg per day CIV from days 8 to 28 during cycle 1, with subsequent additional 28-day cycles dosed at 500 ng/kg per day doses intermittently 4 days on/3 days off per week in 28-day cycles without LID lead-in. (B-D) LID mitigates CRS and consequently leads to improvement in dose intensity. (B) CRS grade (mean plus or minus standard error of the mean [SEM]) during each week of cycle 1. (C-D) Dose intensity (percentage, mean plus or minus 95% CI) was calculated as the amount of drug received during the time on study (actual drug delivered) relative to the intended dose during weeks 2 to 4 following respective LID during week 1 of 2-step (left) multistep (right) LID. (E) Tocilizumab effect on duration of IRR/CRS, irrespective of grade. Only patients for whom the drug was not modified as a method of controlling IRR/CRS are included. Mean duration of CRS without tocilizumab 1.8 days (n = 42) and with tocilizumab 1.2 days (n = 13); P = .0202, Student t test.](https://ash.silverchair-cdn.com/ash/content_public/journal/blood/137/6/10.1182_blood.2020007732/3/m_bloodbld2020007732f1.png?Expires=1770946637&Signature=Y9IfRAKkslfizgwxjiEe5IqNlrp60ozaXbMMlOa-peuQ7TDr0EtUanZinDKP-TDG93rJZI8AuxA5PCzAHfeMZQ5VEhK-F0ETTkdFBQ5sAjMqapfpg5HK~aVcpJf58rXvl-4giStkN9P0Hg3pMOM~BlO1YodGMRvyxJOalFRE3dUcjVxtPw1b37UyQRL8WlEJ6FJhbRuq5YmGss53-0EwVcnvqpI64F16yeLqSGt8O1UbSJZpSRL4YW77cYTjGKKHBJlEHnWV23akJDBF9ga~M695U4EGPp2B2a93x53OjcVLz8~3k~ZPDuyi8Hx1lPGBh6YRYxvZqT7AC476mbr~PQ__&Key-Pair-Id=APKAIE5G5CRDK6RD3PGA)
LID and use of tocilizumab decrease CRS incidence, severity and duration, and lead to increase in total dose intensity. (A) Summary of dose and dosing schedule for flotetuzumab: MS-LID of 30, 60, 100, 200, 300, 400, 500 ng/kg per day for 24 hours each for days 1 through 7 given via CIV infusion, followed by 500 ng/kg per day CIV from days 8 to 28 during cycle 1, with subsequent additional 28-day cycles dosed at 500 ng/kg per day doses intermittently 4 days on/3 days off per week in 28-day cycles without LID lead-in. (B-D) LID mitigates CRS and consequently leads to improvement in dose intensity. (B) CRS grade (mean plus or minus standard error of the mean [SEM]) during each week of cycle 1. (C-D) Dose intensity (percentage, mean plus or minus 95% CI) was calculated as the amount of drug received during the time on study (actual drug delivered) relative to the intended dose during weeks 2 to 4 following respective LID during week 1 of 2-step (left) multistep (right) LID. (E) Tocilizumab effect on duration of IRR/CRS, irrespective of grade. Only patients for whom the drug was not modified as a method of controlling IRR/CRS are included. Mean duration of CRS without tocilizumab 1.8 days (n = 42) and with tocilizumab 1.2 days (n = 13); P = .0202, Student t test.
LID and use of tocilizumab decrease CRS incidence, severity and duration, and lead to increase in total dose intensity. (A) Summary of dose and dosing schedule for flotetuzumab: MS-LID of 30, 60, 100, 200, 300, 400, 500 ng/kg per day for 24 hours each for days 1 through 7 given via CIV infusion, followed by 500 ng/kg per day CIV from days 8 to 28 during cycle 1, with subsequent additional 28-day cycles dosed at 500 ng/kg per day doses intermittently 4 days on/3 days off per week in 28-day cycles without LID lead-in. (B-D) LID mitigates CRS and consequently leads to improvement in dose intensity. (B) CRS grade (mean plus or minus standard error of the mean [SEM]) during each week of cycle 1. (C-D) Dose intensity (percentage, mean plus or minus 95% CI) was calculated as the amount of drug received during the time on study (actual drug delivered) relative to the intended dose during weeks 2 to 4 following respective LID during week 1 of 2-step (left) multistep (right) LID. (E) Tocilizumab effect on duration of IRR/CRS, irrespective of grade. Only patients for whom the drug was not modified as a method of controlling IRR/CRS are included. Mean duration of CRS without tocilizumab 1.8 days (n = 42) and with tocilizumab 1.2 days (n = 13); P = .0202, Student t test.
Consistent antileukemic activity and clinical responses were observed at the 500 ng/kg per day dose compared with doses below 500 ng/kg per day, where no morphological leukemia-free state (MLFS), complete remission (CR) with incomplete hematological recovery (CRi), CR with partial hematological recovery (CRh), or CR were noted.
Balancing CRS incidence and severity with DI and antileukemic activity, the RP2D and schema was henceforth defined as: MS-LID of 30, 60, 100, 200, 300, 400 ng/kg per day for 24 hours each for days 1 through 6, followed by 500 ng/kg per day CIV from days 7 to 28 (cycle 1), with subsequent additional 28-day cycles not requiring a LID phase, and was used in the expansion phase of the study.
The primary objective was to determine the MTD and schedule of flotetuzumab and to characterize its DLTs. Secondary objectives included characterization of the PK and pharmacodynamic profile and clinical activity of flotetuzumab. Eligible patients were diagnosed with nonpromyelocytic, R/R AML (according to World Health Organization [WHO] criteria) unlikely to benefit from cytotoxic chemotherapy defined as (a) refractory to ≥2 induction attempts (PIF); (b) first relapse with an initial CR duration <6 months (ER); (c) first relapse following an unsuccessful salvage attempt; (d) second relapse or higher; or (e) prior failure of hypomethylating agents (HMAs), defined as no evidence of response following a minimum of 4 cycles. Late relapse (LR) was defined as patients who achieved remission lasting ≥6 months following prior therapy. Documentation of CD123 expression was not required for study inclusion. Details on study design and participants, including inclusion/exclusion criteria, study assessments, safety and efficacy criteria, and gene-expression profiling are provided in the supplemental Appendix and in previous publications.9,22
Study assessments
Results are analyzed for 3 populations: PK, safety, and response-evaluable. The PK population includes all patients who received flotetuzumab and provided at least 1 quantifiable flotetuzumab concentration value. The population of patients for the assessment of safety included all AML patients who received at least 1 dose of flotetuzumab in any portion of the study. The primary safety analysis is based on pooled analysis of all diagnoses and dosing cohorts. Safety was also summarized for AML patients in the dose-expansion phase treated at the RP2D of 500 ng/kg per day, and for patients treated at RP2D who fit the criteria of PIF/ER. The response-evaluable population includes all AML patients who received at least 1 dose of flotetuzumab in any portion of the study, had baseline bone marrow (BM) assessment, and had at least 1 postbaseline disease response assessment or discontinued treatment due to documented disease progression or death.
Disease status was assessed by modified International Working Group (IWG) criteria.23 Complete response was defined as CR, CRh, CRi, or MLFS at the end of cycle 1. Partial responses (PRs) were defined as >50% decrease in BM blasts from baseline to 5% to 25% at the end of cycle 1. Thus, if the pretreatment BM blast percentage was 50% to 100%, the percentage of blasts must decrease to a value between 5% and 25%; if the pretreatment BM blast percentage was 20% to <49%, the percentage of blasts must decrease by at least half to a value of >5%.
Within the response-evaluable population, subgroup analyses were conducted based on disease status at study entry: PIF, ER (CR <6 months), and LR (CR >6 months); number of lines of prior therapy (2, 3, 4, >4); age (≤70 years, >70 years); primary vs secondary AML (treatment-related or history of antecedent hematological malignancy); and 2017 European LeukemiaNet (ELN) risk classification.2
Statistical methods
Population PK (nonlinear mixed effects) modeling was used to evaluate flotetuzumab PK. Logistic regression was used to describe the relationship between flotetuzumab exposure (predicted mean cycle 1 concentration [Cmean]) and probability of complete response. The rates of survival function estimates at 6 months and 1 year were also calculated. Binary logistic regression was used to ascertain the relative contribution of immune subtypes and other pretreatment covariates toward the predicted likelihood of antileukemic activity of flotetuzumab. A 2-sided P value < .05 was considered to reflect statistically significant differences.
Results
Patient characteristics
Eighty-eight AML patients were enrolled as of 1 November 2019: 42 in the dose-escalation/dose-finding segment, including 4 patients treated at the RP2D, and 46 in the RP2D expansion phase (Table 1). Of the 50 patients treated at RP2D, 30 (60%) met criteria for PIF, of whom 24 of 30 (80%) were refractory to ≥2 induction attempts and 6 of 30 (20%) were ER. The majority of PIF/ER patients (18 of 30; 60%) had adverse risk by ELN 2017 criteria and 12 of 30 (40%) had secondary AML. Patients were heavily pretreated, with a median of 4 lines of prior therapy (range, 1-9 lines). The distribution of flotetuzumab cycles received is summarized in supplemental Table 2.
Baseline characteristics of AML patients in dose escalation, RP2D, and PIF/ER subgroup analyses
| Characteristic | Dose escalation, N = 42 | RP2D population, N = 50 | RP2D PIF/ER, N = 30* |
|---|---|---|---|
| Age, median (range), y | 64 (29, 84) | 64 (27, 82) | 59 (27, 74) |
| Sex, female, n (%) | 18 (42.9) | 19 (38.0) | 10 (33.3) |
| AML status at entry, n (%) | |||
| Primary refractory, ≥2 induction attempts | 15 (35.7) | 24 (48.0) | 24 (80.0) |
| Early relapse, CR duration ≤6 mo | 8 (19.0) | 6 (12.0) | 6 (20.0) |
| AML risk stratification, ELN 2017, n (%) | |||
| Adverse | 13 (31.0) | 26 (52.0) | 18 (60.0) |
| Intermediate | 8 (19.0) | 12 (24.0) | 7 (23.3) |
| Favorable | 10 (23.8) | 6 (12.0) | 5 (16.7) |
| Secondary AML, n (%) | 10/42 (23.8) | 16/50 (32.0) | 12/30 (40) |
| No. of prior lines of therapy, median (range) | 2 (0, 9) | 3 (1, 9) | 4 (1, 9) |
| Failed induction therapy, n (%) | |||
| Cytarabine-based induction chemotherapy | N/A | N/A | 21 (70) |
| Alternative induction therapy | N/A | N/A | 3 (10) |
| ER, <6 mo | |||
| n (%) | 4 (9.5) | 6 (12) | 6 (20) |
| Median duration of CR (range), mo | N/A | 1.6 (0.8-5.1) | 1.6 (0.8-5.1) |
| BM blasts at time of study enrollment, median (range), % | 40 (2-98) | 46 (5-94) | 41 (5-94) |
| Baseline WBC, median (range), ×109/L | 2 (0.4-29.7) | 1.95 (0.3-67) | 2.35 (0.4-16.2) |
N/A, not applicable; WBC, white blood cell.
A subset of the RP2D patient population.
PK and dose-response analysis
Flotetuzumab PK is linear and is described by a 2-compartment model, albeit with interindividual and interoccasion variability (supplemental Table 3). Anti-drug antibodies, which were measured on day 1 preinfusion (cycle 1), on day 1 preinfusion or prior to dose change, as applicable, during subsequent cycles and at the end of the treatment visit, were detected in only 1 of 88 subjects initially enrolled (0.9%), indicating little, if any, immunogenicity of flotetuzumab. Flotetuzumab exposure was optimal at 500 ng/kg per day (supplemental Figure 2A), with a higher nominal dose of 700 ng/kg per day resulting in actual lower exposure due to dose reductions or interruptions to mitigate incidence and severity of infusion-related reaction (IRR)/CRS, which were graded as recommended by Lee and coworkers.24 Consistent with this observation, dose intensity decreased in the 700 ng/kg per day cohort compared with the 500 ng/kg per day cohort (supplemental Figure 2B-D).
Safety
In the primary safety analysis (n = 88), irrespective of dose, the most common treatment-emergent AEs were IRR/CRS. Non-IRR/CRS treatment-emergent AEs included peripheral edema (40.9%) and nausea (30.7%). The most common non-IRR/CRS treatment-emergent AEs of grade 3 or higher were cytopenias including anemia (28.4%), decreased platelets (20.5%), and lymphocytes and leukocytes (18.2%). The most prominent nonhematologic treatment-emergent AEs of grade 3 or higher included hypophosphatemia (14.8%) and hypokalemia (13.6%). IRR/CRS was the predominant treatment-related AE (TRAE) observed. The most common non-IRR/CRS treatment-related AEs of grade 3 or higher (>10%) were cytopenias including decreased platelets (12.5%), lymphocytes, neutrophils, and total white blood cell count (10.2%; Table 2). Seventy-seven percent of the patients (68 of 88) were neutropenic at baseline (absolute neutrophil count [ANC] <1.0 × 10³/μL. The median ANC and platelet count at baseline were 0.27 × 10³/μL (range, 0 to 12 × 103/μL) and 36 × 103/μL (range, 2 × 10³/μL to 452 × 103/μL), respectively. Fourteen treatment-emergent AEs of neutropenia were reported in 3 of 88 patients (3.4%). Four events in 1 patient were deemed to be possibly related to flotetuzumab administration. Most prominent nonhematologic treatment-related events of grade 3 or higher included transient dyspnea (6.0%), myalgias (4.0%), C-reactive protein increase (4.0%), and alanine transaminase increase (4.0%).
TRAEs, all and of grade 3 or higher, occurring in more than 10% of the overall population
| TRAEs | Dose escalation, n = 42 | Dose expansion RP2D population, n = 50* | PIF/ER population, n = 30† | |||
|---|---|---|---|---|---|---|
| All, n (%) | Grade ≥3, n (%) | All, n (%) | Grade ≥3, n (%) | All, n (%) | Grade ≥3, n (%) | |
| IRR/CRS | 34 (81.0) | 3 (7.1) | 48 (96.0) | 4 (8.0) | 30 (100) | 1 (3.3) |
| Nausea | 11 (26.2) | — | 14 (28.0) | — | 8 (26.7) | — |
| Fatigue | 8 (19.0) | 6 (12.0) | 1 (2.0) | 3 (10.0) | 1 (3.3) | |
| Pyrexia | 8 (19.0) | 2 (4.8) | 11 (22.0) | 6 (20.0) | ||
| Peripheral edema | 6 (14.3) | 15 (30.0) | 1 (2.0) | 8 (26.7) | ||
| Alanine aminotransferase increased | 5 (11.9) | 1 (2.4) | 7 (14.0) | 2 (4.0) | 3 (10.0) | 1 (3.3) |
| Arthralgia | 5 (11.9) | 1 (2.4) | 7 (14.0) | 1 (2.0) | 4 (13.3) | |
| C-reactive protein increased | — | — | 6 (12.0) | 2 (4.0) | — | — |
| Diarrhea | — | — | 11 (22.0) | — | 5 (16.7) | — |
| Hypotension | — | — | 8 (16.0) | — | 4 (13.3) | — |
| Decreased appetite | — | — | 6 (12.0) | 1 (2.0) | 5 (16.7) | 1 (3.3) |
| Tachycardia | — | — | 6 (12.0) | 1 (2.0) | — | — |
| Myalgia | — | — | 8 (16.0) | 2 (4.0) | 4 (13.3) | — |
| Dyspnea | — | — | 9 (18.0) | 3 (6.0) | 4 (13.3) | 2 (6.7) |
| Platelet count decreased | 7 (16.7) | 5 (11.9) | 7 (14.0) | 6 (12.0) | 3 (10.0) | 3 (10.0) |
| Lymphocyte count decreased | 6 (14.3) | 5 (11.9) | 6 (12.0) | 4 (8.0) | ||
| Neutrophil count decreased | 1 (2.4) | 1 (2.4) | 2 (4.0) | 2 (4.0) | 2 (6.7) | 2 (6.7) |
| Treatment-related | 0 | 0 | 1 (2.0) | 1 (2.0) | 1 (3.3) | 1 (3.3) |
| Non–treatment-related | 1 (2.4) | 1 (2.4) | 1 (2.0) | 1 (2.0) | 1 (3.3) | 1 (3.3) |
Includes 46 patients treated in expansion cohort and 4 patients treated in dose escalation.
A subset of the RP2D patient population.
Three DLTs were observed among 8 AML patients receiving the highest dose (700 ng/kg per day) administered (1 event of grade 3 delirium, 1 event of grade 3 acute confusional state, and 1 event of grade 3 CRS). The MTD and RP2D were thus defined as 500 ng/kg per day administered continuously following a step-up LID during cycle 1 week 1.
In RP2D-treated patients in dose expansion (n = 50), the most commonly observed treatment-related events were IRR/CRS (96.0%) and nausea (26%). The most common treatment-related events of grade 3 or higher (>10%) in the RP2D population included anemia, decreased lymphocyte, white blood cell, and platelet counts (14.0%; Table 2). The most commonly observed treatment-emergent AEs were comparable to the overall patient population, with IRR/CRS being the most common treatment-emergent AEs and cytopenias being the most common treatment-emergent AEs of grade 3 or higher.
Neurologic AEs have been infrequent, with the most prominent event being grade 1 or grade 2 headache in 10% (5 of 50) treated at the RP2D. Two grade 3 neurologic AEs were reported: 1 headache and 1 episode of delirium; both were of short duration (1-4 days) and fully reversible with no clinical sequelae.
IRR/CRS
Of the patients with IRR/CRS, the majority (71 of 88; 81%) had mild to moderate signs/symptoms. Seven patients (8%) experienced grade 3 events; no grade 4/5 events were observed. A single episode of grade 3 IRR/CRS was observed in each of 4 patients (4 of 50; 8%) treated at the RP2D. Most IRR/CRS events (32%) occurred in the first week of treatment during step-up dosing and their incidence decreased each week during continuous dosing at 500 ng/kg per day (27% in week 2, 11% in week 3, and 7% in week 4). IRR/CRS events decreased with ongoing treatment, irrespective of dose and LID scheme (supplemental Table 4).
Mitigation of IRR/CRS
Strategies used to mitigate the incidence and severity of IRR/CRS included: step-up LID schedules (supplemental Table 1), temporary dose reduction or interruption (supplemental Table 5), and the prompt use of tocilizumab. Optimal CRS mitigation was achieved through the implementation of gradual step-up in dose through an MS-LID, which not only decreased the severity of IRR/CRS in the RP2D population but also improved mean dose intensity by minimizing dose reductions and interruptions (Figure 1B-D). The median duration of drug interruptions for IRR/CRS was 7.2 hours (range, 0.2-129 hours; n = 102 events overall).
Of the 78 doses of tocilizumab administered in 40 patients, 25 doses (32%) were given for grade 1 IRR/CRS in 14 patients, 51 doses (65%) for grade 2 IRR/CRS in 29 patients, and 2 doses (3%) for grade 3 IRR/CRS in 2 patients. Although tocilizumab use was recommended, some investigators opted not to use the drug promptly due to evidence of resolving CRS within 2 hours, as indicated in the guidelines for management of IRR/CRS (supplemental Table 5). A detailed comparison between patients who did and did not receive tocilizumab only for CRS management is shown in supplemental Table 6. Tocilizumab usage was associated with a decreased duration of IRR/CRS events with an average of 1.3 days (range, 1-3 days) vs 1.8 days (range, 1-5 days; P = .0202; Figure 1E). Consistent with previous observations and its mechanism of action, higher levels of IL-6 were observed for up to 6 days in tocilizumab-treated patients.
Fifty-three of 88 patients (60%) experienced IRR/CRS events that led to dose interruption, including 31 of 50 patients (62%) who received flotetuzumab at the RP2D. Most IRR/CRS events that resulted in dose interruptions in the RP2D population occurred in the first week of treatment, with fewer dose interruptions beyond the second week after reaching the target drug dose. Fewer dose adjustments were necessary with MS-LID than the 2-step LID (dose interruptions: 35% vs 67%; dose reductions: 69% vs 95%), contributing to the higher dose intensity observed with MS-LID. Notably, there were no grade 3 IRR/CRS events with MS-LID compared with 11% patients treated with 2-step LID who experienced grade 3 IRR/CRS. A total of 12 patients, 8 at the RP2D, received a total of 19 doses (median of 1 dose [range, 1-3]) of corticosteroids for the treatment of CRS, 2 for grade 1 events, 10 for grade 2 events, and 1 for a grade 3 event.
Myelosuppression
Preclinical data suggest that effective targeting of CD123+ cells may lead to profound myelosuppression.25 However, flotetuzumab, at concentrations equivalent to maximal (peak) concentration levels at 500 ng/kg per day, had minimal in vitro effect on normal hematopoietic stem cells, megakaryocyte erythroid progenitors, granulocyte-myeloid progenitors, or common myeloid progenitors (supplemental Figure 3), consistent with previous in vivo reports in cynomolgus monkeys.21 In line with these preclinical data, we observed that 57% and 67% of patients who achieved response of CR or CRh, respectively, experienced recovery of peripheral blood counts even with continued flotetuzumab treatment (supplemental Tables 7 and 8), suggesting that flotetuzumab as dosed in this study does not result in significant and prolonged suppression of normal hematopoiesis.
DLTs and recommended phase 2 dose and schema
Three DLTs (grade 3 delirium, grade 3 acute confusion, grade 3 CRS) were observed among 8 AML patients receiving the highest dose administered (700 ng/kg per day), whereas a dose of 500 ng/kg per day demonstrated manageable safety, with no DLTs observed among 13 patients treated during dose escalation. The RP2D-dosing schema was defined as 500 ng/kg per day administered by continuous infusion following step-up LID during first week of cycle 1 (detailed in Figure 1A).
Clinical efficacy
Response in patients with PIF and ER AML
Of 88 AML subjects enrolled to receive any dose of flotetuzumab, 9 patients (10%) discontinued treatment within the first 2 weeks of treatment initiation, 2 patients withdrew consent, and 7 patients were withdrawn for non-TRAE (supplemental Table 9). The rate of CR or CRh was 11.7% (10 of 88), with an overall response rate (ORR; CR, CRh, CRi) of 13.6% (12 of 88). Circulating and BM blast reductions were noted at all doses tested; however, complete responses were observed among patients treated at the RP2D of 500 ng/kg per day (n = 50) or higher. At the RP2D, a CR/CRh rate of 18% (9 of 50) and an ORR of 24% (12 of 50) were documented (Figure 2A; Table 3). Furthermore, subgroup analysis of evaluable patients based on AML status at study entry showed increased flotetuzumab activity (≥50% BM blast reduction) in PIF/ER (43%; 12 of 28) as compared with LR (14%; 1 of 7), or HMA failure (30%; 3 of 10) (Figure 2A; Table 3; supplemental Figure 4). This observation is consistent with an increased probability of response to immunotherapy in patients with infiltrated/inflamed TME,9 a biomarker coincidental with the PIF/ER AML subgroup (see "Biomarkers of response" and Figure 4). Indeed, with the exception of a single CR in a patient who failed HMA, all remaining 9 clinical responses (5, 3, and 1 CR, CRh and CRi, respectively, 30% ORR) occurred among the 30 patients who met criteria for PIF (n = 24) or ER (n = 6), whereas no responses were seen in 12 LR patients. Within the evaluable patients in the PIF/ER subgroup, ORR was 28.6% (8 of 28) for patients with nonfavorable risk by ELN 2017 criteria (6 of 19 in patients with adverse risk and 2 of 7 in patients with intermediate risk), and 40.0% (4 of 10) for secondary AML. Notably, more limited exposure to prior therapies was associated with greater likelihood of response to flotetuzumab, with an ORR of 56% (5 of 9) among patients with 2 lines of prior treatment as compared with an ORR of 0% among 7 patients with ≥5 lines of prior therapy (supplemental Table 10). Although there was no relation between IRR/CRS severity and efficacy, the latter was associated with incidence of IRR/CRS events (Figure 3). In line with previously published data,26 CRS severity did not correlate with disease burden (absolute AML blasts, percentage of CD123 AML blasts), CD123 expression on AML blasts, monocyte levels, or effector-to-target ratio in the peripheral blood. However, the frequency of circulating CD4+ T cells was significantly higher at baseline in patients who experienced grade 2 or higher CRS compared with grade 1 CRS (median of 73% compared with median of 47%, respectively; P = .0082). Response rate in post-HMA–treated patients was 10.0% (1 of 10), with a very short duration of response.
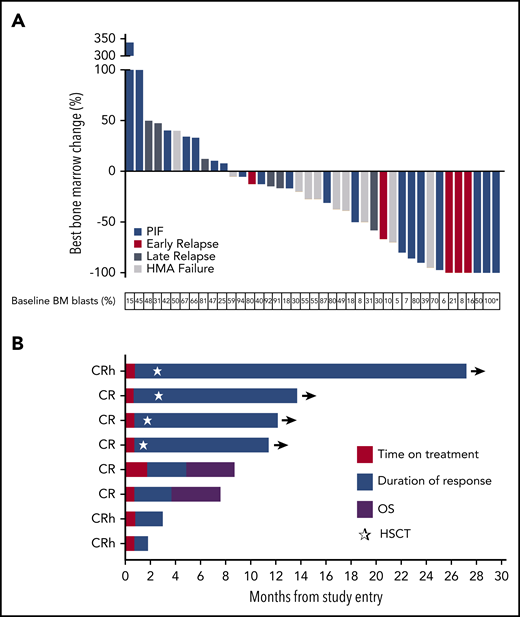
Best change in BM blasts, duration of remission, and OS in patients receiving flotetuzumab immunotherapy. (A) Fifty patients treated at the RP2D differentiated by AML status at study entry: 45 response-evaluable, 40 patients in waterfall plot, 5 progressive disease (PD) on peripheral blood blasts; nonevaluable patients, 5: 2 patients withdrew consent, 3 patients withdrawn due to non-TRAEs. AML status at study entry and percentage of BM blasts at baseline are indicated. (B) Eight PIF/ER AML patients treated at RP2D who achieved a response on flotetuzumab. Median time to best response represented in red (median, 0.8 months; range, 0.8-2.1 months) and duration of response in blue (median, 9.1 months; range, 1.1-26.4 months). Purple depicts OS beyond relapse. *BM aspirate for this patient was hemodiluted but immunohistochemistry on BM formalin-fixed paraffin embedded confirmed the percent blast. ☆, Time at which patients underwent hematopoietic stem cell transplantation (HSCT).
Best change in BM blasts, duration of remission, and OS in patients receiving flotetuzumab immunotherapy. (A) Fifty patients treated at the RP2D differentiated by AML status at study entry: 45 response-evaluable, 40 patients in waterfall plot, 5 progressive disease (PD) on peripheral blood blasts; nonevaluable patients, 5: 2 patients withdrew consent, 3 patients withdrawn due to non-TRAEs. AML status at study entry and percentage of BM blasts at baseline are indicated. (B) Eight PIF/ER AML patients treated at RP2D who achieved a response on flotetuzumab. Median time to best response represented in red (median, 0.8 months; range, 0.8-2.1 months) and duration of response in blue (median, 9.1 months; range, 1.1-26.4 months). Purple depicts OS beyond relapse. *BM aspirate for this patient was hemodiluted but immunohistochemistry on BM formalin-fixed paraffin embedded confirmed the percent blast. ☆, Time at which patients underwent hematopoietic stem cell transplantation (HSCT).
Response rate in R/R and PIF and ER AML
| R/R AML, % (n) n = 50 | PIF/ER AML, % (n) n = 30 | |
|---|---|---|
| CR | 12.0 (6) | 16.7 (5) |
| CR/CRh | 18.0 (9) | 26.7 (8) |
| CR/CRh/CRi | 20.0 (10) | 30.0 (9) |
| CR/CRh/CRi/MLFS/PR | 24.0 (12) | 30.0 (9) |
| R/R AML, % (n) n = 50 | PIF/ER AML, % (n) n = 30 | |
|---|---|---|
| CR | 12.0 (6) | 16.7 (5) |
| CR/CRh | 18.0 (9) | 26.7 (8) |
| CR/CRh/CRi | 20.0 (10) | 30.0 (9) |
| CR/CRh/CRi/MLFS/PR | 24.0 (12) | 30.0 (9) |
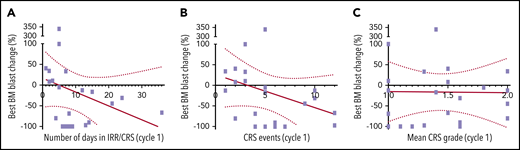
Relation between CRS and antileukemic activity. (A) Relation between BM blast change and number of days patient experienced CRS during cycle 1. (B) Relation between BM blast change and number of CRS events during cycle 1. (C) Relation between BM blast change and CRS severity (mean grade for all events per patient) during cycle 1. Simple regression is shown as red line; dotted lines depict 95% CI.
Relation between CRS and antileukemic activity. (A) Relation between BM blast change and number of days patient experienced CRS during cycle 1. (B) Relation between BM blast change and number of CRS events during cycle 1. (C) Relation between BM blast change and CRS severity (mean grade for all events per patient) during cycle 1. Simple regression is shown as red line; dotted lines depict 95% CI.
Time to response, duration of response, and survival
Among RP2D patients, median follow-up on study was 0.8 months (range, 0-25 months), median time-to-first response was 0.84 months (range, 0.8-2.1 months), and median overall survival (OS) was 3.2 months (95% confidence interval [CI], 2.10-6.47). For PIF/ER patients, 6- and 12-month survival rates for PIF/ER (n = 30) were 42% (0.237, 0.596) and 20% (0.025, 0.377), respectively. Patients achieving CR/CRh had a median duration of response of 6.9 months (range, 1.1-26.4 months). Four of 8 patients that attained a complete response underwent hematopoietic cell transplantation, 3 in CR and 1 in CRh (Figure 2B). Median OS was 11.2 months (95% CI, 1.87 to not reached), and 6- and 12-month survival rates were 75% (95% CI, 0.450-1) and 50% (95% CI, 0.154-0.846), respectively.
Biomarkers of response
To identify potential predictors of response, several biomarkers were captured during the study and retrospectively analyzed. CD123 expression and receptor density on AML blasts were measured by quantitative flow cytometry. CD123 receptor density was higher in patients with PIF/ER compared with LR (P = .0283; supplemental Figure 5A). However, no association between CD123 expression and response to flotetuzumab was observed (supplemental Figure 5B-C). Interestingly, in silico (GSE134589)9 analyses showed that CD123 expression correlated positively with ELN risk category (supplemental Figure 6A), and with the expression of inflammatory chemokine genes (P = .029) and IFN-γ (P = .03; data not shown), and that higher CD123 mRNA was associated with PIF and ER in newly diagnosed AML (supplemental Figure 6B).
Immune gene-signature scores, which were computed as previously published,9,27 were analyzed in a subgroup of 38 flotetuzumab-treated patients (Figure 4A). As anticipated based on previous findings,9 patients with PIF/ER showed higher immune infiltration relative to LR patients (Figure 4A). Evidence of complete response from flotetuzumab, defined as achieving either CR, CRh or CRi, was documented in 21%, 44.4%, and 60% of patients with low, intermediate, and high immune infiltration, respectively (Figure 4A; supplemental Figure 7). Responses were not correlated with the patient’s molecular profile, as shown in Figure 4B. Inflammatory chemokine and tumor inflammation signature (TIS) scores were higher in PIF/ER patients compared with LR patients (Figure 4C). Furthermore, unsupervised hierarchical clustering of the expression of 770 immune-related genes in baseline BM samples showed evidence of complete response from flotetuzumab in 26.1%, 33.3%, and 66.6% of patients with low, intermediate and high immune infiltration, respectively (Figure 5A). By ranking the genes in the panel, we identified a parsimonious expression signature encompassing the top 10 genes associated with complete response to flotetuzumab (Figure 5B). The expression of the 10-gene classifier, which was computed as the average sum of gene expression across the patient cohort, was higher in patients with heightened levels of BM immune infiltration (Figure 5B; immune clusters defined as detailed in Figure 4A and in previous publications9 ), including neutrophils, macrophages, and myeloid cell types, and with inflammatory chemokines and other gene-signature scores that reflect a T-cell–inflamed, IFN-γ–driven TME, such as the TIS score (Figure 5C). The latter correlated with the antigen-processing machinery and inflammatory chemokine scores (P < .0001), suggesting the occurrence of antigen presentation and T-cell chemoattraction in highly T-cell–inflamed samples. The analysis of functional protein association networks revealed that the 10 genes associated with complete response were enriched in ontologies and pathways related to antigen binding and processing, vascular endothelial growth factor–activated receptor activity, Notch signaling, micro-RNA regulation in cancer and T helper type 1 (Th1) and Th2 differentiation (Figure 5D; supplemental Table 11). The ability of the unfavorable ELN risk category (adverse and intermediate) and the novel 10-gene signature score to predict complete response from flotetuzumab, either individually or in combination, is summarized in Figure 5E. Notably, the 10-gene signature score had an area under the receiver operating characteristic curve (AUROC) value of 0.854 when considered alone and of 0.904 when in conjunction with the ELN risk category, compared with 0.672 for the ELN risk category alone (supplemental Table 12).
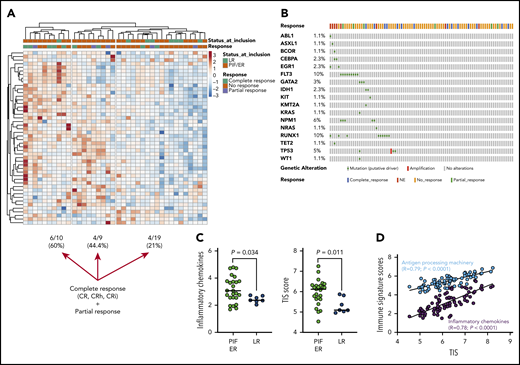
The TME in patients receiving flotetuzumab immunotherapy. (A) Unsupervised hierarchical clustering (Euclidean distance, complete linkage) of immune cell type–specific scores and biological activity scores in baseline BM samples from 38 patients with R/R AML treated with flotetuzumab immunotherapy (color-coded per the legend). ClustVis, an online tool for clustering of multivariate data, was used for data analysis and visualization.40 The immune landscape from 29 of the 38 patients in this cohort has been presented in a previous publication.9 (B) OncoPrint plot summarizing the molecular profile of patients receiving flotetuzumab immunotherapy. The plot was generated using cBioPortal for Cancer Genomics (https://www.cbioportal.org/). (C) Inflammatory chemokine score and tumor-inflammation signature (TIS) score in baseline BM samples from patients with R/R AML. PIF, n = 25; LR AML, n = 7; HMAs, n = 6. Data were compared using the Kruskal-Wallis (KW) test for unpaired determinations. (D) Correlation between the TIS score and antigen processing machinery and inflammatory chemokine scores in baseline BM samples from patients with R/R AML. Spearman rank correlation coefficients and P values are shown. NE, not evaluable.
The TME in patients receiving flotetuzumab immunotherapy. (A) Unsupervised hierarchical clustering (Euclidean distance, complete linkage) of immune cell type–specific scores and biological activity scores in baseline BM samples from 38 patients with R/R AML treated with flotetuzumab immunotherapy (color-coded per the legend). ClustVis, an online tool for clustering of multivariate data, was used for data analysis and visualization.40 The immune landscape from 29 of the 38 patients in this cohort has been presented in a previous publication.9 (B) OncoPrint plot summarizing the molecular profile of patients receiving flotetuzumab immunotherapy. The plot was generated using cBioPortal for Cancer Genomics (https://www.cbioportal.org/). (C) Inflammatory chemokine score and tumor-inflammation signature (TIS) score in baseline BM samples from patients with R/R AML. PIF, n = 25; LR AML, n = 7; HMAs, n = 6. Data were compared using the Kruskal-Wallis (KW) test for unpaired determinations. (D) Correlation between the TIS score and antigen processing machinery and inflammatory chemokine scores in baseline BM samples from patients with R/R AML. Spearman rank correlation coefficients and P values are shown. NE, not evaluable.
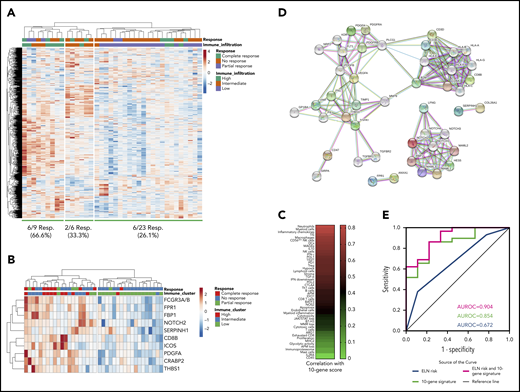
The TME in patients receiving flotetuzumab immunotherapy. (A) Unsupervised hierarchical clustering (Euclidean distance, complete linkage) of immune gene expression (n = 770 genes in the NanoString’s PanCancer IO360 panel) in baseline BM samples from 38 patients with R/R AML treated with flotetuzumab immunotherapy (color-coded per the legend). Complete responses were defined as either CR, CRh, CRi, or MLFS at the end of cycle 1. PRs were defined as >50% decrease in BM blasts from baseline or decrease to 5% to 25% BM blasts at the end of cycle 1. ClustVis, an online tool for clustering of multivariate data, was used for data analysis and visualization.40 (B) Expression of the top 10 genes associated with complete response to flotetuzumab (CR, CRh, CRi). A ranked gene list (χ2 values) was generated using the Orange3 software package (version 3.25.0). Unsupervised hierarchical clustering (Euclidean distance, complete linkage). The immune cluster was defined as previously detailed.9 (C) Heatmap summarizing the correlation coefficients (color-coded per the legend) between our 10-gene signature score and immune cell type–specific and biological activity signature scores in baseline BM samples from patients with R/R AML. (D) Analysis of functional protein association networks using STRING (https://string-db.org/). Top 20 molecules interacting with the top 10 genes in our signature are shown together with their predicted mode of action (highest confidence interaction scores > 0.900). Network nodes (query proteins) represent proteins produced by a single protein-coding gene locus. White nodes represent second shells of interactors. Empty and filled nodes indicate proteins of unknown or partially known 3-dimensional structure, respectively. Edges represent protein-protein associations. Line shapes denote predicted modes of action. (E) AUROC curve measuring the predictive ability of the 10-gene signature score for antileukemic activity from flotetuzumab. Standard errors and confidence intervals are provided in supplemental Table 11. AUROC = 1.0, perfect prediction; AUROC = 0.5, no predictive ability.
The TME in patients receiving flotetuzumab immunotherapy. (A) Unsupervised hierarchical clustering (Euclidean distance, complete linkage) of immune gene expression (n = 770 genes in the NanoString’s PanCancer IO360 panel) in baseline BM samples from 38 patients with R/R AML treated with flotetuzumab immunotherapy (color-coded per the legend). Complete responses were defined as either CR, CRh, CRi, or MLFS at the end of cycle 1. PRs were defined as >50% decrease in BM blasts from baseline or decrease to 5% to 25% BM blasts at the end of cycle 1. ClustVis, an online tool for clustering of multivariate data, was used for data analysis and visualization.40 (B) Expression of the top 10 genes associated with complete response to flotetuzumab (CR, CRh, CRi). A ranked gene list (χ2 values) was generated using the Orange3 software package (version 3.25.0). Unsupervised hierarchical clustering (Euclidean distance, complete linkage). The immune cluster was defined as previously detailed.9 (C) Heatmap summarizing the correlation coefficients (color-coded per the legend) between our 10-gene signature score and immune cell type–specific and biological activity signature scores in baseline BM samples from patients with R/R AML. (D) Analysis of functional protein association networks using STRING (https://string-db.org/). Top 20 molecules interacting with the top 10 genes in our signature are shown together with their predicted mode of action (highest confidence interaction scores > 0.900). Network nodes (query proteins) represent proteins produced by a single protein-coding gene locus. White nodes represent second shells of interactors. Empty and filled nodes indicate proteins of unknown or partially known 3-dimensional structure, respectively. Edges represent protein-protein associations. Line shapes denote predicted modes of action. (E) AUROC curve measuring the predictive ability of the 10-gene signature score for antileukemic activity from flotetuzumab. Standard errors and confidence intervals are provided in supplemental Table 11. AUROC = 1.0, perfect prediction; AUROC = 0.5, no predictive ability.
Discussion
Since its initial description as a putative marker of leukemic stem cells,20,21,28 there has been considerable interest in targeting the CD123 antigen in AML. In this report, we present the clinical results of a CD123-targeted immunotherapy for adults with R/R AML. The optimal target dose was determined to be 500 ng/kg per day after 1-week stepwise dose escalation. Similar to other bispecific antibodies and chimeric antigen receptor (CAR)-T cells, IRR/CRS remain the most frequent and significant AEs observed following treatment with flotetuzumab. The frequency and severity of IRR/CRS may be increased compared with B-cell immunotherapies because of shared target antigen expression on monocytes and macrophages, both of which mediate IL-6 production.29 In a recent study of autologous T cells transduced with a CD19-directed CAR (CTL019) lentiviral vector, severe CRS developed in 27% of the patients treated.30 A subsequent clinical trial of CTL019 has reported a 46% incidence of grade 3-4 CRS in pediatric R/R ALL with a median of 15 organ dysfunction days.31
Stepwise dosing combined with pretreatment dexamethasone, prompt use of tocilizumab, and temporary dose reductions/interruptions were successful strategies in preventing severe IRR/CRS while maintaining dose intensity. Although the short half-life of flotetuzumab requires administration under continuous IV infusion, which can be burdensome for patients and providers, it also affords the ability to manage CRS through fine dosing control before subjects experience severe events. Other approaches to further reduce the severity of IRR/CRS are currently under investigation. Blockade of IL-6 signaling through inhibition of the JAK/STAT pathway with ruxolitinib has been shown to ameliorate CRS in CAR-T murine models32 and is currently being clinically tested in combination with flotetuzumab.
The findings from our first-in-human study with flotetuzumab indicate that this bispecific molecule provides a novel treatment option for PIF/ER AML. The clinical activity of flotetuzumab was primarily observed in patients with PIF/ER, with CR/CRh rates of 27% and ORR of 30%. In PIF/ER AML patients who achieved CR or CRh, the median OS was 10.2 months, with 6- and 12-month survival rates of 75% and 50%, respectively.
The observation that benefit with flotetuzumab accrued to patients with PIF/ER is highly encouraging because these chemotherapy-resistant leukemias have especially poor prognoses and limited treatment options. A retrospective analysis of published literature showed that the response rate to salvage chemotherapy regimens was ∼12% for patients with PIF/ER,33 with subsequent lines of therapy being largely ineffective, and a median OS of only 3 months.34 The observed response of patients with PIF/ER AML to flotetuzumab is consistent with the observation that an immune-infiltrated, IFN-γ–dominant TME identifies patients less likely to respond to cytotoxic chemotherapy but more likely to respond to immunotherapy.9
Beyond this observation, the ability of a parsimonious 10-gene signature to predict complete responses from flotetuzumab further underscores the positive relationship between an immune-infiltrated TME and flotetuzumab’s mechanism of action. Genes in the signature included CD8B, immune checkpoint ICOS and NOTCH2, all of which reflect a T-cell–driven and highly immunosuppressed TME that could be reinvigorated by flotetuzumab. In this respect, increased Notch signaling has been correlated with enhanced CD8 T-cell infiltration in patients with colorectal carcinoma and with inhibited T-cell responses.35 Furthermore, Notch2, but not Notch1 signaling, is critically required for the generation of cytotoxic T lymphocytes with antitumor activity in experimental models of lymphoma and acts as a transcriptional activator of granzyme B.36,37
Network analyses also indicated that antigen binding and processing were among the most enriched pathways associated with the 10 genes in our signature, underpinning the potential contribution of enhanced and sustained antigen presentation in the TME to the antileukemic activity of flotetuzumab. High antigen-presenting machinery scores have been shown to correlate with improved ORRs to anti–programmed cell death protein 1 (PD-1) or anti–programmed cell death ligand 1 (PD-L1) monotherapy in a pooled analysis of 25 distinct solid tumor types.38 In line with reports of PD-L1 induction by IFN-γ in solid tumor cell lines and primary tissues, we have previously observed PD-L1 upregulation of AML blasts incubated with IFN-γ.39 Notably, primary AML blasts expressing high levels of PD-L1 were less susceptible to flotetuzumab-mediated killing in vitro. Furthermore, patients who progressed early (within 2 weeks) on flotetuzumab treatment had higher baseline levels of PD-L1 on AML cells. Interestingly, a number of patients with residual disease on flotetuzumab showed a higher proportion of PD-L1+ AML blasts vs basal levels.39
In the current study, adverse- and intermediate-risk cytogenetics, which would be considered an established negative prognostic factor, acted as a modest predictor of flotetuzumab response. However, the combination of high-risk cytogenetics and the 10-gene score improved the ability to predict response to flotetuzumab.
In conclusion, flotetuzumab represents an innovative experimental approach that has demonstrated acceptable safety and encouraging evidence of activity. Considering that high CD123 expression on AML blasts is also associated with the risk of PIF and with poor prognosis,17 flotetuzumab targeting of CD123 represents an attractive option for these patients. CD123 expression by leukemic stem cells further contributes to the potential therapeutic value of the target.20,21,28 The assessment of minimal residual disease eradication, a prognostic factor for relapse and survival in AML, will be of particular interest in future studies of flotetuzumab. The trial is continuing but focuses on subjects with PIF/ER AML (clinicaltrials.gov NCT02152956).
The data reported in this article have been deposited in the Gene Expression Omnibus database (accession number GSE146204).
The online version of this article contains a data supplement.
The publication costs of this article were defrayed in part by page charge payment. Therefore, and solely to indicate this fact, this article is hereby marked “advertisement” in accordance with 18 USC section 1734.
Acknowledgments
The authors thank Barbara Shepherd for providing medical writing support.
M.P.R. was supported by National Institutes of Health/National Cancer Institute grant R50 CA211466. J.F.D. was supported by National Institutes of Health/National Cancer Institute grants R01 CA152329, P50 CA171963, and R35 CA210084. S.R. was supported by Qatar National Research Fund grant NPRP8-2297-3-494.
Patents: Bispecific CD123 × CD3 Diabodies for the Treatment of Hematologic Malignancies [International Patent Publication No. WO 2020/0942404]. Bi-Specific Diabodies That Are Capable of Binding CD123 and CD3 and Uses Thereof [US Patent No. 9 822 181].
Authorship
Contribution: J.K.D.-M., S.R., and J.F.D. conceived and designed the study; G.L.U., I.A., M.C.F., P.H.S., M.J.W., A.S.A., J.E.G., M.L.A., K.L.S., A.E., F.R., H.P.E., M.B., L.M., M.S.T., N.V., F.C., M.G.C., S.P., G.A.H., M.J.-L., M.W., P.C., E.G., C.R., P.J.S., K.M.P., B.L., M.P.R., R.B.W., and J.F.D. acquired, consented, and managed patients and processed patient samples; G.L.U., I.A., M.C.F., P.H.S., M.J.W., A.S.A., J.E.G., M.L.A., K.L.S., A.E., F.R., H.P.E., M.B., L.M., M.S.T., N.V., F.C., M.G.C., S.P., G.A.H., M.J.-L., M.W., P.C., E.G., C.R., P.J.S., K.M.P., B.L., S.E.C., E.A., J.V., M.S., M.P.R., J.M., T.C., E.F., K.G., J.Z., O.B., K.J., K.T., P.K., M.K., E.B., R.B.W., J.K.D.-M., S.R., and J.F.D. analyzed and interpreted data and reviewed and revised the manuscript; J.K.D.-M. and S.R. contributed to the writing of the manuscript; and J.K.D.-M. supervised the study.
Conflict-of-interest disclosure: J.M., T.C., E.F., K.G., J.Z., O.B., K.J., K.T., P.K., M.K., E.B., and J.K.D.-M. are employees of MacroGenics Inc (Rockville, MD). S.E.C. is an employee of NanoString Technologies Inc (Seattle, WA). The remaining authors declare no competing financial interests.
Correspondence: Sergio Rutella, John van Geest Cancer Research Centre, Nottingham Trent University, Clifton Campus, NG11 8NS Nottingham, United Kingdom; e-mail: sergio.rutella@ntu.ac.uk.

This feature is available to Subscribers Only
Sign In or Create an Account Close Modal