

Key Points
Second CD19 CART2 infusions were feasible and induced responses in 39% of patients (CR, 20%).
Durable responses were observed in NHL and CLL patients treated with an increased CART2 dose and who received Cy-Flu pre-CART1.

Abstract
CD19-targeted chimeric antigen receptor-engineered (CD19 CAR) T-cell therapy has shown significant efficacy for relapsed or refractory (R/R) B-cell malignancies. Yet, CD19 CAR T cells fail to induce durable responses in most patients. Second infusions of CD19 CAR T cells (CART2) have been considered as a possible approach to improve outcomes. We analyzed data from 44 patients with R/R B-cell malignancies (acute lymphoblastic leukemia [ALL], n = 14; chronic lymphocytic leukemia [CLL], n = 9; non-Hodgkin lymphoma [NHL], n = 21) who received CART2 on a phase 1/2 trial (NCT01865617) at our institution. Despite a CART2 dose increase in 82% of patients, we observed a low incidence of severe toxicity after CART2 (grade ≥3 cytokine release syndrome, 9%; grade ≥3 neurotoxicity, 11%). After CART2, complete response (CR) was achieved in 22% of CLL, 19% of NHL, and 21% of ALL patients. The median durations of response after CART2 in CLL, NHL, and ALL patients were 33, 6, and 4 months, respectively. Addition of fludarabine to cyclophosphamide-based lymphodepletion before the first CAR T-cell infusion (CART1) and an increase in the CART2 dose compared with CART1 were independently associated with higher overall response rates and longer progression-free survival after CART2. We observed durable CAR T-cell persistence after CART2 in patients who received cyclophosphamide and fludarabine (Cy-Flu) lymphodepletion before CART1 and a higher CART2 compared with CART1 cell dose. The identification of 2 modifiable pretreatment factors independently associated with better outcomes after CART2 suggests strategies to improve in vivo CAR T-cell kinetics and responses after repeat CAR T-cell infusions, and has implications for the design of trials of novel CAR T-cell products after failure of prior CAR T-cell immunotherapies.
Introduction
CD19-targeted chimeric antigen receptor engineered T cell (CD19 CAR T-cell) therapy can achieve high responses rates in patients with relapsed or refractory (R/R) B acute lymphoblastic leukemia (ALL),1-7 non-Hodgkin lymphoma (NHL),8-14 and chronic lymphocytic leukemia (CLL).15-18 Despite these encouraging results, CD19 CAR T-cell immunotherapy does not lead to complete or durable responses in most patients. Specifically, the median event-free survival after CD19 CAR T-cell therapy in ALL, NHL, and CLL patients has been estimated at 6 to 12 months,2,4,19 3 to 6 months,10,11,13 and 3 to 12 months,15,18,20 respectively (all infused patients). Poor outcomes have been reported in NHL patients with progressive disease after CD19 CAR T-cell therapy,21 a situation in which therapeutic options are scarce. In patients needing subsequent therapy after failure of a first CAR T-cell infusion (CART1), 1 option is retreatment with a second infusion of CD19 CAR T cells (CART2). However, the feasibility and efficacy of CART2 are unknown. Mechanisms of CAR T-cell therapy failure are incompletely understood and potentially manifold; they may involve poor T-cell function, an immunosuppressive tumor microenvironment, and the loss of expression of the targeted antigen. Data from our group1,8 and others22 also suggested CD19 CAR T-cell efficacy could be blunted by anti-CAR immune responses primed in response to CART1.
Here, we analyzed outcomes after CART2 in R/R ALL, NHL, and CLL patients treated on a phase 1/2 clinical trial of CD19 CAR T cells of defined composition. We established that CART2 was well tolerated and that more durable responses could be achieved in a subset of patients. We identified factors associated with response, progression-free survival (PFS), and in vivo CAR T-cell expansion after CART2.
Patients and methods
Study design and patient selection
We analyzed the outcomes of patients enrolled on a phase 1/2 clinical trial (NCT01865617) at our institution who received CART2 for treatment of R/R B-cell malignancies after CART1. The study was conducted with informed consent and approval of the Fred Hutchinson Cancer Research Center Institutional Review Board. Patients enrolled in either stage of the study were eligible to receive CART2 with or without additional lymphodepletion chemotherapy at the same (for those who received the highest cell dose), or up to the next highest dose level if adequate CD19 CAR T cells could be produced, and the following criteria were met: 1) evidence of persistent/relapsed disease ≥21 days after CART1; 2) no toxicities attributed to CART1 that were dose- limiting or required dose de-escalation; and 3) no clinical and/or laboratory exclusion criteria.
Lymphodepletion regimens and CAR T-cell dose
Lymphodepletion regimens prior to CART1 and CART2 are shown in supplemental Table 1, available on the Blood Web site. CART1 were administered at 2 × 10⁵/kg, 2 × 10⁶/kg, or 2 × 10⁷/kg, while CART2 were administered at 2 × 10⁶/kg or 2 × 10⁷/kg. Six patients received a cell dose of 2 × 10⁶/kg for both CART1 and CART2, because a dose of 2 × 10⁷ CAR T cells/kg could not be achieved for CART2.
Clinical response and toxicity assessment
Responses after CAR T-cell therapy were evaluated first around day 28 after infusion and subsequently as clinically indicated. Responses were defined according to the 2019 National Comprehensive Cancer Network guidelines for ALL,23 2018 International Workshop on CLL for CLL,24 and the 2014 Lugano criteria for NHL.25 In patients with bone marrow involvement prior to CART2, minimal residual disease (MRD) in the marrow was assessed 4 weeks after CAR T-cell infusion using multiparameter flow cytometry (sensitivity, 10−4)26,27 and IGH sequencing (sensitivity, 10−6; clonoSEQ, Adaptive Biotechnologies, Seattle, WA),27 as clinically appropriate. Cytokine release syndrome (CRS) was graded per protocol according to 2014 consensus criteria.28 Treatment with tocilizumab and dexamethasone was recommended for patients developing grade ≥3 CRS or grade 2 CRS with progressive signs. Other toxicities, including neurologic toxicity, were graded using the National Cancer Institute Common Toxicity Criteria for Adverse Events (CTCAE version 4.03). Toxicity rates were evaluated in all infused patients.
Statistical analyses
Comparisons of continuous variables between 2 categories were made using the Wilcoxon rank sum test, and of categorical variables between 2 categories using Fisher’s exact test. All P values are 2-sided and were not corrected for multiplicity. For time-to-event analyses, the Kaplan-Meier method was used to estimate survival distributions, and the reverse Kaplan-Meier estimator method was used to estimate median follow-up time, as described.29 For analysis of PFS, an event was defined as no response, relapse or disease progression, or death. Death was the event for analysis of overall survival (OS). Patients who did not have an event were censored at the date of last follow up. Data were not censored at the time of initiation of new therapy, including allogeneic HCT, in the absence of disease progression. Duration of response was defined as PFS in patients whose best response was complete response (CR) or partial response (PR) after CART2. CAR T-cell persistence was estimated using nonparametric polynomial regression using the locally estimated scatterplot smoothing (LOESS) approach, and time to CAR T-cell loss was defined as the time from CAR T-cell infusion to a predicted CAR transgene copy value <10 copies/μg DNA (limit of quantitation of the assay).
Logistic, Cox, and linear regression were used for multivariable analyses of response, PFS, and peak CAR T-cell in vivo expansion in blood by quantitative polymerase chain reaction (qPCR), respectively. Multivariable regression models were specified using Bayesian model averaging (BMA) as described by Raftery et al.30 BMA accounts for the model uncertainty inherent in the variable selection problem by averaging over the best models in the model class according to posterior model probability. Prior probabilities (ß-coefficients ≠ 0) of 0.5 were assigned to all predictors. Predictors with the highest posterior probabilities to have a ß-coefficient ≠ 0 after BMA and present in the top 5 models with the lowest Bayesian information criterion—indicating higher model fitness—were included in the final model. All P values reported are 2-sided. Fitted linear regression models were assessed for normality of residuals using a quantile–quantile plot. The proportional hazard assumption was tested for Cox models using the cox.zph function in R (www.r-project.org) and by plotting Schoenfeld residuals. All statistical analyses were performed using RStudio software (version 1.2.5033, RStudio, Boston, MA). The list of R packages used is available at the end of the supplemental Material.
CAR T-cell manufacturing
For manufacturing of CART1, autologous CD4+ and CD8+ T cells were immunomagnetically selected from a leukapheresis product and then modified with a lentivirus encoding a CAR comprising a CD19-specific single chain variable fragment (scFv) derived from the murine FMC63 monoclonal antibody, an IgG4-hinge, a CD28 transmembrane domain, and 4-1BB and CD3ζ signaling domains. The CAR was separated by a ribosomal skip sequence from a truncated human epidermal growth factor receptor, which enabled CAR T-cell enumeration by flow cytometry and formulation of a 1:1 CD4+:CD8+ CAR T-cell ratio for both CART1 and CART2 infusion. CAR transgene levels in blood were assessed by qPCR, as previously described.1,8
CART2 were manufactured using cryopreserved cells stored in process for CART1 (n = 42) or from a second leukapheresis procedure (n = 2). The end-manufacturing CART2 product was administered fresh (n = 15) or from a cryopreserved formulated product (n = 29). Details are shown in supplemental Table 7.
Anti-CAR immune responses
We evaluated CD8+ T-cell immune responses to the CAR transgene using a modification of an assay we previously described.31 Cryopreserved peripheral blood mononuclear cells (PBMCs) collected from patients before lymphodepletion chemotherapy and approximately 4 weeks after CAR T-cell infusion were stimulated twice at 7-day intervals with autologous irradiated CAR T cells and IL-2. The prelymphodepletion and postinfusion PBMC cultures were assayed for lysis of autologous CAR T cells and autologous nontransduced T cells in a chromium release assay. An immune response against the CAR transgene was defined as the presence of specific lysis of autologous CAR T cells, but not nontransduced T cells by postinfusion PBMC cultures; and absence of lysis of autologous CAR T cells and nontransduced T cells by prelymphodepletion PBMC cultures.
Results
Patient and disease characteristics before CART2
Of 197 patients treated on this clinical trial, 47 received CART2 (Table 1). Of these 47 patients, we excluded 3: 1 who received clofarabine-based lymphodepletion; 1 patient not evaluable for response after CART2; and 1 patient who received CART2 at another institution. Forty-four patients were included in the present analysis. Patients included in this analysis were heavily pretreated, with a median of 5 prior therapeutic regimens (interquartile range [IQR], 4-6). Before CART2, 9 patients (20%) had relapsed after an autologous hematopoietic cell transplantation (HCT; CLL, n = 1; NHL, n = 8); 14 patients (32%) had relapsed after an allogeneic HCT (allo-HCT), including 1 patient who progressed after an allo-HCT performed between CART1 and CART2. Seventeen patients (39%) had bulky disease (≥5 cm), and the median percentage of abnormal B cells in the marrow by flow cytometry in ALL and CLL patients was 4% (IQR, 0-35) and 36% (IQR, 19-63), respectively. Nine patients with CLL were included, including 1 with coexisting CLL and Richter transformation. Twenty-one patients with aggressive lymphoma histology were included in this analysis: diffuse large B-cell lymphoma (DLBCL), not otherwise specified (n = 8, 38%), Epstein-Barr virus-positive DLBCL, not otherwise specified (n = 1, 5%), Burkitt lymphoma (n = 3, 14%), grade 3 follicular lymphoma (grade 3A, n = 1, 5%; grade 3B, n = 1, 5%), transformed follicular lymphoma (n = 3, 14%), pleomorphic mantle cell lymphoma (n = 1, 5%), and Richter transformation to DLBCL without coexisting CLL (n = 3, 14%). Indications for CART2 were as follows: no response to CART1 (n = 15, 34%), relapse or progression after initial CR (n = 15) or PR (n = 7) following CART1 (n = 22, 50%), or PR deemed clinically insufficient after CART1 (n = 7, 16%). The median time from CART1 to CART2 was 2.3 months (range, 0.9-23). Thirteen patients (30%) received bridging therapy before CART2 (details regarding bridging therapies are shown in supplemental Table 2). CD19 expression on tumor cells before CART2 was normal in 28 patients (64%), decreased (low mean fluorescence intensity using flow cytometry and/or low staining intensity using immunohistochemistry) in 3 (7%), and was not evaluated in 13 patients (29%).
Patient and disease characteristics before CART2
| Characteristic | Overall, N = 44 | ALL, N = 14 | CLL, N = 9 | NHL, N = 21 |
|---|---|---|---|---|
| Female | 8 (18%) | 5 (36%) | 1 (11%) | 2 (9.5%) |
| Age (y) | 58 (44, 62) | 45 (30, 56) | 60 (56, 64) | 61 (52, 67) |
| 23-73 | 23-62 | 41-73 | 29-70 | |
| No. of prior therapies* | 5 (4, 6) | 4 (3, 6) | 6 (5, 7) | 4 (3, 6) |
| 1-12 | 1-12 | 5-9 | 2-11 | |
| Prior autologous HCT | 9 (20%) | 0 (0%) | 1 (11%) | 8 (38%) |
| Prior allo-HCT | 14 (32%) | 10 (71%) | 2 (22%) | 2 (9.5%) |
| Time from last HCT to CART2 (mo) | 16 (12, 31) | 18 (12, 34) | 12 (10, 14) | 17 (13, 39) |
| 4-107 | 10-91 | 8-16 | 4-107 | |
| Time from CART1 to CART2 (d) | 70 (47, 308) | 102 (57, 212) | 61 (47, 320) | 50 (44, 307) |
| 28-712 | 34-548 | 29-712 | 28-687 | |
| Serum LDH (U/L) | 182 (154, 256) | 174 (139, 298) | 180 (145, 242) | 187 (158, 256) |
| 89-859 | 89-848 | 109-293 | 127-859 | |
| Cross-sectional tumor area (mm2)† | 2254 (589, 5511) | 576 (44, 907) | 5231 (3904, 6832) | 2372 (597, 5470) |
| 0-19179 | 0-1237 | 2136-15,460 | 318-19,179 | |
| Bulky disease (≥5 cm) | 17 (39%) | 1 (7%) | 6 (67%) | 10 (48%) |
| Abnormal B cells in marrow (% of WBC)‡ | 4 (0, 24) | 4 (0, 35) | 36 (19, 63) | 0 (0, 0) |
| 0-93 | 0-93 | 4-78 | 0-9 | |
| Abnormal B cells in blood (cells/µL)§ | 0 (0, 27) | 1 (0, 250) | 212 (41, 435) | 0 (0, 0) |
| 0-80,547 | 0-80,547 | 0-1830 | 0-24 | |
| Bridging therapy before CART2|| | 13 (30%) | 5 (36%) | 4 (44%) | 4 (19%) |
| CNS disease¶ | 3 (7.3%) | 1 (8.3%) | 1 (11%) | 1 (5.0%) |
| Indication for CART2 | ||||
| No response after CART1 | 15 (34%) | 3 (21%) | 6 (67%) | 6 (29%) |
| Partial response after CART1 | 7 (16%) | 1 (7.1%) | 0 (0%) | 6 (29%) |
| Relapse after CR post CART1 | 15 (34%) | 9 (64%) | 0 (0%) | 6 (29%) |
| Relapse after PR post CART1 | 7 (16%) | 1 (7.1%) | 3 (33%) | 3 (14%) |
| Tumor CD19 expression pre-CART2 | ||||
| Normal | 28 (64%) | 13 (93%) | 7 (78%) | 8 (38%) |
| Decreased | 3 (7%) | 0 (0%) | 0 (0%) | 3 (14%) |
| Not evaluated | 13 (29%) | 1 (7%) | 2 (22%) | 10 (48%) |
Statistics presented: n (%); median (IQR) minimum-maximum.
Excluding prior HCT and CART1.
In patients with evaluable nodal disease (n = 30); sum of the product of the diameters of up to 6 of the largest lymph nodes or masses evaluated on the pre-CART2 lymphodepletion computed tomography scan.
In patients with evaluable marrow disease (n = 33).
Missing data in 2 patients.
Details of bridging regimens available in supplemental Table 2.
CNS disease was not evaluated in 3 patients because of low clinical suspicion. CD19 expression on tumor cells was evaluated by immunohistochemistry and/or flow cytometry.
CNS, central nervous system; LDH, lactate dehydrogenase; WBC, white blood cell.
CAR T-cell therapy characteristics
Thirty-two patients (73%) received cyclophosphamide and fludarabine (Cy-Flu) lymphodepletion before both CART1 and CART2; 6 (14%) received cyclophosphamide-based lymphodepletion without fludarabine (non-Cy-Flu) lymphodepletion before CART1 but Cy-Flu regimen before CART2 (Table 2). Four patients (9%) received non-Cy-Flu lymphodepletion before both CART1 and CART2. Two ALL (5%) and 2 NHL patients (5%) did not receive lymphodepletion chemotherapy before CART2 because of cytopenia and are included in the non-Cy-Flu group.
CART1 and CART2 treatment characteristics
| Characteristic | Overall, N = 44 | ALL, N = 14 | CLL, N = 9 | NHL, N = 21 |
|---|---|---|---|---|
| Pre-CART1 lymphodepletion | ||||
| Cy-Flu | 34 (77) | 11 (79) | 7 (78) | 16 (76) |
| Non-Cy-Flu | 10 (23) | 3 (21 | 2 (22) | 5 (24) |
| CART1 dose | ||||
| 2 × 10⁵ CAR T cells/kg | 16 (36) | 12 (86) | 2 (22 | 2 (9.5) |
| 2 × 10⁶ CAR T cells/kg | 26 (59) | 2 (14) | 7 (78) | 17 (81) |
| 2 × 10⁷ CAR T cells/kg | 2 (4.5) | 0 (0) | 0 (0) | 2 (9.5) |
| Pre-CART2 lymphodepletion | ||||
| Cy-Flu | 38 (86) | 12 (86) | 9 (100) | 17 (81) |
| Non-Cy-Flu | 2 (4.5) | 0 (0) | 0 (0) | 2 (9.5) |
| No lymphodepletion | 4 (9.5) | 2 (14) | 0 (0) | 2 (9.5) |
| CART2 dose | ||||
| 2 × 10⁶ CAR T cells/kg | 22 (50) | 14 (100) | 3 (33) | 5 (24) |
| 2 × 10⁷ CAR T cells/kg | 22 (50) | 0 (0) | 6 (67) | 16 (76) |
| Dose augmentation (CART2 > CART1 dose) | 36 (82) | 12 (86) | 8 (89) | 16 (76) |
| Doses for CART1 and CART2 | ||||
| 2 × 10⁵ then 2 × 10⁶ CAR T cells/kg | 16 (36) | 12 (86) | 2 (22) | 2 (9.5) |
| 2 × 10⁶ CAR T cells/kg for CART1 and CART2 | 6 (14) | 2 (14) | 1 (11) | 3 (14) |
| 2 × 10⁶ then 2 × 10⁷ CAR T cells/kg | 20 (45) | 0 (0) | 6 (67) | 14 (67) |
| 2 × 10⁷ CAR T cells/kg for CART1 and CART2 | 2 (4.5) | 0 (0) | 0 (0) | 2 (9.5) |
| Lymphodepletion changes from CART1 to CART2 | ||||
| Cy-Flu pre-CART1 and pre-CART2 | 32 (73) | 9 (64) | 7 (78) | 16 (76) |
| Cy-Flu pre-CART1; non-Cy-Flu pre-CART2 | 2 (4.5) | 2 (14) | 0 (0) | 0 (0) |
| Non-Cy-Flu pre-CART1; Cy-Flu pre-CART2 | 6 (14) | 3 (21) | 2 (22) | 1 (4.8) |
| Non-Cy-Flu pre-CART1 and pre-CART2 | 4 (9.1) | 0 (0) | 0 (0) | 4 (19) |
Data presented as n (%).
The CART2 dose was higher relative to CART1 in most patients (n = 36, 82%). Among the 14 ALL patients, the CART2 dose was increased from 2 × 10⁵ to 2 × 10⁶ CAR T cells/kg in 12 patients (86%), whereas the same dose of 2 × 10⁶ CAR T cells/kg was used for CART1 and CART2 in 2 patients (14%). In CLL (n = 9) and NHL (n = 21) patients, the CART2 dose was increased from 2 × 10⁶ to 2 × 10⁷ CAR T cells/kg in 6 (67%) and 14 (67%) patients, respectively.
CRS and neurologic toxicity after CART2
Despite an increase in the CART2 dose relative to CART1 in 82% of patients, we observed low rates of severe CRS and neurotoxicity after CART2, comparable to those observed after CART1 (Figure 1A). We noted comparable median CRS grades after CART1 and CART2 (1 vs 1, respectively; P = .90), and comparable proportions of patients with severe grade ≥3 CRS (7% vs 9%, respectively; P = 1). In addition, we observed comparable median neurotoxicity grades after CART1 and CART2 (0 vs 0, respectively; P = .50), and comparable proportions of patients who developed grade ≥3 neurotoxicity after CART1 and CART2 (14% and 11%, respectively; P = 1). All grade 3-4 CRS and neurotoxicity events were reversible, and we did not observe CART2-related deaths. We did not identify an increase in CRS or neurotoxicity severity between CART1 and CART2 using patient-paired Wilcoxon tests (P = .84 and P = .76, respectively). Tocilizumab was used for CRS treatment in 6 patients (14%), whereas dexamethasone was administered for CRS and/or neurotoxicity in 7 patients (16%) after CART2. We measured comparable peak serum concentrations of CRS-related cytokines (supplemental Figure 6) after CART2 compared with CART1. The peak serum concentration of soluble Fas was lower after CART1 compared with CART2 (P = .004).
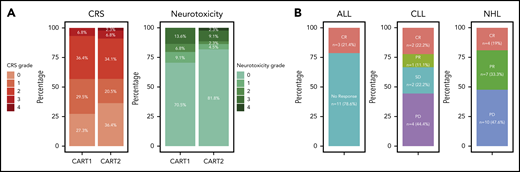
Toxicity and efficacy after CART2. (A) CRS grade according to the Lee et al 2014 consensus criteria (left).28 Neurotoxicity grade according to the CTCAE 4.03 grading scale (right). (B) Response rates by disease type. CTCAE, Common Terminology Criteria for Adverse Events; SD, stable disease.
Toxicity and efficacy after CART2. (A) CRS grade according to the Lee et al 2014 consensus criteria (left).28 Neurotoxicity grade according to the CTCAE 4.03 grading scale (right). (B) Response rates by disease type. CTCAE, Common Terminology Criteria for Adverse Events; SD, stable disease.
CRs were observed in a subset of ALL, CLL, and NHL patients after CART2
CR was achieved in 3 of 14 ALL patients (21%) after CART2 (marrow CR by morphology with MRD by flow cytometry, n = 2; CR by Lugano criteria25 in the absence of marrow disease, n = 1) (Figure 1B). All 3 responding ALL patients received a CART2 dose of 2 × 10⁶/kg after having received a CART1 dose of 2 × 10⁵/kg; 2 patients received Cy-Flu lymphodepletion before both CART1 and CART2, whereas 1 received Cy-Flu before CART1 and no lymphodepletion before CART2 because of significant cytopenia.
In the 9 CLL patients, the overall response rate (ORR) by 2018 International Workshop on CLL criteria24 after CART2 was 33% (CR, n = 2; PR, n = 1). All 3 responding CLL patients had no detectable marrow disease at day 28 post-CART2 by multiparameter flow cytometry, 1 of whom also without detectable marrow disease by IGH sequencing. In all 3 responding CLL patients, CART2 dose was higher than the CART1 dose (2 × 10⁵/kg [CART1] to 2 × 10⁶/kg [CART2], n = 2; 2 × 10⁶/kg [CART1] to 2 × 10⁷/kg [CART2], n = 1). All 3 responding CLL patients received Cy-Flu lymphodepletion before both CART1 and CART2.
Among the 21 NHL patients, the ORR after CART2 was 52% (CR, n = 4; PR, n = 7). The CART2 cell dose was higher than the CART1 dose in all but 1 responding NHL patient (2 × 10⁶/kg [CART1] to 2 × 10⁷/kg [CART2], n = 10, 2 × 10⁶/kg at both CART1 and CART2, n = 1). All responding NHL patients received Cy-Flu lymphodepletion before both CART1 and CART2. No responses after CART2 were observed in NHL patients who received non-Cy-Flu lymphodepletion before CART1.
Responses were observed despite bulky disease (supplemental Figure 1), and 8 of 17 responders (47%) had nodal or extramedullary lesions ≥5 cm before CART2.
Patient and disease characteristics, and CAR T-cell treatment characteristics stratified by response to CART2, are shown in supplemental Table 3 and supplemental Table 4, respectively.
Duration of response, PFS, and OS after CART2
The estimated median follow-up after CART2 was 28 months (IQR, 18-43) in all 44 patients (16, 18, and 43 months in the ALL, CLL, and NHL subgroups, respectively). The median PFS after CART2 was 28 days (95% confidence interval [95% CI], 21-208), 80 days (95% CI, 37-not estimated [NE]), and 61 days (95% CI, 28-250) in ALL, CLL, and NHL patients, respectively; the median OS after CART2 was 5 months (95% CI, 3-NE), 7 months (95% CI, 3-NE), and 9 months (95% CI, 5-NE) in ALL, CLL, and NHL patients, respectively (Figure 2A).
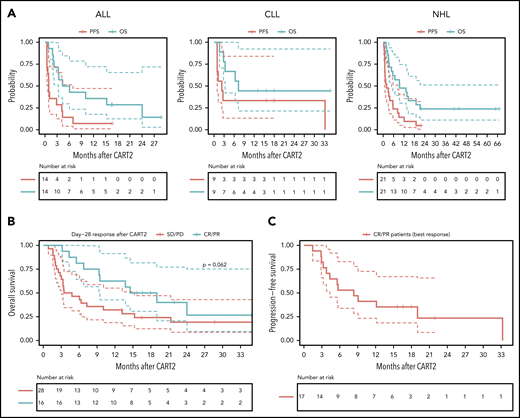
Outcomes after CART2. (A) OS and PFS probabilities after CART2 in ALL (left), CLL (middle), and NHL (right). (B) OS stratified by day 28 response after CART2. (C) PFS in CR/PR patients (n = 17) after CART2 (best response). Solid lines, Kaplan-Meier estimates; dashed lines, 95% CIs. For the analysis of PFS, an event was defined as no response, relapse or disease progression, or death. Death was the event for analysis of OS. Patients who did not have an event were censored at the date of last follow-up. Data were not censored at the time of initiation of new therapy, including allogeneic HCT, in the absence of disease progression. P values per the log-rank test.
Outcomes after CART2. (A) OS and PFS probabilities after CART2 in ALL (left), CLL (middle), and NHL (right). (B) OS stratified by day 28 response after CART2. (C) PFS in CR/PR patients (n = 17) after CART2 (best response). Solid lines, Kaplan-Meier estimates; dashed lines, 95% CIs. For the analysis of PFS, an event was defined as no response, relapse or disease progression, or death. Death was the event for analysis of OS. Patients who did not have an event were censored at the date of last follow-up. Data were not censored at the time of initiation of new therapy, including allogeneic HCT, in the absence of disease progression. P values per the log-rank test.
In patients in CR/PR at day 28 after CART2, the estimated 2-year OS was 36% (95% CI, 19-71; Figure 2B) compared with 19% in nonresponders (95% CI, 9-43; P = .06); in CR/PR patients (best response), the 2-year PFS probability was 23% (95% CI, 9-59; Figure 2C). The estimated median duration of response after CART2 in ALL, CLL, and NHL patients who achieved CR or PR was 4 months (95% CI, 3-NE), 33 months (95% CI, NE-NE), and 6 months (95% CI, 3-NE; supplemental Figure 2).
In ALL patients, ongoing response at the time of last follow-up was only seen in 1 patient who received inotuzumab ozogamicin 2 months after CART2 for MRD, followed by allo-HCT in CR with persistent MRD 11 months after CART2 (supplemental Figure 3A). Responses were durable in the 3 responding CLL patients, and 2 of them were still progression-free at 15 and 18 months (consolidative allo-HCT in CR post-CART2, n = 1; consolidative radiotherapy in PR post-CART2, n = 1). The third patient developed a late relapse 33 months after CART2 (persistent B-cell aplasia at 12 months after CART2 without available data past this timepoint; loss of CAR transgene persistence 24 months post-CART2); this patient was treated with rituximab and venetoclax and was still alive at the last follow-up (supplemental Figure 3B). We observed durable responses (>6 months) in 5 of 11 (45%) responding NHL patients; 3 of these 5 patients received consolidative allo-HCT in CR or PR 3, 4, and 6 months after CART2. Two patients remained progression-free for >6 months after CART2 without further therapies (supplemental Figure 3C). Because CD19− relapses have been reported after CD19 CAR T-cell therapy, we examined the CD19 expression on tumor cells at the time of progressive disease (PD) after CART2. Loss of CD19 expression was observed in 1 of 20 patients with available data at the time of PD. In this NHL patient, CD19− relapse occurred at the time of first restaging 28 days after CART2. We did not identify statistically significant differences in outcomes according to the clinical indication for CART2 (OS, P = .27; PFS, P = .07; supplemental Figure 9).
In vivo CAR T-cell expansion and persistence after CART2
CAR transgene copies were detected by qPCR in the blood of 19 of 38 patients (47%) with available data before CART2 lymphodepletion or before CART2 infusion for patients who did not receive repeat pre-CART2 lymphodepletion. The pre-CART2 median transgene copy number was 2.80 log10/µg of DNA (IQR, 1.35, 3.60; range, 1-4.40) in patients with transgene copies measured above the level of detection (1 log10/µg of DNA).
After CART2 infusion, CAR T cells were detected in the blood by flow cytometry in 42 of 44 patients (median peak CD8+ CAR T cells, 1.46 cells/µL, IQR, 0.44-11.04, range, 0.03-1515.86; median peak CD4+ CAR T cells, 1.23 cells/µL, IQR, 0.26-14.01, range, 0.03-226.17). Despite 82% of patients receiving a higher CART2 dose compared with CART1, we measured significantly lower CD8+ CAR T-cell peak expansion in blood after CART2 compared with CART1 (median CD8+ CAR T cells, 1.29 vs 16.25 cells/µL, respectively, P = .002; Figure 3A) and comparable CD4+ CAR T-cell peak expansion after CART2 compared with CART1 (median CD4+ CAR T cells, 1.23 vs 2.75 cells/µL, respectively, P = .39; Figure 3B). In patients with detectable B cells before CART2 and with available data (n = 19), we observed B-cell aplasia in 11 patients (58%) after CART2.
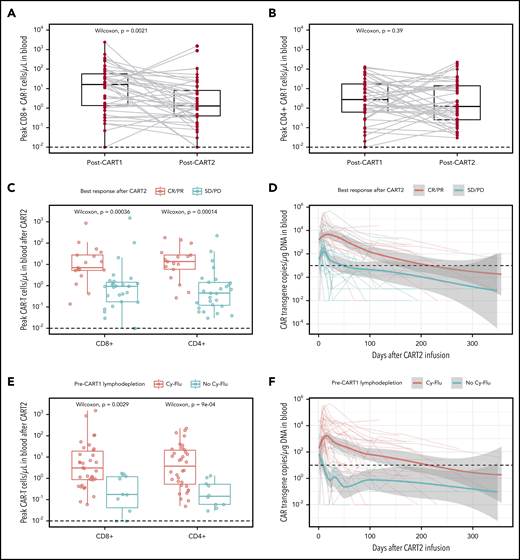
In vivo CAR T-cell expansion and persistence. (A-B) CD8+ (A) and CD4+ (B) CAR T-cell peak expansion (cells/µL) by flow cytometry after CART1 and CART2. Gray lines connect paired values between identical patients. (C,E) CAR T-cell peak expansion by flow cytometry categorized by best response (C) and pre-CART1 lymphodepletion (E). CAR T-cell persistence by qPCR (CAR transgene copies/µg of DNA) categorized by best response (E) and pre-CART1 lymphodepletion (F). Dashed lines, limit of detection. (A-C,E) Bold horizontal lines, median; box, IQR; vertical lines, quartiles ± 1.5 × IQR. (D,F) Bold lines, polynomial regression lines using the LOESS method, shaded areas, 95% CI of the LOESS estimates.
In vivo CAR T-cell expansion and persistence. (A-B) CD8+ (A) and CD4+ (B) CAR T-cell peak expansion (cells/µL) by flow cytometry after CART1 and CART2. Gray lines connect paired values between identical patients. (C,E) CAR T-cell peak expansion by flow cytometry categorized by best response (C) and pre-CART1 lymphodepletion (E). CAR T-cell persistence by qPCR (CAR transgene copies/µg of DNA) categorized by best response (E) and pre-CART1 lymphodepletion (F). Dashed lines, limit of detection. (A-C,E) Bold horizontal lines, median; box, IQR; vertical lines, quartiles ± 1.5 × IQR. (D,F) Bold lines, polynomial regression lines using the LOESS method, shaded areas, 95% CI of the LOESS estimates.
We previously reported higher in vivo expansion and persistence of CAR T cells in patients responding to a first infusion of CD19 CAR T cells compared with nonresponders.1,7,8,13,15,16 Similarly, CD8+ and CD4+ CAR T-cell peak expansion after CART2 was strongly associated with response (P < .001 and P < .001, respectively; Figure 3C). In addition, we observed longer CAR T-cell persistence in CR/PR compared with stable disease/PD patients after CART2 (time to CAR T-cell loss, 217 vs 54 days, respectively; Figure 3D).
Preliminary data from our group in ALL1 and NHL8 patients suggested Cy-Flu lymphodepletion might correlate with better in vivo CAR T-cell peak expansion and persistence after both CART1 and CART2. This association was confirmed in this larger dataset. In addition, Cy-Flu compared with non-Cy-Flu lymphodepletion before CART1 was associated with significantly higher CD8+ and CD4+ CAR T-cell peak expansion after CART2 (P = .003 and P < .001, respectively; Figure 3E) and markedly longer CAR T-cell persistence (time to CAR T-cell loss, 217 vs 9 days, respectively; Figure 3F). We observed positive correlations between the day 0 pre-CART2 serum concentration of several cytokines and the peak CD8+ (interleukin-15 [IL-15], R = 0.33, P = .05; supplemental Figure 4) and CD4+ (IL-7, R = 0.41, P = .01; IL-15, R = 0.42, P = .01; transforming growth factor-β, R = 0.38, P = .03; supplemental Figure 5) CAR T-cell expansion after CART2.
Multivariable analyses of factors associated with outcomes after CART2
We used multivariable regression models to identify factors independently associated with response, PFS, and CAR T-cell peak expansion after CART2 (Table 3).
Multivariable analyses of factors associated with outcomes and CAR T-cell in vivo expansion after CART2
| OR, HR, β | 95% CI | P | |
|---|---|---|---|
| Multivariable logistic regression for best response, OR | |||
| Pre-CART1 lymphodepletion | |||
| Non-Cy-Flu lymphodepletion | 1 | ||
| Cy-Flu lymphodepletion | 48.42 | 4.29-7018.31 | <.001 |
| CAR T-cell dose augmentation (CART2 > CART1 dose) | |||
| No | 1 | ||
| Yes | 6.38 | 1.07-58.08 | .04 |
| Disease type | |||
| ALL | 1 | ||
| CLL | 1.86 | 0.26-13.89 | .53 |
| NHL | 7.82 | 1.43-60.59 | .02 |
| Multivariable Cox regression for PFS after CART2, HR | |||
| Pre-CART1 lymphodepletion | |||
| Non-Cy-Flu lymphodepletion | 1 | ||
| Cy-Flu lymphodepletion | 0.16 | 0.06-0.41 | <.001 |
| CAR T-cell dose augmentation (CART2 > CART1 dose) | |||
| No | 1 | ||
| Yes | 0.29 | 0.11-0.72 | .008 |
| Disease type | |||
| ALL | 1 | ||
| CLL | 0.33 | 0.12-0.91 | .03 |
| NHL | 0.49 | 0.23-1.02 | .06 |
| Multivariable linear regression model for post-CART2 CD8+CAR T-cell peak in blood, β | |||
| Pre-CART1 lymphodepletion | |||
| Non-Cy-Flu lymphodepletion (reference category) | |||
| Cy-Flu lymphodepletion | 1.65 | 0.82-2.49 | <.001 |
| CAR T-cell dose augmentation (CART2 > CART1 dose) | |||
| No | |||
| Yes | 0.19 | −0.53 to 0.91 | .59 |
| Disease type | |||
| ALL (reference category) | |||
| CLL | 1.16 | 0.21-2.12 | .02 |
| NHL | 0.85 | 0.05-1.64 | .04 |
| CD19+ cell count in blood (100 cells/µL increment) | 0.03 | −0.001 to 0.06 | .06 |
| CART2 end-manufacturing product | |||
| Fresh | |||
| Cryopreserved* | −0.28 | −0.94 to 0.37 | .39 |
| Multivariable linear regression model for post-CART2 CD4+CAR T-cell peak in blood, β | |||
| Pre-CART1 lymphodepletion | |||
| Non-Cy-Flu lymphodepletion (reference category) | |||
| Cy-Flu lymphodepletion | 1.83 | 1.08-2.57 | <.001 |
| CAR T-cell dose augmentation (CART2 > CART1 dose) | |||
| No | |||
| Yes | 0.30 | −0.34 to 0.94 | .35 |
| Disease type | |||
| ALL (reference category) | |||
| CLL | 0.87 | 0.01-1.72 | .05 |
| NHL | 1.51 | 0.80-2.21 | <.001 |
| CD19+ cell count in blood (100 cells/µL increment) | 0.02 | −0.004 to 0.05 | .09 |
| CART2 end-manufacturing product | |||
| Fresh | |||
| Cryopreserved* | −0.28 | −0.87 to 0.30 | .33 |
Using logistic and Cox models, the following predictors were included for BMA: disease type, pre-CART1 and pre-CART2 lymphodepletion, response to CART1, LDH serum concentration before pre-CART2 lymphodepletion, CAR T-cell dose augmentation (CART2 dose > CART1 cell dose vs CART2 dose = CART1 cell dose), time from CART1 to CART2, fresh vs cryopreserved CART2 infusion product, CART2 manufacturing (4 categories: reformulation using cryopreserved CAR T cells previously stored at the end of CART1 manufacturing, stimulation and transduction of T cells previously or newly collected, re-stimulation of transduced T cells previously stored in process for CART1, or other), B cell recovery in the blood between CART1 and CART2. For the linear regression model, all predictors listed above were included for BMAm in addition to the CD19+ cell count in blood.
Cryopreserved only or mix of cryopreserved and fresh end-manufacturing CAR T cells.
Best response and PFS after CART2
Using multivariable logistic regression, Cy-Flu lymphodepletion pre-CART1 (odds ratio [OR], 48.42; 95% CI, 4.29-7018.31; P < .001), CART2 > CART1 dose (OR, 6.38, 95% CI, 1.07-58.08, P = .04), and the NHL disease type (OR, 7.82, 95% CI, 1.43-60.59, P = .02) were independently associated with higher probabilities of response after CART2. Cy-Flu lymphodepletion pre-CART1 (hazard ratio [HR], 0.16, 95% CI, 0.06-0.41, P < .001), CART2 > CART1 dose (HR, 0.29, 95% CI, 0.11-0.72, P = .008), and the CLL and NHL disease types (HR, 0.33, 95% CI, 0.12-0.91, P = .03, and HR, 0.49, 95% CI, 0.23-1.02, P = .06, respectively) were associated with a lower risk of progression or death after CART2. In a supplementary analysis (supplemental Table 9), we observed a trend toward an association between B-cell recovery in the blood between CART1 and CART2 and a lower hazard of progression or death after CART2 (HR, 0.52, 95% CI, 0.25-1.09, P = .08).
The associations of response to CART2 with pre-CART1 lymphodepletion and CART2 dose augmentation in multivariable analyses, and higher CAR T-cell counts after CART2 (Figure 3E-F) suggested that factors associated with robust CAR T cell in vivo expansion may be key to efficacy after CART2.
Factors affecting CAR T-cell in vivo expansion after CART2
Next, we performed multivariable linear regression to identify predictors of peak CAR T-cell expansion after CART2 (CD8+ and CD4+ CAR T cells/µL). After adjusting for disease type, pre-CART2 CD19+ cell counts in blood, CAR T-cell dose augmentation (CART2 > CART1 dose), and CART2 manufacturing (fresh vs cryopreserved end-manufacturing CART2 product), the factor most strongly associated with increased in vivo CAR T-cell expansion was pre-CART1 Cy-Flu lymphodepletion (CD8+, P < .001; CD4+, P < .001). Using this model, CLL and NHL were associated with higher CAR T-cell expansion compared with ALL (CD8+, CLL, P = .02; NHL, 0.85, P = .04; CD4+, CLL, P = .05; NHL, P < .001). There was a trend toward a positive association between pre-CART2 lymphodepletion CD19+ cell count in blood and CAR T-cell expansion (CD8+, P = .06; CD4+, P = .09), The impact of dose augmentation (CD8+, P = .59; CD4+, P = .35) and CART2 manufacturing on peak CAR T-cell expansion (CD8+, P = .39; CD4+, P = .33) were undetermined.
The finding that the pre-CART1 lymphodepletion regimen was associated with in vivo CAR T-cell counts and antitumor efficacy after CART2 suggested that more intensive lymphodepletion before CART1 might limit CAR T-cell rejection and improve outcomes after CART2. In support of this, we found in a subset of patients with available data (post-CART1, n = 14; post-CART2, n = 13; supplemental Table 10) that endogenous CD8+ T-cell responses against autologous CAR T cells were observed in a higher percentage of patients treated with non-Cy-Flu compared with Cy-Flu pre-CART1 (post-CART1, 4 of 8 [50%] vs 1 of 6 [17%], P = .3; post-CART2, 7 of 8 [88%] vs 1 of 5 [20%], P = .03, respectively).
Superior outcomes in NHL and CLL patients treated with an increased CART2 dose and previously exposed to Cy-Flu lymphodepletion before CART1
Based on our findings using multivariable modeling, we compared post-CART2 outcomes of NHL and CLL patients according to the pre-CART1 lymphodepletion and the CART2 dose relative to CART1 (Figure 4). Significantly higher rates of best response (P = .004; Figure 4A) and longer PFS (P < .001; Figure 4B) were achieved after treatment with an increased CART2 dose in patients previously exposed to Cy-Flu lymphodepletion before CART1 (ORR, 71% [CR, 29%; PR, 42%]; median PFS, 6 months) compared with those treated with the same CART2 and CART1 dose and who also received pre-CART1 Cy-Flu lymphodepletion (ORR, 33%; median PFS, 1 month), and to those not previously exposed to Cy-Flu lymphodepletion pre-CART1 (ORR, 0%; median PFS, 1 month).
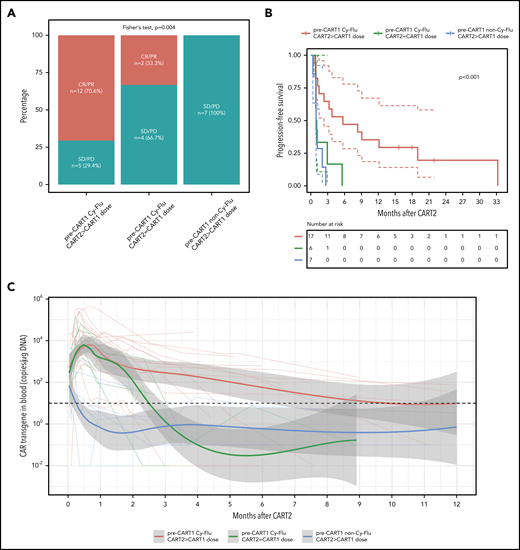
Outcomes and CAR T-cell persistence in NHL and CLL patients stratified according to pre-CART1 lymphodepletion and CART2 dose relative to CART1. (A) Response rates, (B) PFS, and (C) CAR T-cell persistence by qPCR in NHL and CLL patients according to pre-CART1 lymphodepletion and CART2 dose relative to CART1. Solid lines, Kaplan-Meier estimates; dashed lines; 95% CIs. P values per the log-rank test. Two patients in the pre-CART1 Cy-Flu CART2 > CART1 dose received a CART1 dose of 2 × 10⁵/kg and a CART2 dose of 2 × 10⁶/kg. (C) Bold lines, polynomial regression lines using the LOESS method, shaded areas, 95% CI of the LOESS estimates.
Outcomes and CAR T-cell persistence in NHL and CLL patients stratified according to pre-CART1 lymphodepletion and CART2 dose relative to CART1. (A) Response rates, (B) PFS, and (C) CAR T-cell persistence by qPCR in NHL and CLL patients according to pre-CART1 lymphodepletion and CART2 dose relative to CART1. Solid lines, Kaplan-Meier estimates; dashed lines; 95% CIs. P values per the log-rank test. Two patients in the pre-CART1 Cy-Flu CART2 > CART1 dose received a CART1 dose of 2 × 10⁵/kg and a CART2 dose of 2 × 10⁶/kg. (C) Bold lines, polynomial regression lines using the LOESS method, shaded areas, 95% CI of the LOESS estimates.
Despite comparable peak in vivo CAR T-cell expansion between patients who received pre-CART1 Cy-Flu lymphodepletion with or without a CART2 dose increase, we observed markedly longer CAR T-cell persistence after infusion of an increased dose of CART2 compared with patients who receive the same CART1 and CART2 dose (Figure 4C). This suggested a CART2 dose increase, in addition to the use of Cy-Flu before CART1, may contribute in mitigation of the effects of anti-CAR immune responses. Supporting this hypothesis, we observed a higher percentage of anti-CAR immune responses in patients who received a CART2 dose of 2 × 10⁶/kg compared with 2 × 10⁷/kg (3 of 3 [100%] vs 1 of 6 [17%], respectively, P = .048; pre-CART1 Cy-Flu patients with available data, n = 9). Additional studies will be required in a larger cohort to confirm these findings.
Discussion
Although CD19 CAR T cells have shown promising efficacy in patients with R/R B-cell malignancies, most still fail to achieve durable CR. Second infusions of CD19 CAR T cells have the potential to improve outcomes for patients who do not achieve an optimal response after CART1. We retrospectively analyzed the outcomes of patients treated at our institution with CART2 on a phase 1/2 clinical trial, aiming at characterizing the toxicity and efficacy of CART2, and with the goal of identifying factors associated with post CART2 outcomes.
CART2 was well tolerated with low CRS severity despite 82% of patients receiving a higher dose of CAR T cells relative to CART1. The median CRS grade after CART2 was 1, and only 4 patients (9%) developed grade 3-4 CRS. We also observed low neurotoxicity severity (median grade, 0), with only 5 patients (11%) developing grade 3-4 neurotoxicity.
The efficacy of CART2 differed across disease types; our multivariable analyses confirmed that ALL was independently associated with a lower probability of response compared with NHL patients, and shorter PFS compared with both CLL and NHL patients. This is in contrast with the outcomes observed in ALL patients treated with a first CAR T-cell infusion; in the first infusion setting, response rates are typically higher compared with CLL and NHL. We have previously demonstrated associations of in vivo CAR T-cell expansion with response.1,7,8,15,16,24 Here, multivariable linear regression analysis suggested ALL was independently associated with lower in vivo CAR T-cell expansion after CART2 compared with both CLL and NHL. Importantly, because of concern for a higher risk of CRS and neurotoxicity, ALL patients received lower CART2 doses (2 × 10⁶ CAR T cells/kg in all patients) compared with CLL and NHL patients (2 × 10⁷ CAR T cells/kg in 67% and 76%, respectively), which may in part contribute to the findings in ALL. In addition, the relatively low tumor burden in ALL patients may also explain why we measured lower in vivo CAR T-cell expansion after CART2 in this group.
We have also previously shown that the choice of lymphodepletion regimen may affect in vivo CAR T-cell expansion.1,8 In the present study, we found that the type of lymphodepletion before CART1 had a strong association with outcomes of CART2. Compared with non-Cy-Flu lymphodepletion, Cy-Flu before CART1 was associated with better in vivo CAR T-cell expansion and persistence, higher probabilities of response, and longer PFS after CART2. Our group31,33 and others22,34,35 have reported that in vivo T-cell expansion and persistence may be limited by immune responses after treatment with transgenic T cells. The better outcomes after CART2 in patients who received Cy-Flu compared with non-Cy-Flu before CART1 are consistent with attenuation of anti-CAR immune responses by the addition of Flu to Cy lymphodepletion.1,8 Conceptually, lymphodepletion before CART1 may affect the priming of naïve endogenous T cells against CAR T cells; in CAR-exposed patients, lymphodepletion type and intensity could alter anti-CAR recall responses. Additionally, the cytokine homeostatic response to lymphodepletion might also affect CAR T-cell function after CART2 (supplemental Figures 4 and 5). Further studies are needed to clarify the biological effects of lymphodepletion.
Maude et al have reported results in children and young adults with R/R ALL after prior failure of murine CD19 CAR T cells using a humanized CD19-targeted CAR transgene.36 They observed CR in 9 of 16 patients (56%) in whom CART1 had only induced poor or transient responses. A CART2 that incorporates a CAR with a different scFv to that used in CART1 might share fewer immunogenic epitopes with CART1, thereby limiting immune rejection and contributing to the encouraging responses seen in their study. A phase 1/2 clinical trial is currently enrolling at our institution using T cells engineered with a CAR containing a fully human scFv-bearing CAR for patients with R/R ALL or large B-cell lymphoma, both in the CAR-naïve or CAR-exposed setting.37
Despite the use of Cy-Flu before CART1, in our study, in vivo CAR T-cell expansion after CART2 was lower than observed after CART1. We showed that durable responses were only observed in CLL and NHL patients who received an increased CART2 dose in addition to having been exposed to Cy-Flu lymphodepletion before CART1. Although peak in vivo CAR T-cell expansion was no different in Cy-Flu-exposed patients who did or did not receive an increased CART2 compared with CART1 cell dose, we observed markedly longer CAR T-cell persistence in those who received a higher CART2 dose. It is possible that a high CART2 dose might mitigate anti-CAR immune responses generated after CART1, akin to the abrogation of HLA-mismatched hematopoietic stem cell graft rejection in mice38 and humans39 by a marked increase in the CD34+ cell dose. Although it is possible that an increase in CART2 dosing might improve outcomes, further studies are needed to determine whether an increase in the CART2 dose contributes to dampening or preventing anti-CAR immune responses.
Additional factors may have affected in vivo CAR T-cell expansion and persistence, such as the use of cryopreserved end-manufacturing CAR T cells at CART2. Although lower CD8+ CAR T-cell expansion was measured after CART2 compared with CART1, comparable CD4+ CAR T-cell expansion was observed. As shown by Tompa et al,33 the function of distinct T-cell subsets can be differentially affected by cryopreservation, which might have contributed to this finding.
Our data strongly suggest a higher CART2 dose is needed to improve the rate and durability of responses after failure of CART1. We demonstrated that a dose augmentation from 2 × 10⁶ to 2 × 10⁷ CAR T cells/kg was well tolerated in NHL and CLL without evidence of an increase in the incidence of CAR T-cell–related toxicities, indicating some patients may benefit from a CART2 dose increase above the previously established maximum tolerated dose. Furthermore, the optimal dose for subsequent CAR T-cell infusions may in some cases need to be reevaluated, especially for patients who will receive a subsequent CAR T-cell infusion that incorporates a transgene that shares potentially immunogenic epitopes with the CAR T cells administered for the first infusion. Immune responses to these shared epitopes after treatment with 1 CAR T-cell product could lead to rejection of a different and novel CAR T-cell product, affecting dose-finding studies and efficacy estimates. Overall, response durability is limited after CART2; therefore, we recommend that consolidation with allogeneic HCT be considered in suitable patients who respond to CART2.
Our study has several limitations: this analysis is retrospective and limited by a small number of subjects in each disease group. Our multivariable modeling might have missed variables with a relevant effect size because of low statistical power. To account for potential overfitting, model fitness was assessed using the Bayesian Information Criterion, which applies a penalty term for the number of parameters in the models.
The patient population for retreatment was selected according to defined eligibility criteria. In addition to these criteria, many other factors affected the decision to proceed with retreatment (eg, willingness of physicians to return the patient to our institution for a second infusion, willingness and ability of patients to be retreated, the patient’s location, availability of a CAR T-cell product or of cells from which a CAR T-cell product could be produced). Bridging therapies between CART1 and CART2, as well as subsequent therapies after CART2, such as allo-HCT, may have also affected outcomes. Furthermore, some patients on our study proceeded to CART2 because of unsatisfactory PR after CART1 (n = 7). Because PR to CR conversions have been described in NHL patients treated with tisagenlecleucel10 and axicabtagene ciloleucel,11 it is possible that in this group a delayed response to CART1 contributed to CART2 efficacy. Currently, US Food and Drug Administration-approved CAR T-cell products (axicabtagene ciloleucel and tisagenleleucel) use different manufacturing platforms compared with our CAR T-cell product. Hence, our conclusions may not apply to these products. Importantly, further studies are needed to clarify the biological effects of lymphodepletion and increased cell dose on immune rejection and on the tumor microenvironment. Although CART1 and CART2 product characteristics (naïve and memory T-cell phenotypes, ex vivo expansion, in vitro cytotoxicity) were comparable between responders and nonresponders (supplemental Tables 5 and 6 at CART1 and CART2, respectively), intrinsic differences in CAR T-cell function or “fitness” may still have contributed to the antitumor efficacy of CART2.
In summary, second infusions of CD19 CAR T cells were feasible and led to durable responses in a subset of patients who received an increased CART2 dose and Cy-Flu lymphodepletion before CART1. Our findings that 2 actionable pretreatment factors were independently associated with significantly higher response rates and longer PFS after CART2 provide a path forward to improve in vivo CAR T-cell kinetics and responses after repeat CAR T-cell infusions. The data may inform the design of future CAR T-cell clinical trials in patients who have previously failed CAR T-cell immunotherapy.
Presented in abstract form at the 61st annual meeting of the American Society of Hematology, Orlando, FL, 7 December 2019 and at the annual 2020 Transplantation and Cellular Therapy meetings of the American Society for Transplantation and Cellular Therapy and the Center for International Blood and Marrow Transplant Research, Orlando, FL, 22 February 2020.
Original data is available upon request to the corresponding author.
The online version of this article contains a data supplement.
The publication costs of this article were defrayed in part by page charge payment. Therefore, and solely to indicate this fact, this article is hereby marked “advertisement” in accordance with 18 USC section 1734.
Acknowledgments
The authors acknowledge the Fred Hutchinson Cancer Research Center Cell Processing Facility, the Seattle Cancer Care Alliance Cell Therapy Laboratory, and the staff of the Program in Immunology and Seattle Cancer Care Alliance Immunotherapy Clinic.
This work was supported by grants from the National Institutes of Health, National Cancer Institute (NCI R01 CA136551 and NCI P30 CA15704), National Institute of Diabetes and Digestive and Kidney Diseases (NIDDK P30 DK56465), and National Heart, Lung, and Blood Institute (T32HL007093); the Life Science Discovery Fund; the Bezos family; and Juno Therapeutics (a Celgene and BMS company).
Authorship
Contribution: J.G., E.D.B, C.J.T., and D.G.M. conceived and designed the study; J.G., E.D.B., A.V.H., C.J.T., and D.G.M. collected and assembled the data; J.G., E.D.B., C.J.T., and D.G.M. undertook data analysis and interpretation; and all authors participated in manuscript writing and final approval of the manuscript, and are accountable for all aspects of the work.
Conflict-of-interest disclosure: C.K.C. has pending patients licensed with Nektar Therapeutics. R.D.C. has received research funding from Amgen, Kite/Gilead, Merck, Pfizer, and Vanda Pharmaceuticals; honoraria/consulting from Amgen and Pfizer; and his spouse is employed by and owns stock in Seattle Genetics. A.J.C. receives research funding from Janssen, BMS, and AbbVie and is a member of scientific advisory boards for Sanofi and Cellectar; he has received consultancy honorarium from Janssen. D.J.G. has received research funding, has served as an advisor, and has received royalties from Juno Therapeutics, a Bristol-Myers Squibb company; has served as an advisor and received research funding from Seattle Genetics; has served as an advisor to GlaxoSmithKline, Janssen Biotech, and Legend Biotech; and has received research funding from Sanofi and Cellectar Biosciences. M.S. received research funding from Mustang Bio, Celgene, Pharmacyclics, Gilead, Genentech, Abbvie, TG therapeutics, Beigene, Acerta Pharma, Merck, and has served on advisory boards for Abbvie, Genentech, Astra Zeneca, Sound Biologics, Verastem, ADC therapeutics, and Atara Biotherapeutics. S.R.R. holds equity, has served as an advisor, and has patents licensed to Juno Therapeutics, a Celgene company; is a founder of Lyell Immunopharma, and has served on advisory boards for Adaptive Biotechnologies and Nohla. D.G.M. has received research funding from Kite Pharma, Juno Therapeutics, a Celgene company, and Celgene; has received honoraria for participation in advisory boards meetings with Kite Pharma, Gilead, Genentech, Novartis, and Eureka. C.J.T. receives research funding from Juno Therapeutics, Nektar Therapeutics, Minerva, TCR2, and AstraZeneca; is a member of scientific advisory boards and has options in Precision Biosciences, Eureka Therapeutics, Caribou Biosciences, Myeloid Therapeutics, and ArsenalBio; serves on scientific advisory boards for T-CURX and Century Therapeutics; has served on advisory boards for Nektar Therapeutics, Allogene, Kite/Gilead, Novartis, Humanigen, PACT Pharma, Amgen, and Astra Zeneca; and has patents licensed to Juno Therapeutics. The remaining authors declare no competing financial interests.
Correspondence: Jordan Gauthier, Clinical Research Division, Fred Hutchinson Cancer Research Center, 1100 Fairview Ave N, Seattle WA 98109; e-mail: jgauthier@fredhutch.org.
