

Key Points
Venetoclax-sensitive myeloma retains a B cell–like pattern of gene expression and chromatin accessibility.
B-cell genes may serve as a better biomarker for predicting venetoclax response than t(11;14) alone.

Abstract
Venetoclax is a highly potent, selective BCL2 inhibitor capable of inducing apoptosis in cells dependent on BCL2 for survival. Most myeloma is MCL1-dependent; however, a subset of myeloma enriched for translocation t(11;14) is codependent on BCL2 and thus sensitive to venetoclax. The biology underlying this heterogeneity remains poorly understood. We show that knockdown of cyclin D1 does not induce resistance to venetoclax, arguing against a direct role for cyclin D1 in venetoclax sensitivity. To identify other factors contributing to venetoclax response, we studied a panel of 31 myeloma cell lines and 25 patient samples tested for venetoclax sensitivity. In cell lines, we corroborated our previous observation that BIM binding to BCL2 correlates with venetoclax response and further showed that knockout of BIM results in decreased venetoclax sensitivity. RNA-sequencing analysis identified expression of B-cell genes as enriched in venetoclax-sensitive myeloma, although no single gene consistently delineated sensitive and resistant cells. However, a panel of cell surface makers correlated well with ex vivo prediction of venetoclax response in 21 patient samples and may serve as a biomarker independent of t(11;14). Assay for transposase-accessible chromatin sequencing of myeloma cell lines also identified an epigenetic program in venetoclax-sensitive cells that was more similar to B cells than that of venetoclax-resistant cells, as well as enrichment for basic leucine zipper domain–binding motifs such as BATF. Together, these data indicate that remnants of B-cell biology are associated with BCL2 dependency and point to novel biomarkers of venetoclax-sensitive myeloma independent of t(11;14).
Introduction
Although advances in multiple myeloma therapy have resulted in significant improvements in patient survival, myeloma remains incurable, and the majority of patients ultimately relapse and require additional lines of therapy.1,2 Drugs targeting the BCL2 family represent an exciting new class of therapeutics with a novel mechanism of action. Cell survival is regulated by a delicate balance of pro-apoptotic and anti-apoptotic BCL2 family proteins.3,4 The anti-apoptotic proteins BCL2, BCLXL, and MCL1 bind to and sequester pro-apoptotic proteins, preventing them from activating the apoptotic pathway. Venetoclax (a BCL2 inhibitor), navitoclax and ABT-737 (BCL2/BCLXL inhibitors), and the MCL1 inhibitors AMG176, AZD5991, and S63845 induce tumor apoptosis by disrupting the ability of their targets to inhibit pro-apoptotic proteins.5-8 Of these drugs, venetoclax is the first and only one approved to date for use in chronic lymphocytic leukemia and for acute myeloid leukemia in combination with hypomethylating agents.
Chronic lymphocytic leukemia, which originates from BCL2-dependent B cells, is highly sensitive to venetoclax, whereas other B-cell lymphomas such as follicular lymphoma and diffuse large B-cell lymphoma are less sensitive.9-11 B cells differentiate into plasma cells; they undergo numerous epigenetic and transcriptional changes that allow them to secrete large quantities of antibody.12 A number of studies have shown that as part of this differentiation process, plasma cells convert to an MCL1-dependent state.13-15 Myeloma would therefore not be predicted to respond to venetoclax. However, a subset of myeloma with t(11;14), a translocation between the immunoglobulin heavy chain and cyclin D1 (CCND1) present in 15% to 20% of patients with myeloma, is more sensitive to these drugs and must therefore be BCL2 dependent.16-19 A phase 1 trial of venetoclax in multiple myeloma has reported an objective response rate of 40% among patients with t(11;14), compared with patients without t(11;14), who have a less favorable response rate of only 6%.20
Response to BCL2 inhibitors in myeloma is dictated by numerous intrinsic and extrinsic factors.17,19,21-25 To further characterize the factors contributing to venetoclax sensitivity in myeloma, we examined the BCL2 family proteins, global RNA expression, and chromatin accessibility in a panel of myeloma cell lines and patient samples. Here we report increased expression of B-cell genes and enrichment of basic leucine zipper domain transcription factor motifs such as BATF in areas of increased chromatin accessibility in venetoclax-sensitive myeloma. Together, these data identify new biomarkers for selecting venetoclax-sensitive patients beyond t(11;14) as well as the transcription factors that may be driving this altered expression program and BCL2 dependence.
Methods
Cell lines
RPMI8226 and MM.1S cells were purchased from ATCC. KMS11, KMS12BM, KMS12PE, KMS18, KMS20, KMS21BM, KMS27, KMS28, and KMS34 were purchased from the Japanese Collection of Research Bioresources Cell Bank. OPM2 was provided by Nizar Bahlis (University of Calgary). All other cell lines were provided by Jonathan Keats. All cell lines were validated by using sequencing and phenotypic characterization.
Reagents
Venetoclax was generously provided by AbbVie. Recombinant human IL-6 was purchased from R&D Systems.
Small interfering RNAs
Small interfering RNAs (siRNAs) were purchased from Dharmacon (GE Life Sciences). ON-TARGETplus SMART pool siRNA against CCND1 and the siCONTROL nontargeting siRNA were used per manufacturer’s protocol.
Cell cycle analysis
Twenty-four hours after siRNA transfection, cells were washed and resuspended in 500 μL phosphate-buffered saline, then added dropwise to 3.5 mL ice-cold 70% ethanol and incubated overnight at −20°C. Cells were then washed in phosphate-buffered saline, resuspended in 500 μL propidium iodide/RNAse staining buffer (BD Biosciences) for 30 minutes at room temperature, and analyzed by flow cytometry.
Apoptosis assays
Cell death was measured by Annexin V–fluorescein isothiocyanate and propidium iodide staining as previously described.26
Western blot analysis
Western blotting was performed by using standard techniques as previously described.27
Coimmunoprecipitation studies
Immunoprecipitation experiments were performed by using the Exacta-Cruz C Kit (Santa Cruz Biotechnology) as previously described.27
Patient sample processing
All samples were collected following an Emory University Institutional Review Board–approved protocol and treated with venetoclax to determine 50% inhibitory concentration (IC50) as previously described.28 Research was conducted in accordance with the Declaration of Helsinki. After processing, 1 to 5 million bone marrow aspirate cells were cryopreserved in 1 mL 10% dimethyl sulfoxide and transferred to −140°C liquid nitrogen freezers. Samples were thawed and stained with cell surface antibodies and a live/dead dye for flow cytometry and sorting. Details are given in the supplemental Methods (available on the Blood Web site).
CRISPR knockout and activation
CRISPR knockout was performed by using pCW-Cas9 (Addgene 50661) and pLX-sgRNA (Addgene 50662) as previously described.29 CRISPR activation was performed by using dCAS9-VP64_blast (Addgene 61425) and pXPR-502 (Addgene 96923), as described elsewhere.30 Additional details and sgRNA sequences are provided in the supplemental Methods.
RNA-sequencing
RNA-sequencing analysis was performed similarly to as described elsewhere.12 Details are given in the supplemental Methods.
Assay for transposase-accessible chromatin sequencing
Assay for transposase-accessible chromatin sequencing (ATAC-sequencing) was performed similarly to as previously described.31,32 Details are given in the supplemental Methods.
Results
Translocation t(11;14) and CCND1 do not contribute directly to venetoclax response
Although t(11;14) has been associated with response to venetoclax and results in CCND1 overexpression, the contribution of CCND1 to venetoclax sensitivity has never been tested. To directly probe the role of t(11;14) and CCND1, we performed siRNA knockdown of CCND1 in the t(11;14) venetoclax-sensitive cell lines Karpas 620, KMS12PE, and KMS12BM. CCND1 knockdown resulted in decreased protein levels by western blot and was sufficient to induce G1 cell cycle arrest (Figure 1A-B). If CCND1 is directly responsible for venetoclax sensitivity, we would expect knockdown to reduce venetoclax sensitivity. However, we observed no effect on response to venetoclax in 2 of the cell lines and counterintuitively an approximately threefold increase (IC50 of 306 nM vs 79 nM) in the third, KMS12BM (Figure 1C). CCND1 knockdown also had no effect on expression of MCL1, BCLXL, BCL2, or BIM. These data, together with the observation that 60% of patients with t(11;14) myelomas who received venetoclax failed to achieve a partial response or better while 6% of non-t(11;14) patients did, argue against a direct role for CCND1 in venetoclax response.
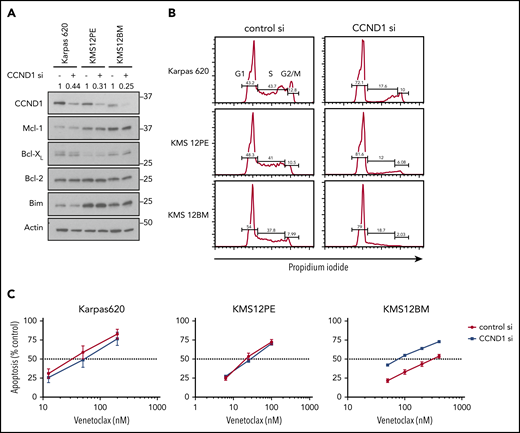
CCND1 knockdown does not induce resistance to venetoclax. (A) Protein lysates were prepared from cells 72 hours after nucleoporation with either control siRNA or CCND1 siRNA. Protein was subjected to sodium dodecyl sulfate–polyacrylamide gel electrophoresis and western blotting for CCND1, MCL1, BCLXL, BCL2, BIM, and ACTIN. Densitometry quantification of CCND1 relative to control siRNA and normalized to actin is shown for each cell line. (B) The same cells were fixed, permeabilized, and stained with propidium iodide to measure DNA content. Gates depict percentage of cells in G1, S, and G2/M. (C) Starting at 48 hours after siRNA nucleoporation, cells were treated with indicated doses of venetoclax for 24 hours followed by staining with Annexin V–fluorescein isothiocyanate to measure apoptosis. Data are presented as the mean ± standard error of 3 independent experiments.
CCND1 knockdown does not induce resistance to venetoclax. (A) Protein lysates were prepared from cells 72 hours after nucleoporation with either control siRNA or CCND1 siRNA. Protein was subjected to sodium dodecyl sulfate–polyacrylamide gel electrophoresis and western blotting for CCND1, MCL1, BCLXL, BCL2, BIM, and ACTIN. Densitometry quantification of CCND1 relative to control siRNA and normalized to actin is shown for each cell line. (B) The same cells were fixed, permeabilized, and stained with propidium iodide to measure DNA content. Gates depict percentage of cells in G1, S, and G2/M. (C) Starting at 48 hours after siRNA nucleoporation, cells were treated with indicated doses of venetoclax for 24 hours followed by staining with Annexin V–fluorescein isothiocyanate to measure apoptosis. Data are presented as the mean ± standard error of 3 independent experiments.
Identification of venetoclax-sensitive non-t(11;14) lines
To investigate other molecular mechanisms beyond t(11;14), we characterized the venetoclax sensitivity of 31 myeloma cell lines (Figure 2A). The cell lines segregated into 2 distinct groups, venetoclax-sensitive (IC50 <200 nM) and venetoclax-resistant (IC50 >500 nM), with only KMS28 being of somewhat intermediate sensitivity. Consistent with clinical trial data, 54% (6 of 11) of the t(11;14) cell lines were venetoclax sensitive compared with 10% (2 of 20) of the non-t(11;14) lines. For PCM6, an IL-6–dependent line, venetoclax sensitivity was observed only in the absence of IL-6. Coculture with IL-6 increased the venetoclax IC50 by >20-fold (supplemental Figure 1), consistent with our previous data showing a role for IL-6 in venetoclax resistance.24
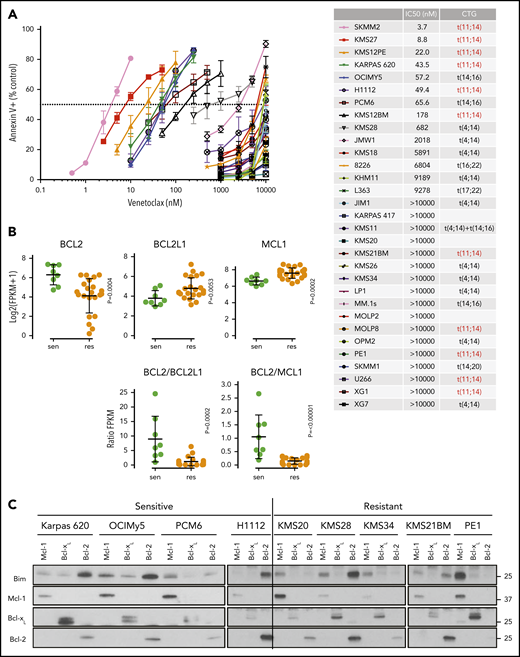
Characterization of venetoclax sensitivity and the BCL2 family in myeloma cell lines. (A) Cells were treated with indicated doses of venetoclax for 24 hours followed by staining with Annexin V–fluorescein isothiocyanate to measure apoptosis. The table lists calculated IC50 and cytogenetics (CTG) of each cell line. (B) RNA expression of BCL2, BCL2L1, and MCL1 in sensitive (green) and resistant (orange) cell lines as measured by RNA-sequencing, as well as calculated BCL2/BCL2L1 and BCL2/MCL1 ratios. (C) Protein lysates from 4 sensitive (Karpas 620, OCI-My5, PCM6, and H1112) and 5 resistant (KMS20, KMS28, KMS34, KMS21BM, and PE1) cell lines were prepared and then subjected to coimmunoprecipitation with anti-MCL1, anti-BCLXL, and anti-BCL2 antibodies. The resulting protein complexes were examined by western blot analysis using anti-BIM, anti-MCL1, anti-BCLXL, and anti-BCL2. (D) Protein expression of BIM, BAK, BAX, MCL1, BCLXL, BCL2, and actin from Cas9 parental cells or CRISPR knockout of BIM, BAK, BAX, or BAK and BAX in KMS12PE or OCI-My5. (E) Cells from panel D were treated with indicated doses of venetoclax for 24 hours followed by staining with Annexin V–fluorescein isothiocyanate to measure apoptosis. Data are presented in panels A and E as the mean ± standard error of 3 independent experiments. DKO, double knockout; FPKM, fragments per kilobase of transcript per million mapped reads; KO, knockout; WT, wild type.
Characterization of venetoclax sensitivity and the BCL2 family in myeloma cell lines. (A) Cells were treated with indicated doses of venetoclax for 24 hours followed by staining with Annexin V–fluorescein isothiocyanate to measure apoptosis. The table lists calculated IC50 and cytogenetics (CTG) of each cell line. (B) RNA expression of BCL2, BCL2L1, and MCL1 in sensitive (green) and resistant (orange) cell lines as measured by RNA-sequencing, as well as calculated BCL2/BCL2L1 and BCL2/MCL1 ratios. (C) Protein lysates from 4 sensitive (Karpas 620, OCI-My5, PCM6, and H1112) and 5 resistant (KMS20, KMS28, KMS34, KMS21BM, and PE1) cell lines were prepared and then subjected to coimmunoprecipitation with anti-MCL1, anti-BCLXL, and anti-BCL2 antibodies. The resulting protein complexes were examined by western blot analysis using anti-BIM, anti-MCL1, anti-BCLXL, and anti-BCL2. (D) Protein expression of BIM, BAK, BAX, MCL1, BCLXL, BCL2, and actin from Cas9 parental cells or CRISPR knockout of BIM, BAK, BAX, or BAK and BAX in KMS12PE or OCI-My5. (E) Cells from panel D were treated with indicated doses of venetoclax for 24 hours followed by staining with Annexin V–fluorescein isothiocyanate to measure apoptosis. Data are presented in panels A and E as the mean ± standard error of 3 independent experiments. DKO, double knockout; FPKM, fragments per kilobase of transcript per million mapped reads; KO, knockout; WT, wild type.
Using existing RNA-sequencing data, we analyzed the RNA expression of BCL2, BCL2L1 (BCLXL), and MCL1 in sensitive vs resistant cell lines. In sensitive lines, BCL2 expression was statistically higher, whereas BCL2L1 and MCL1 expression was statistically lower; there was a significant degree of overlap, however (Figure 2B). The BCL2/BCL2L1 and BCL2/MCL1 ratios have also previously been reported to correlate with venetoclax sensitivity.20,22,23,33 We observed a similar correlation for RNA expression and protein expression in a subset of 13 of these lines (supplemental Figure 2). However, as with the RNA expression, these ratios were only predictive in approximately one-half of the sensitive lines tested. We have previously shown that the distribution of BIM binding to anti-apoptotic proteins may also predict venetoclax response.17,21,24 We therefore performed immunoprecipitation of MCL1, BCLXL, and BCL2 and measured the amount of coprecipitating BIM in a subset of cell lines. As expected, venetoclax-sensitive lines showed increased binding of BIM to BCL2, whereas venetoclax-resistant lines typically exhibited more BIM bound to MCL1 (Figure 2C). Although this finding is in general consistent with our previous observations, the correlation is not absolute, and there are exceptions such as PCM6 and KMS28.
Among the cell lines tested, KMS26 and LP1 have biallelic loss of BIM, complete absence of BIM expression (supplemental Figure 3), and are highly resistant to venetoclax (Figure 2A). To further characterize the contribution of BIM to venetoclax sensitivity, we performed CRISPR knockout of BIM and the effector proteins BAK and BAX in 2 venetoclax-sensitive cell lines (Figure 2D). Loss of BIM, BAK, and/or BAX had no effect on expression of BCL2, while BCLXL and MCL1 expression increased slightly in some of the knockouts. In both KMS12PE and OCIMy5, BIM knockout partially blocked the response to venetoclax (Figure 2E), suggesting both BIM-dependent and BIM-independent mechanisms of action. In these BIM-deficient cells, other pro-apoptotic proteins such as BID or PUMA may substitute for BIM, or alternatively BCL2 may directly bind and inhibit activated BAX.34 Coimmunoprecipitation in KMS27, which does not express detectable levels of BIM (supplemental Figure 2) but is highly sensitive to venetoclax, showed that PUMA is associated with BCL2 and could therefore contribute to venetoclax sensitivity in the absence of BIM (supplemental Figure 4). The individual roles of BAK and BAX in each cell line were more variable, whereas double knockout of both BAK and BAX completely abolished cell death in the presence of venetoclax.
Venetoclax-sensitive myeloma expresses B cell–associated genes
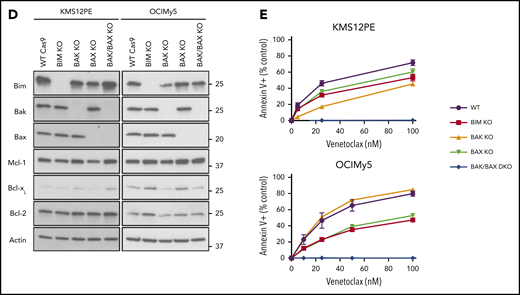
We next analyzed RNA-sequencing data in these 31 cell lines to search for differentially expressed genes that may be driving the BCL2 dependence in venetoclax-sensitive myeloma. This search identified 261 genes with a greater than twofold change in expression and a false discovery rate (FDR) <0.05 (Figure 3A; supplemental Table 1). We performed a similar analysis on CD138+ plasma cells purified from 25 primary myeloma samples to validate our findings in cell lines. These samples were treated ex vivo with a range of venetoclax concentrations to determine sensitivity (IC50 < 100 nM) or resistance (supplemental Table 2). We have previously shown that ex vivo testing correlates well with clinical response.28 Among the 10 patients treated with venetoclax used for this analysis, 9 had samples immediately before treatment, and ex vivo testing correctly predicted the response in 8. Overall, 70% of t(11;14) and 33% of non-t(11;14) samples were venetoclax sensitive.
Increased expression of B-cell markers in venetoclax-sensitive myeloma. RNA-sequencing heat map of genes with more than twofold differential expression and FDR <0.05 from cell lines (A) and patient samples (B). Sensitive (green) and resistant (orange) cell lines are denoted by colored boxes above the heat map. Presence of t(11;14) or t(4;14) is indicated by black boxes. To the left of the heat map, genes overexpressed in sensitive cell lines are labeled in green, and genes overexpressed in resistant lines are labeled in orange. (C) Enrichment of upregulated genes from venetoclax-sensitive myeloma cell lines in venetoclax-sensitive patient samples by GSEA. (D) Scatter plot of all genes and corresponding log twofold change in sensitive vs resistant patient samples (x-axis) and cell lines (y-axis). Genes statistically significant in both data sets or one data set are highlighted in red or black, respectively. (E) RNA expression of BCL2, BCL2L1, and MCL1 as well as calculated BCL2/BCL2L1 and BCL2/MCL1 RNA ratios in sensitive (green) and resistant (orange) cell lines. (F) Enrichment of B-cell signature genes and the Zhan CD2 expression signature in venetoclax-sensitive cell lines and patient samples by GSEA. FC, fold change; GX, gene expression; NES, normalized enrichment score.
Increased expression of B-cell markers in venetoclax-sensitive myeloma. RNA-sequencing heat map of genes with more than twofold differential expression and FDR <0.05 from cell lines (A) and patient samples (B). Sensitive (green) and resistant (orange) cell lines are denoted by colored boxes above the heat map. Presence of t(11;14) or t(4;14) is indicated by black boxes. To the left of the heat map, genes overexpressed in sensitive cell lines are labeled in green, and genes overexpressed in resistant lines are labeled in orange. (C) Enrichment of upregulated genes from venetoclax-sensitive myeloma cell lines in venetoclax-sensitive patient samples by GSEA. (D) Scatter plot of all genes and corresponding log twofold change in sensitive vs resistant patient samples (x-axis) and cell lines (y-axis). Genes statistically significant in both data sets or one data set are highlighted in red or black, respectively. (E) RNA expression of BCL2, BCL2L1, and MCL1 as well as calculated BCL2/BCL2L1 and BCL2/MCL1 RNA ratios in sensitive (green) and resistant (orange) cell lines. (F) Enrichment of B-cell signature genes and the Zhan CD2 expression signature in venetoclax-sensitive cell lines and patient samples by GSEA. FC, fold change; GX, gene expression; NES, normalized enrichment score.
Differential expression analysis revealed 147 genes with a twofold change in expression and FDR <0.05 (Figure 3B; supplemental Table 3). To evaluate the similarity in differentially expressed genes from cell lines and patient samples, we tested patient sample data using gene set enrichment analysis (GSEA) and gene sets consisting of the upregulated and downregulated genes in the cell lines. The genes upregulated in venetoclax-sensitive cell lines were also highly enriched in the venetoclax-sensitive patient samples (FDR = 0.00038) (Figure 3C), suggesting a shared molecular program. When we examined the fold changes in gene expression between venetoclax-sensitive and venetoclax-resistant samples, the correlation between cell lines and patient samples was highly statistically significant (P = 8.7 × 10−36) (Figure 3D). Six protein-encoding genes were statistically significant in both data sets. VPREB3, CCR7, SORL1, and TRABD2A were upregulated, whereas EFEMP1 and TDO2 were downregulated. Unlike the cell lines, expression of BCL2, BCL2L1, and MCL1 did not differ between sensitive and resistant patient samples, nor did the BCL2/BCL2L1 and BCL2/MCL1 ratios (Figure 3E).
To further characterize the expression differences between sensitive and resistant myeloma, GSEA was performed by using curated gene sets. Strikingly, 3 independent gene sets defined by B-cell genes downregulated as normal B cells differentiated to plasma cells were enriched in both venetoclax-sensitive cell lines and patient samples, indicating that these myelomas have retained at least part of the B-cell expression program normally deactivated in plasma cells (Figure 3F).35-37 Two of the 5 top differentially expressed genes in the cell lines were B cell–related (MS4A1 and CD79A), as was the top differentially expressed gene in the patient samples (VPREB3). Gene ontology analysis revealed B-cell receptor signaling components to be enriched as well (supplemental Figure 5). Interestingly, GSEA also exhibited enrichment of the CD2 gene expression profile previously defined by Zhan et al.38 The CD2 subset includes t(11;14) myeloma as well as some t(14;16) but is also characterized by coexpression of B-cell genes such as MS4A1, CD79A, PIK3AP1, and VPREB3.
Notably, the plasma cell lineage transcription factors PRDM1 (BLIMP1), IRF4, and XBP1 were constitutively expressed at similar levels among all of the sensitive and resistant lines (supplemental Figure 6A). Aggregate CCND1 expression in the sensitive and resistant groups did not differ significantly, suggesting that t(11;14) alone cannot account for differences in venetoclax response (supplemental Figure 6B). Among the genes most highly overexpressed in venetoclax-resistant lines were FAM171A1 and WWC2 (supplemental Figure 6C). These genes are part of the MS gene expression profile of Zhan et al,38 which is dominated by t(4;14) myeloma, suggesting that some of the genes upregulated in resistant cell lines may be a reflection of the overrepresentation of t(4;14) in this group.
We focused our attention on some of the B-cell genes in these gene sets, including MS4A1, PIK3AP1, VPREB3, CD79A, STAT5A, and RASGRP2 (Figure 4A-B). These genes were not consistently expressed in all of the sensitive cell lines, suggesting that no single marker can discriminate sensitive from resistant cells. In patient samples, genes from the CD2 subset, including VPREB3, SORT1, and BEND5, were more consistently expressed in sensitive samples, though again not universally (Figure 4C-D). Additional upregulated B-cell genes included CXCR5, IL4R, and REL. We confirmed the expression of RASGPR2 and STAT5A, as well as BTK, another B-cell gene that did not reach statistical significance, by western blot in a subset of cell lines (Figure 5A). These proteins were expressed almost exclusively in sensitive cell lines regardless of t(11;14) status, although not uniformly. To determine how these B cell–related proteins correlate with response compared with t(11;14), we performed the same western blots on all 11 of our t(11;14) lines. All 6 sensitive lines expressed detectable levels of either STAT5A, RASGRP2, or BTK, whereas only 1 of the 5 resistant lines expressed BTK (supplemental Figure 7). We also confirmed expression of CD20 and CD79A by flow cytometry and simultaneously examined a number of other B-cell (CD45) and plasma cell (CD138, CD38, CD28, SLAMF7, and IL6R) markers, as well as CD86 (which can be expressed on both cell types) (Figure 5B). Nonsupervised clustering correctly grouped the cell lines into sensitive and resistant based solely on the cell surface expression of these markers, suggesting that a panel of flow cytometry markers such as this may serve as an alternative biomarker for venetoclax response.
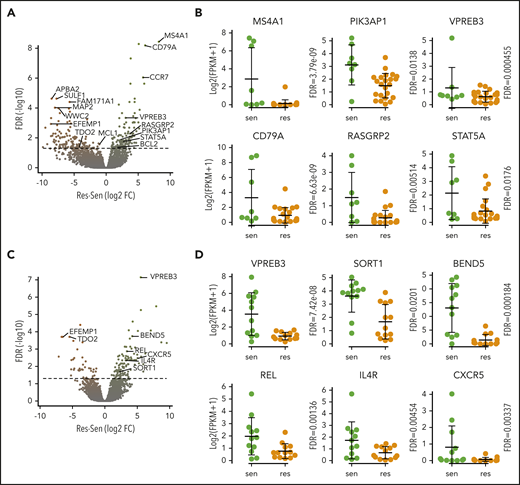
Expression of B-cell genes in venetoclax-sensitive myeloma cell lines and patient samples. (A) Volcano plot of all genes from differential expression analysis in cell lines. Dashed line is FDR = 0.05. (B) RNA expression of selected B-cell and CD2 genes overexpressed in sensitive (green) compared with resistant (orange) cell lines. (C) Volcano plot of all genes from differential expression analysis in patient samples. Dashed line is FDR = 0.05. (D) RNA expression of selected B-cell and CD2 genes overexpressed in sensitive (green) compared with resistant (orange) samples. res, resistant; sen, sensitive.
Expression of B-cell genes in venetoclax-sensitive myeloma cell lines and patient samples. (A) Volcano plot of all genes from differential expression analysis in cell lines. Dashed line is FDR = 0.05. (B) RNA expression of selected B-cell and CD2 genes overexpressed in sensitive (green) compared with resistant (orange) cell lines. (C) Volcano plot of all genes from differential expression analysis in patient samples. Dashed line is FDR = 0.05. (D) RNA expression of selected B-cell and CD2 genes overexpressed in sensitive (green) compared with resistant (orange) samples. res, resistant; sen, sensitive.
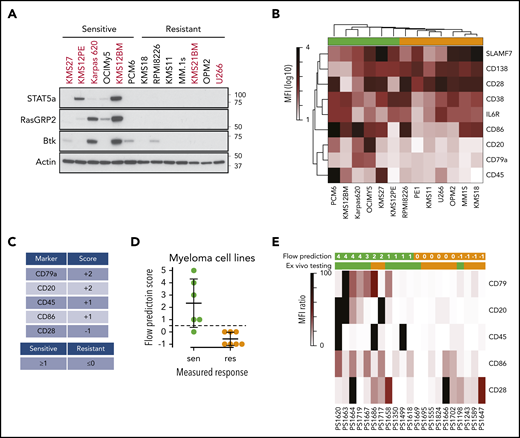
Expression of B-cell genes in venetoclax-sensitive myeloma patient samples. (A) Western blot of STAT5A, RASGRP2, BTK, and ACTIN in a subset of cell lines. (B) Heat map representing mean fluorescent intensity (MFI) of cell surface markers averaged from 3 independent experiments. Sensitive (green) and resistant (orange) cell lines are denoted by colored boxes above the heat map. (C) Scoring system for flow-based markers. (D) Application of scores to myeloma cell lines from panel B. The dashed line represents the cutoff for sensitivity vs resistance. (E) Heat map of cell surface marker expression in patient samples. The top row of green (sensitive) and orange (resistant) boxes denotes the flow-based score and prediction for venetoclax response. The second row of boxes represents the prediction from ex vivo testing.
Expression of B-cell genes in venetoclax-sensitive myeloma patient samples. (A) Western blot of STAT5A, RASGRP2, BTK, and ACTIN in a subset of cell lines. (B) Heat map representing mean fluorescent intensity (MFI) of cell surface markers averaged from 3 independent experiments. Sensitive (green) and resistant (orange) cell lines are denoted by colored boxes above the heat map. (C) Scoring system for flow-based markers. (D) Application of scores to myeloma cell lines from panel B. The dashed line represents the cutoff for sensitivity vs resistance. (E) Heat map of cell surface marker expression in patient samples. The top row of green (sensitive) and orange (resistant) boxes denotes the flow-based score and prediction for venetoclax response. The second row of boxes represents the prediction from ex vivo testing.
Given the challenges with routinely applying ex vivo testing or RNA-sequencing data clinically, we sought to evaluate this panel of flow markers in patient samples. To further simplify the prediction of sensitive vs resistant samples, we developed a scoring system based on the 5 most variably expressed markers in the cell lines: CD20, CD28, CD45, CD79a, and CD86. CD20 and CD79a were expressed only on sensitive cell lines and were therefore assigned 2 points, CD45 and CD86 were expressed on more sensitive than resistant cell lines and therefore assigned 1 point, and CD28 was expressed on more resistant than sensitive cell lines and therefore assigned −1 point (Figure 5C). After taking the sum of these scores, any total ≥1 was considered sensitive, whereas any score of 0 or −1 was considered resistant. When we apply this scoring system to the cell lines, it correctly predicted the response in 12 of 13 lines (Figure 5D). We then applied this process to 21 banked myeloma samples that we had previously tested for venetoclax sensitivity ex vivo (supplemental Table 4). A marker was considered positive only if its expression was increased 10-fold over unstained cells (supplemental Figure 8). We then calculated a score for each sample based on positive or negative staining of all 5 markers (Figure 5E; supplemental Table 5). The flow prediction score correlated with ex vivo testing in 17 of 21 samples, with a sensitivity of 82%, a specificity of 80%, and P = .0089 by Fisher’s exact test, suggesting this flow panel may be a clinically applicable approach to predicting venetoclax response. Of the patients in this group, 7 received venetoclax therapy. The flow prediction score matched the ex vivo testing in all 7 and correctly predicted the clinical response in 6 of 7.
Chromatin accessibility in venetoclax-sensitive myeloma shares similarities with B cells
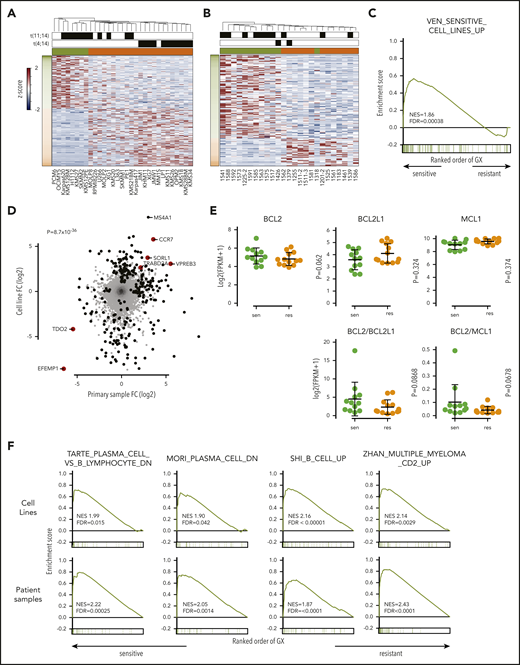
The prevalence of B cell–related genes expressed in venetoclax-sensitive cells suggested that sensitivity may be determined in part by a failure to downregulate B cell–associated pathways or differentiation state. As a measure of differentiation state, ATAC-sequencing was performed on 7 sensitive and 14 resistant cell lines. Differentially accessible peaks were determined revealing 1587 and 557 regions more accessible in venetoclax-sensitive and venetoclax-resistant cells, respectively (Figure 6A; supplemental Table 6). To directly compare gene expression vs the epigenetic state of venetoclax-sensitive vs venetoclax-resistant cells, we analyzed chromatin-accessible regions within 1 MB of each of the 261 venetoclax differentially expressed genes. This yielded 33 140 comparisons, with 928 regions being significantly (FDR <0.05; fold change ≥2) correlated with gene expression (supplemental Figure 9A). Chromatin accessibility at 151 of these regions was also associated with venetoclax resistance (orange) or sensitivity (green). Examples of the correlation between accessibility and gene expression are shown for the upregulated B-cell gene MS4A1 and the downregulated gene SULF1 (supplemental Figure 9B).
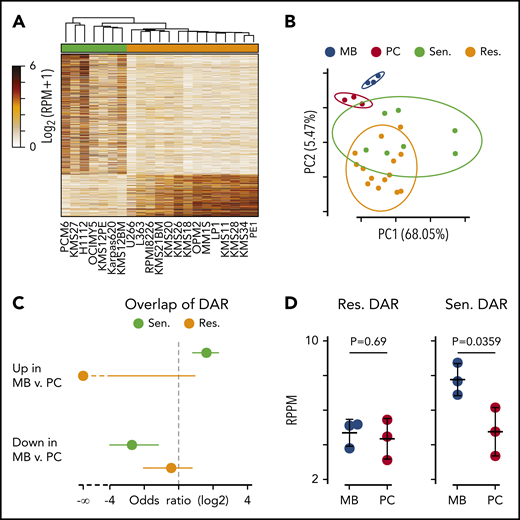
Differential chromatin accessibility in sensitive and resistant cell lines. (A) Heat map of all differentially accessible peaks. (B) Principle component analysis of ex vivo differentiated memory B (MB; blue) and plasma cells (PC; red) compared with myeloma cells resistant (orange) and sensitive (green) to venetoclax. The percentage of variation explained by each principle component is shown in parenthesis on the axes labels, and the 90% confidence interval of the standard deviation for each group is denoted by an ellipse. (C) Odds ratio of overlap of venetoclax-sensitive (green) and venetoclax-resistant (orange) myeloma cell differentially accessible regions (DAR) with those between MB and PC. Error bars denote the 95% confidence interval calculated by using a two-sided Fisher’s exact test. (D) Average chromatin accessibility of MB and PC at regions more accessible in venetoclax-resistant (left) and venetoclax-sensitive (right) cells. P values were calculated by using a two-sided Student t test. RPM, reads per million mapped reads; RPPM, reads per peak per million.
Differential chromatin accessibility in sensitive and resistant cell lines. (A) Heat map of all differentially accessible peaks. (B) Principle component analysis of ex vivo differentiated memory B (MB; blue) and plasma cells (PC; red) compared with myeloma cells resistant (orange) and sensitive (green) to venetoclax. The percentage of variation explained by each principle component is shown in parenthesis on the axes labels, and the 90% confidence interval of the standard deviation for each group is denoted by an ellipse. (C) Odds ratio of overlap of venetoclax-sensitive (green) and venetoclax-resistant (orange) myeloma cell differentially accessible regions (DAR) with those between MB and PC. Error bars denote the 95% confidence interval calculated by using a two-sided Fisher’s exact test. (D) Average chromatin accessibility of MB and PC at regions more accessible in venetoclax-resistant (left) and venetoclax-sensitive (right) cells. P values were calculated by using a two-sided Student t test. RPM, reads per million mapped reads; RPPM, reads per peak per million.
To test whether chromatin accessibility of venetoclax-sensitive myeloma cells more closely resembled that of B cells, we compared our ATAC data vs data generated from ex vivo differentiated memory B cells and plasma cells by Jin et al.39 Principle component analysis showed that memory B cells (blue) clustered distinctly from plasma cells (red) (Figure 6B). Similarly, venetoclax-sensitive cells (green) tended to separate from venetoclax-resistant cells (orange). Interestingly, the centroid vector of venetoclax-sensitive cells relative to venetoclax-resistant cells mirrored that seen between memory B cells and plasma cells. To more directly compare the differentially accessible regions between venetoclax-sensitive and venetoclax-resistant myeloma cells vs those found between memory B cells and plasma cells, we computed the overlap and found that regions more accessible in venetoclax-sensitive cells had a significant overlap with regions more accessible in memory B cells as depicted by a positive odds ratio (Figure 6C, top). These same regions that were more accessible in venetoclax-sensitive cells were also depleted in regions more accessible in plasma cells compared with memory B cells (Figure 6C, bottom). Finally, when we compared the venetoclax-resistant differentially accessible regions, there was no difference in accessibility between memory B and plasma cells (Figure 6D, left); however, those regions more accessible in venetoclax-sensitive cells had significantly higher accessibility in the memory B cells compared with plasma cells (Figure 6D, right).
Venetoclax-sensitive myeloma displays increased chromatin accessibility at binding sites for the B-cell transcription factor BATF
To better understand the transcription factors that may be driving differences in chromatin accessibility between venetoclax-sensitive and venetoclax-resistant cells, we analyzed transcription factor motifs enriched in differentially accessible regions relative to all regions found to be accessible. This identified E2A and IRF4 motifs among others as enriched in regions more accessible in venetoclax-resistant lines (Figure 7A). However, examining E2A motifs genome-wide, the transcription factor footprint appears similar between venetoclax-sensitive and venetoclax-resistant lines (Figure 7B). This indicates that although there was a significant enrichment of E2A motifs in venetoclax-resistant differentially accessible sites (347 of 557), there is no global change at genomic regions containing E2A motifs (60 526 of 139 899 total accessible sites). In contrast, the motif-binding sites enriched in regions more accessible in venetoclax-sensitive cells were all basic leucine zipper domain–containing factors, which notably include the AP-1 family of transcription factors such as BATF (Figure 7C). Transcription factor footprinting at all BATF-binding motifs (29 969 of 139 899 total accessible sites) showed an increase in accessibility in venetoclax-sensitive cells (Figure 7D). Although the AP-1 transcription factor–binding motif is shared among multiple family members, BATF specifically is expressed in activated B cells, prompting us to examine its ability to regulate BCL2 dependence more closely.40 We therefore used CRISPR activation to overexpress BATF in the venetoclax-resistant cell line KMS11 (Figure 7E). Remarkably, increased BATF expression from 2 independent guides increased sensitivity to venetoclax compared with 2 control guides (Figure 7F). This increased sensitivity occurred without changes in expression of BIM, BCL2, BCLXL, or MCL1. These results suggest that a BATF-mediated transcriptional program may contribute to venetoclax response in multiple myeloma and is consistent with venetoclax-sensitive plasma cells having a more B cell–like phenotype. Cumulatively, these data indicate that in addition to BCL2 dependence, venetoclax-sensitive myeloma retains other aspects of B-cell gene expression and chromatin accessibility and that these patterns may serve as a biomarker for venetoclax response in myeloma.
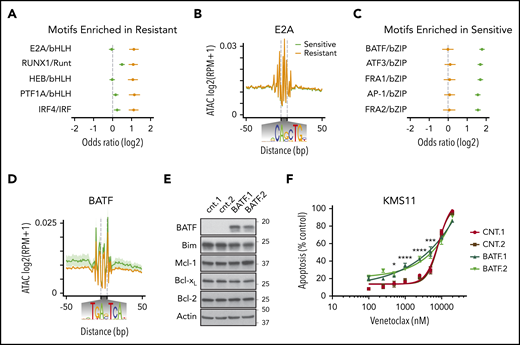
BATF overexpression increases sensitivity to venetoclax. (A) Transcription factor motifs enriched in resistant cell lines. (B) Genome-wide E2A transcription factor footprint. (C) Transcription factor motifs enriched in sensitive cell lines. (D) Genome-wide BATF transcription factor footprint. (E) Protein expression of BATF, BIM, MCL1, BCLXL, BCL2, and ACTIN in cell lines expressing 2 independent control guides (cnt.1 and cnt.2) or 2 independent guides to BATF (BATF.1 and BATF.2) for CRISPR activation in dCAS9-VP64 expressing KMS11. (F) Cells were treated with indicated doses of venetoclax for 24 hours followed by staining with Annexin V–fluorescein isothiocyanate to measure apoptosis. Data are presented as the mean ± standard error of 3 independent experiments. Statistics were calculated by using two-way analysis of variance followed by Dunnett’s multiple comparison test. *P < .05; ***P < .001; ****P < .0001.
BATF overexpression increases sensitivity to venetoclax. (A) Transcription factor motifs enriched in resistant cell lines. (B) Genome-wide E2A transcription factor footprint. (C) Transcription factor motifs enriched in sensitive cell lines. (D) Genome-wide BATF transcription factor footprint. (E) Protein expression of BATF, BIM, MCL1, BCLXL, BCL2, and ACTIN in cell lines expressing 2 independent control guides (cnt.1 and cnt.2) or 2 independent guides to BATF (BATF.1 and BATF.2) for CRISPR activation in dCAS9-VP64 expressing KMS11. (F) Cells were treated with indicated doses of venetoclax for 24 hours followed by staining with Annexin V–fluorescein isothiocyanate to measure apoptosis. Data are presented as the mean ± standard error of 3 independent experiments. Statistics were calculated by using two-way analysis of variance followed by Dunnett’s multiple comparison test. *P < .05; ***P < .001; ****P < .0001.
Discussion
Multiple myeloma is a highly heterogeneous disease characterized by numerous recurrent translocations and mutations. This heterogeneity has made identifying biomarkers predictive of response challenging, and effective myeloma therapy such as immunomodulatory agents, proteasome inhibitors, and monoclonal antibodies do not target patient-specific genetics but rather the underlying biology of plasma cells.41 One notable exception has been venetoclax, which in numerous preclinical and clinical studies is consistently more effective in myeloma harboring the t(11;14) translocation.18,20,28 However, even among t(11;14) myeloma patients, the response rate is only 40% to 60%.20,42 Moreover, our observation that knockdown of CCND1 failed to induce resistance to venetoclax also suggests that t(11;14) and CCND1 do not have direct roles in venetoclax response.
To further explore the biology responsible for venetoclax sensitivity in myeloma and to potentially identify additional biomarkers, we analyzed RNA-sequencing and ATAC-sequencing data from cell lines and patient samples. Expression of plasma cell transcription factors and cell surface markers show that all of the myeloma cell lines and patient samples we studied are phenotypically consistent with differentiated plasma cells. However, venetoclax-sensitive myeloma is enriched for B cell–associated genes that are typically not expressed in plasma cells. The expression of these genes could not be completely explained by t(11;14) because they were observed almost exclusively in venetoclax-sensitive t(11;14) and were mostly absent in venetoclax-resistant t(11;14). No single gene was consistently expressed in all of the sensitive cell lines or patient samples, suggesting it may take a panel of genes or cell surface markers to distinguish sensitive and resistant myeloma. It also suggests that these cells have only a portion of the B-cell program active and are not functionally B cells.
Our ATAC-sequencing analysis also identified a B cell–like chromatin accessibility pattern in venetoclax-sensitive cell lines, and moreover suggests increased binding of transcription factors at some of those accessible sites. Overexpression of one of these transcription factors, BATF, in KMS11 resulted in increased sensitivity to venetoclax. BATF is an essential transcription factor in B- and T-cell development that is activated upon B-cell receptor signaling, resulting in activation-induced deaminase expression and class switch recombination, although its expression and function in plasma cells is unclear.40 BATF both represses and promotes transcription depending on the presence of other transcription factors, including the plasma cell transcription factor IRF4, and could contribute to the venetoclax-sensitive transcription program in plasma cells through alterations in chromatin accessibility and without being differentially expressed itself. Thus, despite possessing the hallmarks of terminally differentiated plasma cells, venetoclax-sensitive myeloma retains or aberrantly reactivates aspects of the B-cell program, including BCL2 dependence that is normally downregulated during differentiation. Whether this B-cell program is present in a subset of normal plasma cells or is acquired during myelomagenesis remains an open question.
Venetoclax-sensitive myeloma also showed enrichment of the CD2 expression signature defined by Zhan et al38 in myeloma. The CD1 and CD2 subsets include most of the CCND1 and CCND3 translocated myeloma. However, the CD2 subset also includes a small proportion of t(14;16) myeloma and expression of B-cell genes such as MS4A1 (CD20), CD79A, VPREB3, and PIK3AP1. Given that the 2 non-t(11;14) venetoclax-sensitive cell lines, OCI-My5 and PCM6, are both t(14;16) and express B-cell markers, we hypothesize that the CD2 expression signature may be a better predictor of venetoclax sensitivity than t(11;14) alone. Most venetoclax trials are focused on t(11;14) patients, and therefore a subset of patients with high-risk t(14;16) who could respond to venetoclax is potentially being overlooked. By including CD20 and CD79A, our flow panel may better identify the CD2 subset without the need for gene expression analysis, which would also be required for measuring expression of BCL2 and other anti-apoptotic proteins, including MCL1 and BCL2L1 (BCLXL) that have been previously studied as biomarkers.18,22,33 Although both BCL2 expression and the BCL2/BC2L1 ratio are higher in venetoclax-sensitive cell lines and patients, they display a significant degree of overlap when comparing sensitive vs resistant samples, thus making it challenging to select a specific cutoff that would be useful for clinical decision-making.20,43 Once further validated, our flow prediction score may serve as a simpler and more easily accessible assay that could be used to identify venetoclax-sensitive myeloma independent of t(11;14).
All RNA-sequencing and ATAC-sequencing data will be made publicly available. The data reported in this article have been deposited in the Gene Expression Omnibus database (accession numbers GSE121912 and GSE167969).
The online version of this article contains a data supplement.
The publication costs of this article were defrayed in part by page charge payment. Therefore, and solely to indicate this fact, this article is hereby marked “advertisement” in accordance with 18 USC section 1734.
There is a Blood Commentary on this article in this issue.
Acknowledgments
The authors thank all the patients who agreed to donate research specimens for this study.
This study was supported in part by the Winship Cancer Institute (IRG-14-188-01) from the American Cancer Society; the National Cancer Institute, National Institutes of Health (grants R01 CA192844 and P30CA138292); and the MMRF Answer Fund. B.G.B. was supported by an American Cancer Society Post-doctoral Fellowship (PF-17-109-1-TBG), an MMRF Research Fellowship, and an American Society of Hematology Research Scholar Award. R.S. was supported by the International Myeloma Foundation and Lauri Strauss Leukemia Foundation.
Authorship
Contribution: V.A.G., B.G.B., and L.H.B. participated in conceptualization; V.A.G., B.G.B., S.M.M., B.O., and R.S. designed and performed experiments; D.L.J. reviewed patient clinical flow; J.J.K. provided cell lines, RNA-sequencing, and copy number variant data on cell lines; N.S.J., C.C.H., L.T.H., M.V.D., A.K.N., J.L.K., and S.L. provided patient samples; V.A.G. prepared the manuscript; and B.G.B., S.M.M., R.S., D.L.J., J.J.K., B.O., N.S.J., C.C.H., L.T.H., M.V.D., A.K.N., J.L.K., S.L., C.S.M., and L.H.B. assisted with review and editing of the manuscript.
Conflict-of-interest disclosure: R.S. receives a consulting fee from FIMECS, Inc. D.L.J. serves on the advisory board for eSquared Communications and Stemline Therapeutics. C.C.H. has received research grants from Oncolytics Biotech; research and personal grants from Janssen, BMS, Sanofi, Nektar, and Karyopharm; and personal grants from Imbrium and Oncopeptides. L.T.H. receives honorarium from Kite Pharmaceuticals. M.V.D. serves on advisory boards for Amgen, Janssen, Roche, and Genentech. A.K.N. has significant financial interest in Janssen Pharmaceuticals and has participated on advisory boards and received honoraria from Janssen, Takeda, Amgen, BMS/Celgene, GlaxoSmithKline, Oncopeptides, Spectrum Pharmaceuticals, and Adaptive Technologies. J.L.K. receives honoraria from Tecnofarma; receives research support from BMS, Janssen, Bluebird, Sutro Biopharma, Amgen, AbbVie, Fortis Therapeutics, and GlaxoSmithKline; reports consultancy for BMS and Janssen; and is on the data safety monitoring board for TG Therapeutics. S.L. has consulting or advisory roles with Celgene, Bristol Myers Squibb, Janssen Oncology, Novartis, GlaxoSmithKline, Amgen, AbbVie, Takeda, Merck, and Juno Therapeutics; and receives research funding from Celgene, Bristol Myers Squibb, and Takeda. L.H.B. receives research funding, consultancy, and honoraria from AstraZeneca; and performs consultancy for Genentech. The remaining authors declare no competing financial interests.
Correspondence: Lawrence H. Boise, Department of Hematology and Medical Oncology, Winship Cancer Institute of Emory University, Emory University School of Medicine, 1365 Clifton Rd NE, Room C4078, Atlanta, GA 30322; e-mail: lboise@emory.edu; or Vikas A. Gupta, Department of Hematology and Medical Oncology, Winship Cancer Institute of Emory University, Emory University School of Medicine, 1365 Clifton Rd NE, Room C4090, Atlanta, GA 30322; e-mail: vikas.gupta@emory.edu.

This feature is available to Subscribers Only
Sign In or Create an Account Close Modal