

Key Points
We comprehensively characterized AF10 FPs, identifying downstream transcriptional networks and protein interactors.
We show that AF10 FPs recruit the JAK1 kinase, which is required for the activation of downstream targets and leukemogenesis.

Abstract
Leukemias bearing fusions of the AF10/MLLT10 gene are associated with poor prognosis, and therapies targeting these fusion proteins (FPs) are lacking. To understand mechanisms underlying AF10 fusion-mediated leukemogenesis, we generated inducible mouse models of acute myeloid leukemia (AML) driven by the most common AF10 FPs, PICALM/CALM-AF10 and KMT2A/MLL-AF10, and performed comprehensive characterization of the disease using transcriptomic, epigenomic, proteomic, and functional genomic approaches. Our studies provide a detailed map of gene networks and protein interactors associated with key AF10 fusions involved in leukemia. Specifically, we report that AF10 fusions activate a cascade of JAK/STAT-mediated inflammatory signaling through direct recruitment of JAK1 kinase. Inhibition of the JAK/STAT signaling by genetic Jak1 deletion or through pharmacological JAK/STAT inhibition elicited potent antioncogenic effects in mouse and human models of AF10 fusion AML. Collectively, our study identifies JAK1 as a tractable therapeutic target in AF10-rearranged leukemias.
Introduction
A significant subset of human malignancies displays balanced chromosomal translocations or other genetic aberrations resulting in the formation of chimeric fusion oncoproteins.1 Because some recurrent fusion proteins (FPs) found in cancer cells are key drivers of oncogenic signaling, they can be attractive candidates for therapeutic targeting. This is illustrated by the success of: tyrosine kinase inhibitors against BCR-ABL fusions in chronic myelogenous leukemia2 ; ALK fusions in non–small cell lung carcinoma, T-cell anaplastic large cell lymphoma, and neuroblastoma (reviewed in Ducray et al3 ); TRK fusions in diverse malignancies (reviewed in Drilon4 ); and RET fusions.5 One reason these therapies have been successful is because they target kinases, a class of proteins now pharmacologically tractable due to development of clinically relevant small molecule inhibitors.6 Most other fusion oncoproteins, such as those involving transcription factors or chromatin regulators, have been difficult to target by traditional methods. One way of overcoming this hurdle is to identify molecular vulnerabilities arising from aberrant fusion oncoprotein expression in tumor cells. In this effort, defining tumor-promoting molecular pathways co-opted by fusion oncoproteins may help in the design of precise therapeutics against malignancies harboring those fusions.
The AF10/MLLT10 gene, located on chromosome 10, is recurrently involved in chromosomal translocations in T-cell acute lymphoblastic leukemia (T-ALL) and B-cell acute lymphoblastic leukemia as well as acute myeloid leukemia (AML).7-9 These translocations, which lead to the fusion of AF10, a chromatin-regulatory protein, to an N-terminal partner on another chromosome, are found in both children and adults (reviewed in Krivtsov and Armstrong,7 Muntean and Hess,8 and Caudell and Aplan9 ). AF10 fusions to the mixed-lineage leukemia (MLL) gene comprise 17% to 33% of all MLL fusions in childhood AML, making it the second most common MLL-fusion event in pediatric AML. Apart from MLL, AF10 also recurrently fuses to the CALM/PICALM gene on chromosome 11. Notably, in pediatric T-ALL, CALM-AF10 fusions are the most frequent gene-fusion events.10 Novel translocations in which AF10 is fused to several other partner genes have been described in both AML as well as in T-ALL.11-14
In AML, AF10 gene fusions are associated with adverse outcomes.15-17 AML patients with MLL-AF10 fusions show increased early morbidity, including leukocytosis-related complications, extramedullary disease, and a high risk of relapse.18 A study of pediatric AML patients with MLL-AF10 fusions observed that these patients had a median event-free survival of only 8 months.18 In a large multicenter international study of pediatric AML patients, it was demonstrated that MLL-AF10 fusions are independent predictors of unfavorable prognosis. Patients with MLL-AF10 fusions fare significantly worse than those with most other MLL fusions and are therefore often treated using high-risk protocols.19 In pediatric T-ALL, CALM-AF10 fusions are associated with early relapse and poor survival outcomes.20,21 Given that there are no clinically effective, precision medicine–based approaches available to treat these leukemias and that currently mandated therapies cause considerable, long-term toxicities, there is an urgent, clinically unmet need to identify specific, targeted therapies for leukemias bearing AF10 FPs. In this study, using a series of complementary approaches, we demonstrate the dependence of AF10 FPs on JAK/STAT-mediated inflammatory signaling for leukemogenesis and in doing so identify a clinically tractable pathway to treat these leukemias.
Methods
Cell culture
Human leukemia U937 and P31-Fujioka cells were cultured in RPMI 1640 medium supplemented with 2 mM l-glutamine and sodium pyruvate, 10% fetal bovine serum (FBS), and 50 U/mL penicillin/streptomycin (Thermo Fisher Scientific, Carlsbad, CA), and incubated in 5% CO2 at 37°C. Murine leukemia cells were cultured in Dulbecco modified Eagle medium (DMEM) supplemented with 2 mM l-glutamine, 15% FBS, and 50 U/mL penicillin/streptomycin, in the presence of the following cytokines: 10 ng/mL murine interleukin 6 (mIL-6), 6 ng/mL mIL3, and 20 ng/mL murine stem cell factor (mSCF) (all from PeproTech, Rocky Hill, NJ), and incubated in 5% CO2 at 37°C. 293T cells were cultured in DMEM supplemented with 2 mM l-glutamine and sodium pyruvate, 10% FBS, and 50 U/mL penicillin/streptomycin, and incubated in 5% CO2 at 37°C.
Plasmids
The CALM-AF10 and MLL-AF10 fusions described previously were cloned into murine stem cell virus (MSCV)-based vectors to generate the 3XFlag-CALM-AF10-IRES-tdTomato, 3XFlag-MLL-AF10-IRES-tdTomato, 3XFlag-TRE-CALM-AF10-IRES-tdTomato (iCALM-AF10), or 3XFlag-TRE-MLL-AF10-IRES-tdTomato (iMLL-AF10) plasmids.
Virus preparation
An ecotropic retroviral packaging plasmid was used with MSCV-based plasmids containing the gene of interest to make retrovirus. Packaging plasmids pMD2.G and psPAX2 were used with pLKO plasmids to make lentivirus carrying pLenti-guide RNA vector and luciferase reporter plasmid. Briefly, cotransfection was performed with packaging plasmids in 293T cells by polyethylenimine-based transfection and virus containing supernatant was harvested by filtering through a 0.45-μm filter after 48 and 72 hours. Virus was stored at −80°C until use.
Mouse bone marrow transformation and leukemia
Hematopoietic stem and progenitor cells (HSPCs) from wild-type or Jak1-floxed C57/Bl6 mice were isolated using the EasySep mouse hematopoietic progenitor cell isolation kit (StemCell Technologies, Vancouver, BC, Canada), which removes lineage marker–expressing cells with biotinylated antibodies directed against nonhematopoietic stem cells and nonprogenitor cells (CD5, CD11b, CD19, CD45R/B220, Ly6G/C [Gr-1], TER119, 7-4). Isolated cells were cultured in vitro for 24 hours in DMEM supplemented with 2 mM l-glutamine, 15% FBS, and 50 U/mL penicillin/streptomycin, in the presence of the following cytokines: 10 ng/mL mIL-6, 6 ng/mL mIL3, and 20 ng/mL mSCF in 5% CO2 at 37°C. Twenty-four hours later, these HSPCs were transduced with recombinant MSCV vectors containing 3XFlag-CALM-AF10-IRES-tdTomato (MIT-CALM-AF10), 3XFlag-MLL-AF10-IRES-tdTomato (MIT-MLL-AF10), 3XFlag-TRE-CALM-AF10-IRES-tdTomato (iCALM-AF10), or 3XFlag-TRE-MLL-AF10-IRES-tdTomato (iMLL-AF10) virus-containing medium. For CALM-AF10– or MLL-AF10–transformed BM cells, HSPCs were transduced with virus-containing supernatant from MIT-CALM-AF10 or MIT-MLL-AF10 plasmids and sorted for tdTomato+ cells after 5 days on a FACSAria II system (Becton Dickinson, La Jolla, CA). For generation of inducible leukemias, iCALM-AF10 or iMLL-AF10 cells were cotransduced with an MSCV plasmid containing the Tet-transactivator tTA linked to a 2a–blue fluorescent protein (BFP) fusion. Cells cotransduced with iCALM-AF10 or iMLL-AF10 and MSCV-tTA-2a-BFP were sorted for BFP and selected for 2 weeks using G418. In vitro–transformed cells were IV injected into sublethally irradiated mice (600 Gy) to generate leukemias.
Animal studies
One hundred microliters of 200 000 U937 human myeloid leukemia cells was mixed with 100 μL of cold Matrigel (Corning, Oneonta, NY) and subcutaneously injected into the flanks of 8-week-old female NOD/SCID mice (The Jackson Laboratory, Bar Harbor, ME). After tumors reached a size of 200 mm3, mice were treated with vehicle (benzyl alcohol, poloxamer 188, purified water, flavor, xanthan gum, and saccharin sodium) or Mepron by oral gavage (200 mg/kg per day) for 21 days. Mice were euthanized when the tumor volume reached 2000 mm3.
Results
Inducible mouse models of AF10 fusion-driven AML
AF10 FPs are implicated in transcriptional activation of oncogenic networks in AF10 rearranged (AF10-R) leukemia (reviewed in Caudell and Aplan9 ) although the underlying mechanisms driving leukemogenesis remain largely elusive. We generated tetracycline (Tet)-repressible (Tet-Off) mouse models of AML driven by the 2 most recurrent leukemia-associated AF10 FPs, namely CALM(PICALM)-AF10 and MLL(KMT2A)-AF10 (henceforth termed iCALM-AF10 and iMLL-AF10 AML, respectively). In the absence of Tet, retroviral expression of iCALM-AF10 or iMLL-AF10 in lineage-depleted bone marrow (BM)-derived HSPCs led to the formation of mostly undifferentiated blast-like colonies in vitro, which could be serially replated for at least 4 weeks (Figure 1A-B and data not shown). We reasoned that these Tet-Off models would be useful for discovery of potential AF10 fusion-regulated gene networks because doxycycline (Dox) treatment completely abrogates AF10 fusion gene expression (supplemental Figure 1A, available on the Blood Web site). Dox treatment of iCALM-AF10– and iMLL-AF10–transformed BM cells led to a highly significant decrease in the percentage of blast-like colonies by day 7, based on colony-forming unit (CFU) assays (Figure 1B). Injection of AF10 FP–transformed BM cells into sublethally irradiated syngenic mice gave rise to fully penetrant AML expressing predominantly myeloid markers Gr1 and Mac1, with a latency of 3 to 6 months in primary transplants (median of 16 weeks for iCALM-AF10 and 20 weeks for iMLL-AF10); infiltration of leukemia blasts in multiple organs including spleen, liver, etc (supplemental Figure 1B-D); and a latency of 2 to 3 weeks in secondary transplanted AML. Strikingly, despite potent proliferative and blast colony-forming capacity in vitro and leukemogenesis in vivo, AML cells derived from both primary and secondary AMLs retained their acute sensitivity to Dox-induced loss of AF10 FPs. Continued dependence of the leukemia cells on AF10 FP expression was most evident from the fact that administration of Dox-containing chow to terminally ill, secondary transplanted mice with iCALM-AF10 or iMLL-AF10 AML rapidly reversed disease symptoms. In the iCALM-AF10 model, there was a significant increase in disease latency, whereas in the iMLL-AF10 model, all of the Dox-fed mice remained disease and symptom free for up to 60 days post-Dox administration (Figure 1C). We then performed RNA-sequencing (RNA-seq) analysis to investigate transcriptome-wide changes following Dox-induced abrogation of AF10FP (iCALM-AF10 or iMLL-AF10) expression. Similar experiments were also performed with the iMLL-AF9 fusion oncogene. Importantly, these RNA-seq data on the 3 fusions can be used to distinguish targets of MLL fusions (common to MLL-AF10 and MLL-AF9) from targets of AF10 fusions (common to CALM-AF10 and MLL-AF10) (Figure 1D-E). Genes downregulated when the leukemia-associated FPs were switched off were termed candidate “target genes” (supplemental Table 1). Most of the common targets of the 3 leukemic FPs were developmental transcription factors that have previously been implicated in leukemogenesis including Hoxa cluster genes (Hoxa5, Hoxa7, Hoxa9, and Hoxa10), Meis1, and Six1, as well as other genes not previously implicated in AML, including Ssbp2, Cnksr3, and Nt5e (Figure 1E; supplemental Figure 1E; supplemental Table 1).
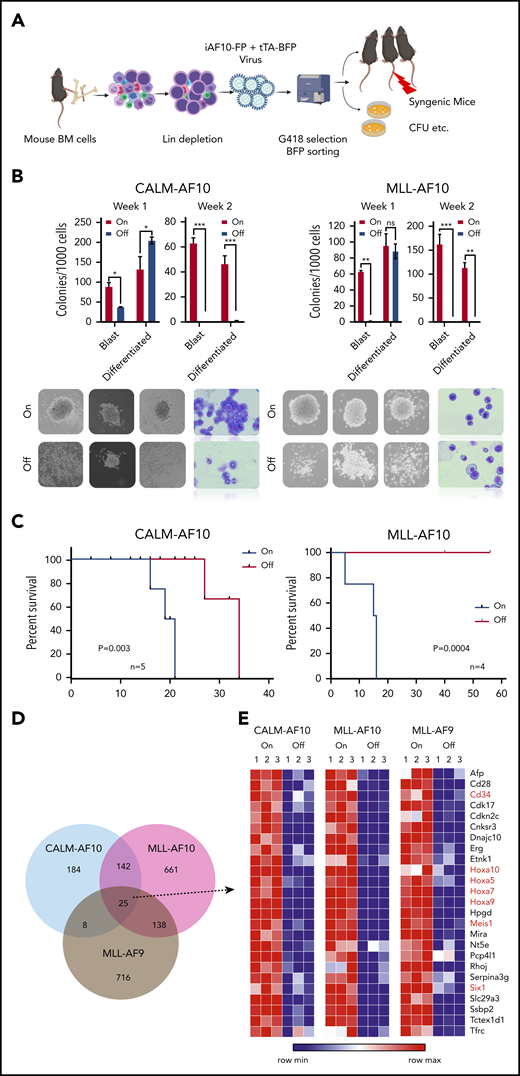
Inducible models of AF10 FP AML. (A) Schematic representation of the BM transplantation model (see “Methods” for detailed description). (B) Number of blast-like and differentiated colonies in 2 serial replatings in AF10-fusion expressing dimethyl sulfoxide (DMSO)-treated cells (On) and Dox-treated AF10-fusion (Off) preleukemia cells are shown. *P < .05; **P < .005; ***P < .01. P values were calculated using the Student t test. iCALM-AF10 colonies are show on the left panel and iMLL-AF10 on the right. Representative images of colonies from indicated AF10 fusion-transformed BM cells with DMSO (AF10 fusion-On) compared with Dox-treated (AF10 fusion-Off) are shown below (original magnification ×10). Also shown are Wright-Giemsa–stained cytospins from the different indicated conditions (original magnification ×40). (C) Kaplan-Meier survival curves for secondary mice with the iCALM-AF10 fusion AMLs (CALM-AF10-On) administered normal chow compared with (iCALM-AF10-Off) mice administered Dox chow are shown in the left panel and for iMLL-AF10 mice is shown on the right panel. Number of mice in each group and P value of differences between 2 groups (log-rank Mantel-Cox test) are shown. (D) Number of genes significantly downregulated (P < .05) when the respective fusion oncoproteins were switched-off using Dox within 48 hours are shown, with overlaps displayed in the Venn diagram. (E) Heatmaps for the 25 genes downregulated by all the 3 indicated AML-associated FPs are shown with gene names. Genes previously implicated in leukemia stem cell biology are marked in red.
Inducible models of AF10 FP AML. (A) Schematic representation of the BM transplantation model (see “Methods” for detailed description). (B) Number of blast-like and differentiated colonies in 2 serial replatings in AF10-fusion expressing dimethyl sulfoxide (DMSO)-treated cells (On) and Dox-treated AF10-fusion (Off) preleukemia cells are shown. *P < .05; **P < .005; ***P < .01. P values were calculated using the Student t test. iCALM-AF10 colonies are show on the left panel and iMLL-AF10 on the right. Representative images of colonies from indicated AF10 fusion-transformed BM cells with DMSO (AF10 fusion-On) compared with Dox-treated (AF10 fusion-Off) are shown below (original magnification ×10). Also shown are Wright-Giemsa–stained cytospins from the different indicated conditions (original magnification ×40). (C) Kaplan-Meier survival curves for secondary mice with the iCALM-AF10 fusion AMLs (CALM-AF10-On) administered normal chow compared with (iCALM-AF10-Off) mice administered Dox chow are shown in the left panel and for iMLL-AF10 mice is shown on the right panel. Number of mice in each group and P value of differences between 2 groups (log-rank Mantel-Cox test) are shown. (D) Number of genes significantly downregulated (P < .05) when the respective fusion oncoproteins were switched-off using Dox within 48 hours are shown, with overlaps displayed in the Venn diagram. (E) Heatmaps for the 25 genes downregulated by all the 3 indicated AML-associated FPs are shown with gene names. Genes previously implicated in leukemia stem cell biology are marked in red.
AF10 FPs drive potent activation of inflammatory signaling
An unbiased analysis of genes significantly associated with CALM-AF10 expression (supplemental Table 1 CALM-AF10 target genes) revealed these genes to be strikingly enriched in signatures related to cytokine signaling, cytokine receptor activity, interferon signaling, and innate immunity (Figure 2A-B). An Ingenuity pathway analysis of CALM-AF10 target genes showed highly significant enrichment for the JAK/STAT-mediated cytokine-signaling pathway (P: 1.48E-13) and revealed NF-κB and STAT1/3 proteins as predicted upstream regulators of CALM-AF10 target genes (supplemental Figure 2A). Similar results were also obtained for MLL-AF10 target genes (supplemental Figure 2B). Consistent with these data, mapping of H3K27 acetylated superenhancers in CALM-AF10-On vs CALM-AF10-Off states (supplemental Table 2) demonstrated association of CALM-AF10 fusion expression with activation of a large number of superenhancers at genes associated with inflammatory signaling (−log10 P = −12.6; supplemental Figure 2C). Because we were most interested in AF10 FP target genes, we focused on the subset of genes commonly downregulated when CALM-AF10 or MLL-AF10 FPs (supplemental Table 1 AF10 FP target genes), but not MLL-AF9, were turned off. These factors, which we term AF10 fusion target genes (supplemental Table 1), showed striking enrichment for inflammatory signaling pathways (supplemental Figure 2D).
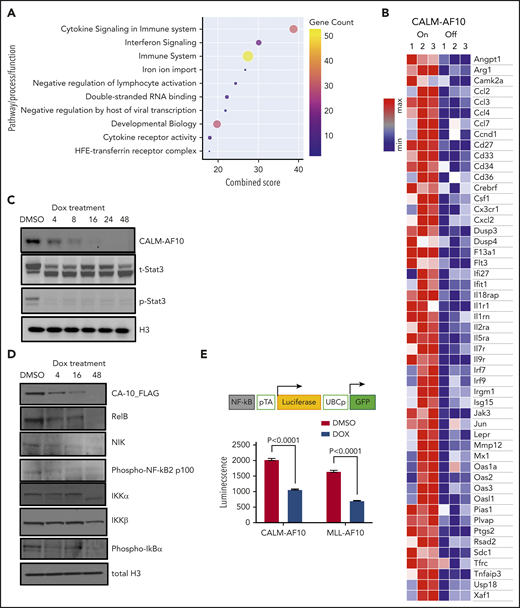
Activation of inflammatory signaling by AF10 FPs. (A) Metascape pathway enrichment analysis of CALM-AF10 target genes is shown with the combined score plotted on the x-axis. Size and color of the circles are proportional to the gene counts. (B) A representative heatmap showing genes involved in inflammatory signaling that are significantly elevated in the CALM-AF10-On compared with the CALM-AF10-Off state from RNA-seq data. (C) Immunoblotting for Flag-CALM-AF10 (CA10), total STAT3 (t-STAT3) and phospho-STAT3 (Y 705) are shown at time points indicated above (in hours). Histone 3 (H3) is used as a loading control. (D) Immunoblotting for NF-κB–signaling pathway components at various indicated time points is shown with histone 3 (H3) as loading control. (E) The relative luciferase activity (luminescence plotted as relative light units) of CALM-AF10–expressing (iCALM-AF10-On) compared with CALM-AF10-Off AML cells with an NF-κB luciferase reporter (schematic on top) is shown upon lipopolysaccharide (LPS) stimulation. Expression of the constitutive GFP reporter was used to normalize the signal.
Activation of inflammatory signaling by AF10 FPs. (A) Metascape pathway enrichment analysis of CALM-AF10 target genes is shown with the combined score plotted on the x-axis. Size and color of the circles are proportional to the gene counts. (B) A representative heatmap showing genes involved in inflammatory signaling that are significantly elevated in the CALM-AF10-On compared with the CALM-AF10-Off state from RNA-seq data. (C) Immunoblotting for Flag-CALM-AF10 (CA10), total STAT3 (t-STAT3) and phospho-STAT3 (Y 705) are shown at time points indicated above (in hours). Histone 3 (H3) is used as a loading control. (D) Immunoblotting for NF-κB–signaling pathway components at various indicated time points is shown with histone 3 (H3) as loading control. (E) The relative luciferase activity (luminescence plotted as relative light units) of CALM-AF10–expressing (iCALM-AF10-On) compared with CALM-AF10-Off AML cells with an NF-κB luciferase reporter (schematic on top) is shown upon lipopolysaccharide (LPS) stimulation. Expression of the constitutive GFP reporter was used to normalize the signal.
To biochemically test the prediction that STAT1/3 and/or NF-κB are activated in AF10-R AMLs (supplemental Figure 2A-B), we monitored STAT1/3 phosphorylation and NF-κB pathway activation using western blotting for key pathway components. We found that both CALM-AF10 as well as MLL-AF10 expression were strongly associated with phosphorylation of STAT3, a key downstream mediator of JAK/STAT signaling (Figure 2C; supplemental Figure 2E). This reduction in STAT3 phosphorylation, which occurred as early as 4 hours after CALM-AF10 inactivation, suggests that STAT3 activation is a direct or early/immediate consequence of CALM-AF10 protein expression in AML cells. Furthermore, CALM-AF10 or MLL-AF10 activation was strongly associated with activation of the NF-κB–signaling pathway, as assessed by immunoblotting for key effectors of NF-κB signaling and confirmed using an NF-κB luciferase reporter assay (Figure 2D-E; supplemental Figure 2F). Of note, no noticeable changes in phospho-Akt, total Akt, Erk, or Jak2 were observed in the AF10 fusion On compared with Off states (supplemental Figure 2G). Taken together, these studies indicate that both CALM-AF10 and MLL-AF10 activate the transcriptional circuitry of inflammatory signaling networks.
CALM-AF10 protein expression drives enhanced secretion of inflammatory cytokines
Our transcriptional data indicated that AF10-FP expression may lead to activation of several inflammatory cytokines and signaling molecules that in turn influence the proliferative activity or growth-factor sensitivity of AML cells. To test this possibility, we cultured murine BM cells transformed with CALM-AF10, MLL-AF10, or MLL-AF9 FPs in BM culture medium from which all supplemented cytokines were withdrawn (see “Methods”). Interestingly, a significantly higher proportion of murine BM cells transformed by either CALM-AF10 or MLL-AF10 remained viable in cytokine-depleted medium vs comparably treated MLL-AF9–transformed cells, which had close to 0% viability after 5 days of culture without cytokines (Figure 3A). By contrast, coculture of CALM-AF10 or MLL-AF10 cells with MLL-AF9 cells in a contact-free Transwell culture significantly enhanced viability of MLL-AF9–transformed cells (Figure 3B), indicating that cytokines and/or other growth factors produced and secreted by the CALM-AF10 or MLL-AF10 AML cells may exert paracrine prosurvival effects on AML cells. To determine whether activation of inflammatory signaling associated with AF10 FP expression promotes secretion of inflammatory cytokines/chemokines, we quantitatively measured the relative abundance of cytokines, chemokines, and growth factors in culture supernatants of CALM-AF10-On compared with CALM-AF10-Off AML cells using the Proteome Profiler cytokine antibody array (see “Methods”) and similarly also on MLL-AF10-On compared with MLL-AF10-Off AML cells. In both CALM-AF10 as well as MLL-AF10 experiments, compared with AF10 fusion-Off cells, supernatants of AF10 fusion-expressing AML cells exhibited a significantly greater abundance of cytokines implicated in AML cell growth and/or survival, including macrophage colony-stimulating factor (M-CSF), granulocyte-macrophage colony stimulating factor (GM-CSF), and interleukin 3 (IL3) (Figure 3C-D; supplemental Table 3).
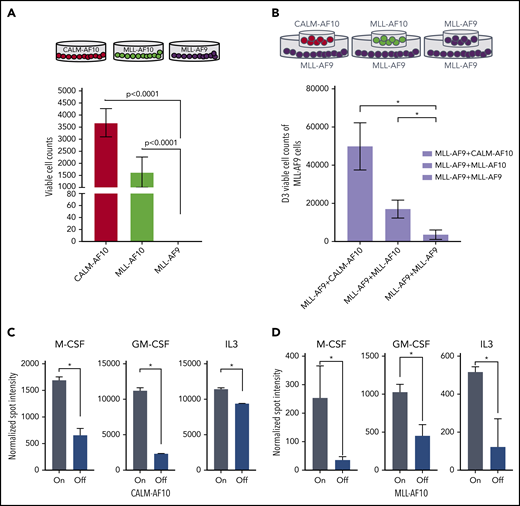
Cytokine sensitivity and expression in AF10 FP-expressing AMLs. (A) Number of viable cells per 10 000 initially seeded cells at day 5 after cytokine withdrawal is plotted on the y-axis for the indicated AML FPs. (B) Schematic on top shows the format of the coculture experiment in which a Transwell was inserted into a 6-well plate for coculture. Number of viable cells per 10 000 cells at day 3 with MLL-AF9 AML cells cocultured with the same cells on top (left panel) or overlaid with CALM-AF10 or MLL-AF10 AML cells (right panels) is shown. (C) Normalized spot intensity of indicated cytokines is shown in the bar graph for M-CSF, GM-CSF, and IL3 for CALM-AF10 On (gray bars) and Off cells (blue bars) and (D) for iMLL-AF10 On (gray) and Off (blue bars) with indicated P values. *P < .05 calculated using the Student t test.
Cytokine sensitivity and expression in AF10 FP-expressing AMLs. (A) Number of viable cells per 10 000 initially seeded cells at day 5 after cytokine withdrawal is plotted on the y-axis for the indicated AML FPs. (B) Schematic on top shows the format of the coculture experiment in which a Transwell was inserted into a 6-well plate for coculture. Number of viable cells per 10 000 cells at day 3 with MLL-AF9 AML cells cocultured with the same cells on top (left panel) or overlaid with CALM-AF10 or MLL-AF10 AML cells (right panels) is shown. (C) Normalized spot intensity of indicated cytokines is shown in the bar graph for M-CSF, GM-CSF, and IL3 for CALM-AF10 On (gray bars) and Off cells (blue bars) and (D) for iMLL-AF10 On (gray) and Off (blue bars) with indicated P values. *P < .05 calculated using the Student t test.
Interactome analysis reveals AF10 FP interaction with Jak1
To better understand how AF10 FPs may drive the expression of their target genes, we conducted a comprehensive and unbiased identification of the AF10 FPs interactome. We used affinity-purified epitope-tagged AF10 FPs and identified interacting proteins using mass spectrometry (MS) in murine AF10 fusion-driven AML cells (see Figure 4A for schematic). We identified several novel CALM-AF10–interacting proteins including Stk38, serotransferrin, Tmod3, Sun2, and thymidylate synthase (Figure 4B; supplemental Table 4); several of these interacting proteins (72 proteins) were also identified as MLL-AF10 FP interactors (supplemental Table 4). Strikingly, the most abundant protein interactor of both the CALM-AF10 as well as the MLL-AF10 FPs was the JAK protein Jak1. Of note, multiple fragments (30-32 unique peptides) of Jak1 were identified with high abundance in all 3 independent biological replicates of the CALM-AF10 data set and none in immunoglobulin G (IgG) controls (supplemental Figure 3A; supplemental Table 4). To confirm the AF10 FP-JAK1 interaction in AML cells, we used immunoprecipitation (IP) of CALM-AF10 or MLL-AF10 FPs using Flag antibodies (Figure 4C; supplemental Figure 3B). Reciprocal co-IP using antibodies targeting endogenous Jak1 further confirmed the interaction (supplemental Figure 3C). We then asked how AF10 FP expression impacted Jak1 protein mechanistically. Expression of either CALM-AF10 or MLL-AF10 was associated with higher levels of Jak1 protein compared with AF10 FP-Off AML cells (Figure 4D), although JAK1 messenger RNA levels were unchanged (supplemental Figure 3D). Also, any increase in JAK1 phosphorylation in AF10 fusion-On compared with AF10 fusion-Off cells could be attributed to higher levels of total JAK1 (supplemental Figure 3E). This observation suggests that the presence of AF10 FPs stabilizes Jak1 and protects it from degradation. In support of this hypothesis, treatment with the proteasome inhibitor MG132 reversed the reduced Jak1 protein expression in AF10 FP-Off cells (Figure 4D).
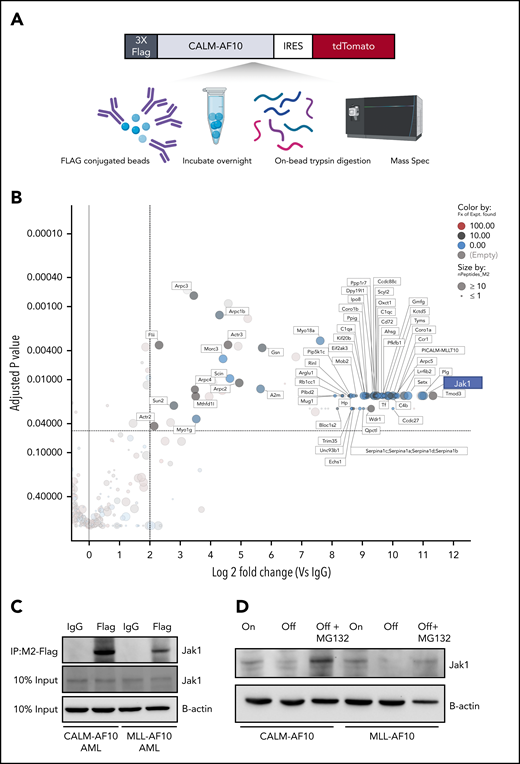
The interactome of CALM-AF10 FP in AML. (A) Schematic representation of the CALM-AF10-flag pulldown and MS. Primary AML cells with a 3xFlag-tagged CALM-AF10 FP and an IRES-linked tdTomato fluorescent marker were used for cell lysis and conjugated with Flag-M2 beads overnight. Following trypsin digestion, MS analysis was performed (see “Methods” for more details). Similar studies were done on MLL-AF10-flag AML cells. (B) Log2 fold-change (x-axis) and adjusted P values (y-axis) of proteins differentially identified in 3xFlag-CALM-AF10 IP samples compared with IgG are plotted. Murine CALM-AF10 AML cells were used for this study. (C) IP using anti-Flag antibodies in CALM-AF10 or MLL-AF10 AML cells blotted with an antibody for endogenous Jak1. β-actin is used as a loading control. (D) Immunoblotting for the endogenous Jak1 protein in murine iCALM-AF10 or iMLL-AF10 AML cells in the FP-On compared with FP-Off cells is shown together with Jak1 levels in MG132-treated AF10 FP-Off cells. β-actin is used as a loading control.
The interactome of CALM-AF10 FP in AML. (A) Schematic representation of the CALM-AF10-flag pulldown and MS. Primary AML cells with a 3xFlag-tagged CALM-AF10 FP and an IRES-linked tdTomato fluorescent marker were used for cell lysis and conjugated with Flag-M2 beads overnight. Following trypsin digestion, MS analysis was performed (see “Methods” for more details). Similar studies were done on MLL-AF10-flag AML cells. (B) Log2 fold-change (x-axis) and adjusted P values (y-axis) of proteins differentially identified in 3xFlag-CALM-AF10 IP samples compared with IgG are plotted. Murine CALM-AF10 AML cells were used for this study. (C) IP using anti-Flag antibodies in CALM-AF10 or MLL-AF10 AML cells blotted with an antibody for endogenous Jak1. β-actin is used as a loading control. (D) Immunoblotting for the endogenous Jak1 protein in murine iCALM-AF10 or iMLL-AF10 AML cells in the FP-On compared with FP-Off cells is shown together with Jak1 levels in MG132-treated AF10 FP-Off cells. β-actin is used as a loading control.
CRISPR screen of CALM-AF10 target genes identifies novel dependencies
Having identified several CALM-AF10 target genes and protein interactors, we sought to comprehensively determine whether these genes were required for the survival of CALM-AF10 AML cells in vitro and in vivo. For this analysis, we generated a pooled clustered regularly interspaced short palindromic repeats (CRISPR) library of single guide RNAs (sgRNAs) against 420 CALM-AF10 transcriptional targets and protein interactors (supplemental Table 5) at a density of 10 sgRNAs per gene (see Figure 5A for schematic and methods). We then used this custom sgRNA library to conduct in vitro and in vivo CRISPR dropout screens in murine Cas9-expressing CALM-AF10 primary AML cells. Those analyses identified 28 statistically significantly depleted genes in the in vitro screen (Figure 5B) and 19 in the in vivo screen (Figure 5C), as evidenced by significant depletion of several independent sgRNAs relative to nontargeting controls (see “Methods”). Of note, 13 genes were significantly depleted in vitro and in vivo (Figure 5D). Importantly, sgRNAs targeting Jak1 were among the most significantly depleted guides in vitro and in vivo (Figure 5B-D; supplemental Figure 3F), indicating that Jak1 is important for CALM-AF10–mediated leukemogenesis. More details about JAK1 sgRNAs, their location on conserved domains, and their depletion scores in vitro and in vivo in comparison with panessential genes and nontargeting controls are stated in supplemental Figure 3F-G.
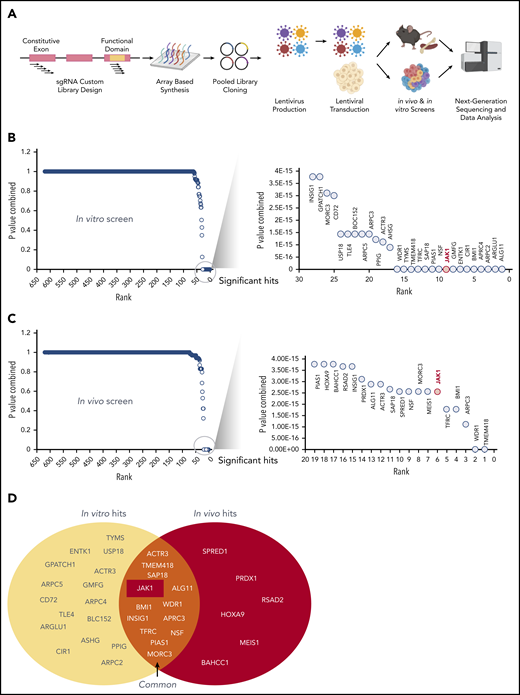
A custom CRISPR screen for genetic dependencies in CALM-AF10 AML. (A) Schematic of the CRISPR screen. A custom pooled library of sgRNAs targeting each of the 420 CALM-AF10 target genes and protein interactors was generated. Five sgRNAs targeting the early constitutive exon and 5 targeting functional domains were combined for a total of 10 sgRNAs per gene. sgRNA library virus was transduced in CALM-AF10-Cas9 AML cells and sgRNA representation was determined after in vitro culture or from AML cells obtained from terminally ill mice. (B-C) Plot showing the combined P values from 2 replicates (y-axis) of sgRNAs ranked in the order of depletion (x-axis) in the T0 compared with the T12 (B) or TD (C) time points. Statistically significant hits are zoomed in and displayed in a separate graph on the right of each figure. JAK1, ranked ninth in vitro and sixth in vivo, is labeled in red. (D) Venn diagram of in vitro hits (yellow oval) and in vivo hits (red oval) are shown with overlapping genes displayed in the union of the 2 sets.
A custom CRISPR screen for genetic dependencies in CALM-AF10 AML. (A) Schematic of the CRISPR screen. A custom pooled library of sgRNAs targeting each of the 420 CALM-AF10 target genes and protein interactors was generated. Five sgRNAs targeting the early constitutive exon and 5 targeting functional domains were combined for a total of 10 sgRNAs per gene. sgRNA library virus was transduced in CALM-AF10-Cas9 AML cells and sgRNA representation was determined after in vitro culture or from AML cells obtained from terminally ill mice. (B-C) Plot showing the combined P values from 2 replicates (y-axis) of sgRNAs ranked in the order of depletion (x-axis) in the T0 compared with the T12 (B) or TD (C) time points. Statistically significant hits are zoomed in and displayed in a separate graph on the right of each figure. JAK1, ranked ninth in vitro and sixth in vivo, is labeled in red. (D) Venn diagram of in vitro hits (yellow oval) and in vivo hits (red oval) are shown with overlapping genes displayed in the union of the 2 sets.
Genetic or pharmacologic Jak1 inhibition impairs CALM-AF10–driven transformation
Given that Jak1 was 1 of the top hits in our CRISPR library screen, we addressed whether conditional Jak1 deletion alters leukemic transformation by the CALM-AF10 oncoprotein. To do so, we transformed biallelic Jak1-floxed BM cells with the CALM-AF10 FP, introduced an estrogen receptor–fused Cre (ER-Cre) recombinase into those cells, and then deleted Jak1-floxed alleles by inducing with 4-hydroxytamoxifen (4-OHT) (Figure 6A). Jak1 deletion led to a statistically significant reduction in the number of blast-like colonies in CFU assays and a concomitant increase in the number of morphologically differentiated colonies relative to Jak1 wild-type cells through 3 weeks of replating (Figure 6B-C). In these experiments, we observed the progressive emergence of an unexcised Jak1 allele over time, indicating selective pressure against biallelic Jak1 loss (supplemental Figure 4A). Similar results were observed upon Cre-mediated Jak1 deletion in MLL-AF10–transformed BM cells as well (supplemental Figure 4B), and even Cre-mediated deletion of a single Jak1 allele using heterozygous Jak1-floxed mice transformed with either CALM-AF10 or MLL-AF10 showed a significant decrease in the formation of blast-like colonies (supplemental Figure 4C). There was a significant increase in apoptosis in CALM-AF10 AML cells after homozygous Jak1 deletion (supplemental Figure 4D), whereas changes in cell cycling between genotypes were insignificant (data not shown). Furthermore, ectopic expression of dominant-negative Stat3 (Stat3-DN) alone significantly decreased the number of second- and third-round blast-like colonies in CALM-AF10 AML cells, and together with Jak1 deletion, completely abrogated colony formation in CALM-AF10 AML cells by 3 weeks of culture (Figure 6B). This finding demonstrates that perturbing Jak1 and/or its downstream effector Stat3 impairs leukemic transformation of CALM-AF10 AML cells. Becausee we had comprehensively characterized CALM-AF10 target genes, we then asked how many of these genes were dependent on Jak1 for their expression. Strikingly, RNA-seq of Jak1–deleted CALM-AF10 AML cells demonstrated that within 72 hours of 4-OHT–mediated Jak1 deletion, a large proportion of the CALM-AF10 target genes was significantly downregulated as evidenced by gene-set enrichment analysis (GSEA) (Figure 6D). CALM-AF10 target genes dependent on Jak1 included a high proportion of inflammatory signaling genes, including several inflammatory genes, cytokines, and chemokines including Ptgs2, Ccl3, Ccl4, Gdf15, Il2ra, Il1rn, and Csf1 (Figure 6E; supplemental Figure 4E), several of which were found in significantly higher abundance in the supernatant of CALM-AF10-On compared with Off leukemia cells (Figure 3C; supplemental Table 3). Taken together, these results demonstrated that Jak1 plays an important role in the clonogenic capacity of CALM-AF10–transformed BM cells and in the transcriptional activation of its targets, including components of the inflammatory signaling cascade.
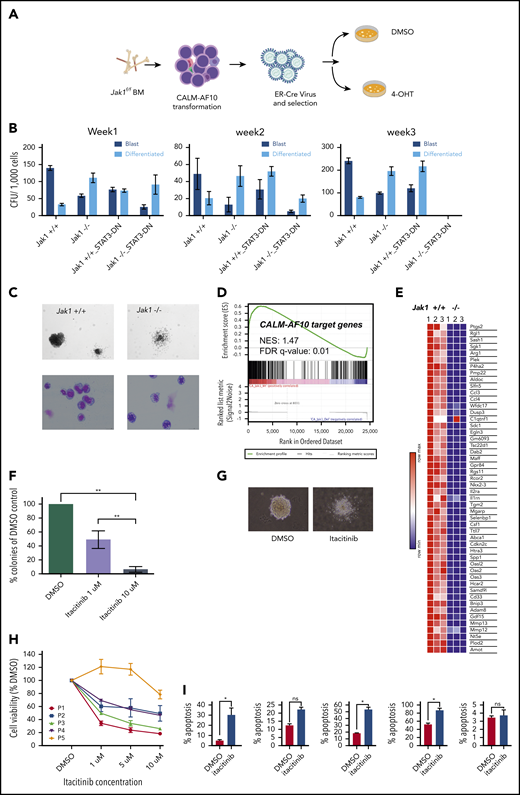
Jak1 inhibition impairs proliferation of AF10 FP AML cells. (A) Schematic representation of the experiment. BM from Jak1-floxed mice was used to transform lineage-depleted cells with the CALM-AF10 fusion. Transformed cells were transduced with a ER-fused Cre recombinase (ER-Cre) and Jak1 was deleted using 4-hydroxy-tamoxifen (4-OHT) treatment of CFU assays. (B) Number of blast-like (dark blue bars) or differentiated (light blue bars) CFUs per 1000 cells from CALM-AF10–transformed cells upon Jak1 deletion (or Stat3 DN) overexpression is shown for weeks 1, 2, and 3. P values were calculated by comparing each arm to the Jak1+/+ control using the Student t test. *P < .05. No colonies were observed in the Jak1−/− Stat3 DN arm in week 3. (C) A picture of a representative colony in Jak1 wild-type compared with Jak1-deleted CALM-AF10–transformed cells is shown (top) (original magnification ×10) with a Wright-Giemsa–stained cytospins of cells from the CFU assay (bottom) (original magnification ×40). (D) GSEA showing the distribution of CALM-AF10 target genes in RNA-seq data from Jak1 floxed compared with Jak1-deleted cells is shown with the normalized enrichment score (NES) and false discovery rate (FDR) q-value indicated. (E) A heatmap for the top 50 CALM-AF10 target genes with the highest GSEA rank metric score is plotted and shown for 3 Jak1+/+ and 3 Jak1−/− replicates. (F) Total number of colonies from CALM-AF10–transformed cells treated with indicated concentrations of itacitinib are plotted as a percent of DMSO (vehicle)-treated cells. **P < .01. (G) A representative picture of the most common type of colonies in DMSO compared with itacitinib-treated CALM-AF10–transformed cells is shown (original magnification ×10). (H) Cell growth assay showing effect of different concentrations of itacitinib on proliferation of human AML patient cells. P1-P4 are blasts from patients or patient-derived xenograft with MLL-AF10 rearrangements and P5 is from a patient with an MLL-AF9 fusion. Error bars indicate standard deviation (SD) of 3 replicates of each sample. (I) Percent apoptotic cells upon treatment with 10 μM itacitinib are shown as measured by Annexin V staining. Error bars show standard error of mean (SEM) for each sample. *P < .05. ns, nonsignificant.
Jak1 inhibition impairs proliferation of AF10 FP AML cells. (A) Schematic representation of the experiment. BM from Jak1-floxed mice was used to transform lineage-depleted cells with the CALM-AF10 fusion. Transformed cells were transduced with a ER-fused Cre recombinase (ER-Cre) and Jak1 was deleted using 4-hydroxy-tamoxifen (4-OHT) treatment of CFU assays. (B) Number of blast-like (dark blue bars) or differentiated (light blue bars) CFUs per 1000 cells from CALM-AF10–transformed cells upon Jak1 deletion (or Stat3 DN) overexpression is shown for weeks 1, 2, and 3. P values were calculated by comparing each arm to the Jak1+/+ control using the Student t test. *P < .05. No colonies were observed in the Jak1−/− Stat3 DN arm in week 3. (C) A picture of a representative colony in Jak1 wild-type compared with Jak1-deleted CALM-AF10–transformed cells is shown (top) (original magnification ×10) with a Wright-Giemsa–stained cytospins of cells from the CFU assay (bottom) (original magnification ×40). (D) GSEA showing the distribution of CALM-AF10 target genes in RNA-seq data from Jak1 floxed compared with Jak1-deleted cells is shown with the normalized enrichment score (NES) and false discovery rate (FDR) q-value indicated. (E) A heatmap for the top 50 CALM-AF10 target genes with the highest GSEA rank metric score is plotted and shown for 3 Jak1+/+ and 3 Jak1−/− replicates. (F) Total number of colonies from CALM-AF10–transformed cells treated with indicated concentrations of itacitinib are plotted as a percent of DMSO (vehicle)-treated cells. **P < .01. (G) A representative picture of the most common type of colonies in DMSO compared with itacitinib-treated CALM-AF10–transformed cells is shown (original magnification ×10). (H) Cell growth assay showing effect of different concentrations of itacitinib on proliferation of human AML patient cells. P1-P4 are blasts from patients or patient-derived xenograft with MLL-AF10 rearrangements and P5 is from a patient with an MLL-AF9 fusion. Error bars indicate standard deviation (SD) of 3 replicates of each sample. (I) Percent apoptotic cells upon treatment with 10 μM itacitinib are shown as measured by Annexin V staining. Error bars show standard error of mean (SEM) for each sample. *P < .05. ns, nonsignificant.
Inhibitors of JAK/STAT signaling show potent antioncogenic activity in models of AF10 FP AML
Finally, we asked whether AF10 FP+ AMLs respond to pharmacologic JAK1 inhibition by treating murine CALM-AF10 cells with the JAK1 inhibitor itacitinib. Similar to phenotypes seen in our gene-depletion studies, treatment of these cells with itacitinib significantly decreased their clonogenic capacity in a concentration-dependent manner (Figure 6F) and almost completely eliminated blast-like CFUs, while the number of colonies exhibiting a differentiated morphology significantly increased (Figure 6G and data not shown). These inhibitor effects were accompanied by significant induction of apoptosis (supplemental Figure 5A). Importantly, itacitinib treatment of cells from patients with MLL-AF10 rearrangements (n = 4) showed antiproliferative response in all 4 samples, but not in a patient sample with the MLL-AF9 fusion (Figure 6H) with corresponding changes in apoptosis (Figure 6I). Next, given our observation that AF10 fusions activate STAT3, we wanted to test atovaquone, a drug used to prevent opportunistic infections recently identified as a potent STAT3 inhibitor,22 for activity against AF10-R leukemias. For this, we treated murine CALM-AF10 and MLL-AF10 AML cells with different concentrations of atovaquone. Our results showed that atovaquone treatment at clinically safe concentrations reversed STAT3 activation as measured by a substantial decrease in STAT3 phosphorylation (Figure 7A) and significantly impaired the proliferation of both CALM-AF10 as well as MLL-AF10 AML cells (Figure 7B), leading to an increase in apoptosis (supplemental Figure 5B). Of note, AML cells derived from MLL-AF9–transformed cells were also sensitive to atovaquone, albeit at a higher 50% effective concentration compared with AF10-fusion AML cells. BM transformed with the CEBPA-inhibitory protein Trib2, on the other hand,23 were insensitive to atovaquone at these concentrations (Figure 7B), demonstrating selectivity. Strikingly, atovaquone treatment almost completely abrogated the formation of blast colonies from murine CALM-AF10 and MLL-AF10 AML cells (Figure 7C-D). Interestingly, treatment of normal human cord blood–derived CD34+ cells with itacitinib showed a striking reduction in their clonogenic capacity in the day 14 CFU assay. Atovaquone exposure, on the other hand, had modest effects (supplemental Figure 5C). Finally, we treated NOD/SCID mice engrafted with the human CALM-AF10+ U937 cell line with Mepron, a microparticle formulation of atovaquone used clinically in humans. Mepron administration in U937-engrafted mice led to a statistically significant increase in disease latency (Figure 7E). Collectively, our data demonstrate that atovaquone treatment may show selectivity in terms of its antileukemic effects and also impair in vitro and in vivo leukemogenicity of AF10-R leukemia with modest effects on normal HSPCs, consistent with its demonstrated safety profile in human subjects.
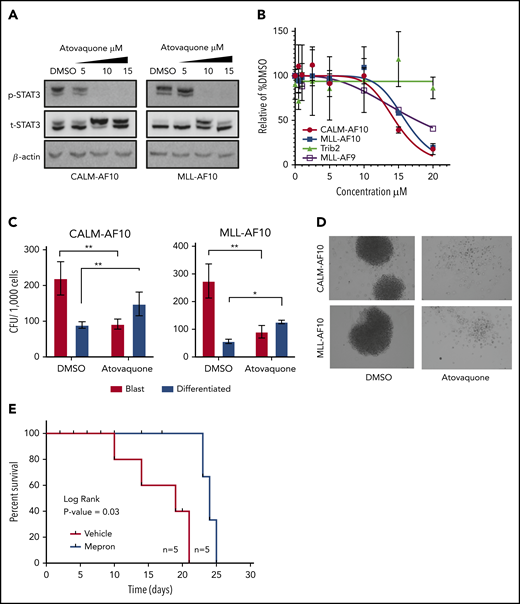
Atovaquone impairs AF10 FP-driven leukemogenesis in vitro and in vivo. (A) Immunoblots showing phospho (p) (Y 705) or total (t) STAT3 with increasing indicated micromolar concentrations of atovaquone are shown in CALM-AF10 or MLL-AF10 murine leukemia cells. B-actin is used as a loading control. (B) Viable cells are plotted as a percentage of DMSO-treated cells (y-axis) with indicated concentrations of atovaquone (x-axis). Cells transformed with CALM-AF10, MLL-AF10, MLL-AF9, or Trib2 were used. (C) Number of CFUs with a blast-like or differentiated morphology in DMSO- or (10 μM) atovaquone-treated conditions is shown. *P < .05. **P < .01. (D) Representative image of colonies from CALM-AF10 or MLL-AF10 mouse AML cells treated with DMSO or atovaquone are shown (original magnification ×10). (E) Survival curves from mice injected with the CALM-AF10+ U937 cell line administered vehicle (red) or Mepron (blue), a clinically used formulation of atovaquone, are shown. P value calculated using log-rank t test (Mantel-Cox) and the number of mice (n) in each group are indicated.
Atovaquone impairs AF10 FP-driven leukemogenesis in vitro and in vivo. (A) Immunoblots showing phospho (p) (Y 705) or total (t) STAT3 with increasing indicated micromolar concentrations of atovaquone are shown in CALM-AF10 or MLL-AF10 murine leukemia cells. B-actin is used as a loading control. (B) Viable cells are plotted as a percentage of DMSO-treated cells (y-axis) with indicated concentrations of atovaquone (x-axis). Cells transformed with CALM-AF10, MLL-AF10, MLL-AF9, or Trib2 were used. (C) Number of CFUs with a blast-like or differentiated morphology in DMSO- or (10 μM) atovaquone-treated conditions is shown. *P < .05. **P < .01. (D) Representative image of colonies from CALM-AF10 or MLL-AF10 mouse AML cells treated with DMSO or atovaquone are shown (original magnification ×10). (E) Survival curves from mice injected with the CALM-AF10+ U937 cell line administered vehicle (red) or Mepron (blue), a clinically used formulation of atovaquone, are shown. P value calculated using log-rank t test (Mantel-Cox) and the number of mice (n) in each group are indicated.
Discussion
AF10 gene fusions are generally associated with activation of overlapping molecular pathways and with poor survival outcomes.15,16,20,21 A recent study of pediatric AML reported that AF10 fusions are significantly enriched in patients unresponsive to frontline therapies (the so-called “induction failures”).24 These patients are therefore considered as one of the highest-risk groups in pediatric AML, further reinforcing the urgent, unmet need to identify efficacious and highly targeted therapies for this malignancy in the pediatric cohort.
Although other targeted therapies are being explored as treatment of AF10-R AML, success in the clinic has thus far been limited. It was previously demonstrated that the histone methyltransferase DOT1L is an attractive target in AF10-R AML, but the small molecule DOT1L inhibitor pinometostat has had limited success against AML.25 Other notable actionable targets have been reported for CALM-AF10 AML, including the nuclear export protein XPO1,26,27 the Polycomb group protein BMI1,28 and factors associated with transferrin-mediated iron uptake,29 but the translational potential of these targets remains to be determined in clinical studies. Patients with AF10 fusions continue to be treated with extremely cytotoxic therapies associated with induction failures and severe debilitating effects even when lasting cures are achieved.
Notably, studies performed on cell lines show that AML cells harboring AF10 fusions are highly sensitive to direct genetic targeting of the AF10 FP, evidence that these fusions are attractive candidates for targeted therapy for AF10-R leukemia. Specifically, small interfering RNAs targeting the CALM-AF10 fusion transcript lead to potent loss of viability of CALM-AF10 AML cells, and sgRNAs targeting the fusion partners of CALM-AF10 are highly selected against in DepMap screens.30,31 Despite a strong rationale for targeting tumor-promoting fusion oncoproteins in cancer, most of these oncoproteins remain difficult drug targets. One way of circumventing this problem is by identifying downstream transcriptional or signaling networks activated by these FPs and targeting these networks instead. In this study, we developed mouse models in which the key AF10 fusion oncoproteins CALM-AF10 and MLL-AF10 can be rapidly switched off, enabling the systematic mapping of genetic and biochemical networks driven by AF10 FPs. In addition to these transcriptomic studies, our extensive characterization of the AF10 FP interactome helps expand the molecular network of AF10-R leukemia, which will help in understanding mechanisms of AF10-R leukemia that have so far remained elusive. More importantly, these data sets on AF10-R leukemia will help identify and prioritize therapeutically targetable candidates in the disease. Our finding that AF10 FPs directly recruit JAK1 and potently activate inflammatory signaling offer one such attractive avenue for therapeutic intervention.
The JAK/STAT pathway is an important node in regulating expression, secretion, and activity of cytokines, chemokines, and growth factors that play important roles in normal and malignant cells. Rapid strides have been made in the last few years in the development, characterization, and clinical translation of inhibitors of the JAK family of kinases, given their roles in inflammatory diseases and cancer. The JAK1/2 inhibitor ruxolitinib was the first JAK inhibitor approved by the US Food and Drug Administration (FDA) for use in myeloid malignancies.32 Furthermore, more selective JAK1 inhibitors such as itacitinib and filgotinib are being tested in advanced-stage clinical trials for inflammatory conditions (reviewed in Winthrop33 ). Previous work has shown a role for JAK1 in stress-induced hematopoiesis, but not in steady-state hematopoiesis in the absence of myelosuppressive or transplantation-induced stressors.34 The JAK1 inhibitor itacitinib has been tested in myelofibrosis and did not show significant detrimental impact on hematopoiesis.35 Our studies showing a specific requirement for JAK1 in high-risk AML suggest that this approach may have a significant therapeutic index in a clinical context in need of new treatments.
Excitingly, FDA-approved drugs used as antiparasitic agents have recently been shown to inhibit STAT3 activation in hematological malignancies and are therefore being repurposed for use in cancer.36 Genomic studies have revealed that the drug atovaquone inhibits STAT3 phosphorylation and has antileukemia effects.22 In fact, atovaquone is sometimes prescribed to leukemia patients, not for its recently recognized antileukemia effect, but as a prophylactic agent to prevent opportunistic infections following immunosuppressive treatment. Interestingly, the antileukemia effects of atovaquone were observed in human AML patients in retrospective analyses, although it remains unclear which leukemia patients might benefit most from these therapies.22,36 As a result, a clinical trial is currently ongoing for atovaquone combined with chemotherapy in de novo AML (ClinicalTrials.gov identifier NCT03568994). Because atovaquone has been used safely in humans for several decades, we asked whether these drugs are effective against AF10-R AML. Our studies showing potent effects of atovaquone in mouse and human AF10-R leukemia cells indicate a novel therapeutic approach in this disease in addition to currently used therapies.
All next-generation sequencing data including RNA-seq, chromatin IP (ChIP)-seq, and CRISPR library-seq have been deposited in the Gene Expression Omnibus database (accession number GSE164181). Curated lists of genes and proteins for the RNA-seq, enhancer ChIP-seq, and CRISPR screens can be located in supplemental Tables 1-5 as described in the manuscript.
The online version of this article contains a data supplement.
The publication costs of this article were defrayed in part by page charge payment. Therefore, and solely to indicate this fact, this article is hereby marked “advertisement” in accordance with 18 USC section 1734.
Acknowledgments
The authors gratefully acknowledge Brian James from the Sanford Burnham Prebys Medical Discovery Institute (SBP) genomic core, Yoav Altman from the SBP Flow Cytometry Core, and Guillermina Garcia from SBP histology core for their excellent support with genomic, flow sorting, and histology experiments, respectively. The authors would also like to thank Warren Pear for kindly providing the MSCV-Trib2 plasmid.
This work was supported by National Institutes of Health (NIH) National Cancer Institute grants R00 CA154880 and P30 CA030199, the Rally Foundation for Childhood Cancer Research and the Luke Tatsu Johnson Foundation under award number 19YIN45, an Emerging Scientist Award from the Children’s Cancer Research Fund, and the V Foundation for Cancer Research (TVF) under award number DVP2019-015. This work was also supported by the Lady Tata Foundation (A.D.) and Memorial Sloan Kettering Cancer Center (MSKCC) support grant P30 CA008748 from the NIH National Cancer Institute. R.L.L. was supported by NIH National Cancer Institute grant R35 CA197594 and by Specialized Center of Research (SCOR) grants from the Leukemia & Lymphoma Society. S.A.A. was supported by NIH National Cancer Institute grants CA176745, CA206963, CA204639, and CA066996 and by the Leukemia & Lymphoma Society.
Authorship
Contribution: B.-R.C., A.D., K.B., M.K., and A.R.C. conducted the experiments; X.L. provided bioinformatic support for the sequencing studies; N.Y., C.E., P.S.V., I.J., and T.H. provided key reagents and technical expertise; P.D.A., T.H., R.J.W.-R., A.B., S.M., S.A.A., S.C., Z.R., D.A.F., and R.L.L. provided critical resources and helped analyze data and prepare a draft of the manuscript; and A.J.D. conceptualized the studies, analyzed data, and prepared the manuscript.
Conflict-of-interest disclosure: R.L.L. is on the supervisory board of Qiagen and is a scientific advisor to Loxo (until February 2019), Syndax, Mission Bio, Imago, C4 Therapeutics, and Isoplexis; receives research support from, and consulted for, Celgene and Roche; has consulted for Lilly, Jubilant, Janssen, Astellas, Morphosys, and Novartis; has received honoraria from Roche, Lilly, and Amgen for invited lectures; and has received honoraria from Celgene and Gilead for grant reviews. S.A.A. has been a consultant and/or shareholder for Neomorph Inc, Imago Biosciences, Vitae/Allergan Pharma, Cyteir Therapeutics, C4 Therapeutics, OxStem Oncology, Accent Therapeutics, and Mana Therapeutics; and has received research support from Janssen, Novartis, Syndax, and AstraZeneca. The remaining authors declare no competing financial interests.
Correspondence: Aniruddha J. Deshpande, Sanford Burnham Prebys Medical Discovery Institute, 10901 N. Torrey Pines Rd, La Jolla, CA 92037; e-mail: adeshpande@sbpdiscovery.org.

This feature is available to Subscribers Only
Sign In or Create an Account Close Modal