

Key Points
IGLV3-21R110 defines a CLL subset with an intermediate epigenetic subtype, moderate IGHV mutations, specific drivers, and poor outcomes.
IGLV3-21R110 CLL has a transcriptional profile resembling unmutated IGHV CLL and specific signature including WNT5A/B overexpression.

Abstract
B-cell receptor (BCR) signaling is crucial for chronic lymphocytic leukemia (CLL) biology. IGLV3-21–expressing B cells may acquire a single point mutation (R110) that triggers autonomous BCR signaling, conferring aggressive behavior. Epigenetic studies have defined 3 CLL subtypes based on methylation signatures reminiscent of naïve-like (n-CLL), intermediate (i-CLL), and memory-like (m-CLL) B cells with different biological features. i-CLL carries a borderline IGHV mutational load and significantly higher use of IGHV3-21/IGLV3-21. To determine the clinical and biological features of IGLV3-21R110 CLL and its relationship to these epigenetic subtypes, we characterized the immunoglobulin gene of 584 CLL cases using whole-genome/exome and RNA sequencing. IGLV3-21R110 was detected in 6.5% of cases: 30 (38%) of 79 i-CLLs, 5 (1.7%) of 291 m-CLLs, and 1 (0.5%) of 189 n-CLLs. All stereotype subset 2 cases carried IGLV3-21R110, whereas 62% of IGLV3-21R110 i-CLL cases had nonstereotyped BCR immunoglobulins. IGLV3-21R110 i-CLL had a significantly higher number of SF3B1 and ATM mutations and total number of driver alterations. However, the R110 mutation was the sole alteration in 1 i-CLL and was accompanied only by del(13q) in 3. Although IGHV mutational status varied, IGLV3-21R110 i-CLL transcriptomically resembled n-CLL/unmutated IGHV CLL with a specific signature including WNT5A/B overexpression. In contrast, i-CLL lacking IGLV3-21R110 mirrored m-CLL/mutated IGHV. Patients with IGLV3-21R110 i-CLL had a short time to first treatment and overall survival similar to those of n-CLL/unmutated IGHV patients, whereas patients with non-IGLV3-21R110 i-CLL had a good prognosis similar to that of patients with m-CLL/mutated IGHV. IGLV3-21R110 defines a CLL subgroup with specific biological features and an unfavorable prognosis independent of IGHV mutational status and epigenetic subtype.
Introduction
Chronic lymphocytic leukemia (CLL) has a heterogeneous biological behavior highly influenced by its immunogenetic, epigenetic, and genomic makeup.1,2 The mutational load within the immunoglobulin heavy-chain variable (IGHV) region identifies 2 main disease subtypes, with unmutated IGHV (U-IGHV) and mutated IGHV (M-IGHV), associated with different biological and clinical features.3-5 Immunogenetic studies have highlighted the importance of the B-cell receptor (BCR) for CLL proliferation and survival,6-8 and antigen-independent, constitutive BCR activity is driven by homotypic interactions between BCR heterodimers in some tumors.9 A relevant BCR-BCR interaction was found in CLL cells expressing IGLV3-21.10 In these tumors, somatic hypermutation introduces a single G>C substitution at the splice site between the immunoglobulin λ J and constant genes, changing the glycine at position 110 to arginine (R). The presence of R110 together with lysine 16 (K16) in 1 BCR and aspartates (D) 50 and 52 in the YDSD motif of a neighbor BCR triggers cell-autonomous BCR signaling.10 A recent study showed that CLL cases carrying R110-mutated IGLV3-21 (IGLV3-21R110), although varied in terms of IGHV mutational status, express a phenotype similar to U-IGHV CLL and have similar adverse clinical outcomes.11 This is in line with the previously described poor prognosis of patients with IGLV3-21–expressing disease.12 Among the 3 IGLV3-21 alleles reported at the time of publication, only IGLV3-21*01 had the prerequisite K16 and YDSD motifs.11 Of note, the updated IMGT/V-QUEST reference directory release (202018-4) includes a novel IGLV3-21 allele, IGLV3-21*04, which also fulfills the previous requirements.13,14
Genome-wide methylation studies have identified 3 epigenetic CLL subtypes.15,16 These subtypes, which correlated with IGHV mutational status and patient outcome, are called memory-like CLL (m-CLL; mainly M-IGHV, with good prognosis), intermediate CLL (i-CLL; mixed between M- and U-IGHV, with intermediate prognosis), and naïve-like CLL (n-CLL; mainly U-IGHV, with poor prognosis).15 The prognostic value of this epigenetic classification has been confirmed in independent population-based and clinical trial cohorts.15-19 Also of interest, i-CLL cases were biased toward λ light-chain use, with ∼50% expressing IGLV3-21.18
Together, these observations suggest that IGLV3-21R110 might be enriched in i-CLL and could identify a subset of patients with aggressive disease within this intermediate subtype. Here, we studied IGLV3-21R110 in 584 CLL cases through the integration of whole-genome (WGS)/exome sequencing (WES) and RNA sequencing (RNA-seq) data.20 IGLV3-21R110 identified 38% of patients with i-CLL with poor clinical outcomes, similar to those of patients with n-CLL. In contrast, i-CLL lacking IGLV3-21R110 transcriptomically and clinically mirrored m-CLL/M-IGHV tumors.
Patients and methods
Patients
We studied 584 CLL patients from 2 independent cohorts: cohort 1 (C1-CLL) comprised 506 CLL patients from our International Cancer Genome Consortium study,20 and cohort 2 (C2-CLL) included 78 patients from the Heidelberg University Hospital21 (Table 1; supplemental Table 1, available on the Blood Web site). C1-CLL included 54 cases of high-count monoclonal B-cell lymphocytosis (MBL), which were considered together with the 452 CLL samples for biological analyses but were excluded from clinical studies. All patients provided written informed consent. The study was approved by the ethics committee of the Hospital Clínic of Barcelona.
Clinical and biological characteristics of studied cohorts
| n (%) | ||
|---|---|---|
| C1-CLL (n = 506) | C2-CLL (n = 78) | |
| Diagnosis | ||
| High-count MBL | 54 (11) | 0 |
| CLL | 452 (89) | 78 (100) |
| Sex | ||
| Female | 205 (41) | 29 (37) |
| Male | 301 (59) | 49 (63) |
| Age at diagnosis, y | ||
| Median | 62 | 62 |
| Range | 18-93 | 38-83 |
| Binet stage at diagnosis | ||
| A | 441 (87) | 54 (69) |
| B | 49 (10) | 12 (15) |
| C | 11 (2) | 1 (1) |
| Not available | 5 (1) | 11 (14) |
| WGS/WES | ||
| WGS | 65 (13) | 78 (100) |
| WGS and WES | 87 (17) | 0 |
| WES | 354 (70) | 0 |
| RNA-seq | 294 (58) | 75 (96) |
| Epigenetic subtype | ||
| m-CLL | 269 (53) | 33 (42) |
| i-CLL | 69 (14) | 12 (15) |
| n-CLL | 163 (32) | 29 (37) |
| Not available | 5 (1) | 4 (5) |
| IGHV mutational status | ||
| M-IGHV | 321 (63) | 46 (59) |
| U-IGHV | 185 (37) | 32 (41) |
| Light chain gene rearrangement* | ||
| κ | 315 (62) | 41 (5) |
| κ and λ | 3 (1) | 3 (4) |
| λ | 153 (30) | 34 (44) |
| Not detected | 35 (7) | 0 |
Productive light-chain gene rearrangement identified by WGS, WES, and/or RNA-seq. Flow cytometry in 31 of 35 C1-CLL cases in which rearrangement was not detected by sequencing detected expression of κ in 18, λ in 11, and κ/λ in 2 cases. Light-chain expression by flow cytometry was not available for remaining 4 cases.
Immunoglobulin gene characterization
Immunoglobulin gene rearrangements and mutational status were obtained from WGS and WES using our recently described algorithm, IgCaller (version 1.1),22 and RNA-seq using MiXCR (version 3.0.12).23 The rearrangements obtained were verified on the Integrative Genomics Viewer.24 IgH gene rearrangements were complemented with Sanger sequencing and the LymphoTrack IGHV Leader Somatic Hypermutation Assay (Invivoscribe Technologies), available for 495 C1-CLL20 and 70 C2-CLL22 cases, respectively. The 19 major subsets of stereotyped BCR in CLL were analyzed using the ARResT/AssignSubsets tool.25 Light-chain gene rearrangements were compared with the light-chain expression determined by flow cytometry in 452 C1-CLL cases (supplemental Data). IGLV3-21–rearranged sequences reported by IgCaller were manually curated to phase single-nucleotide polymorphisms with the rearranged allele to properly annotate it using IMGT/V-QUEST (version 3.5.18; release 202018-4; supplemental Data).14
Epigenetic subtypes
Classification of 575 patients according to the 3 epigenetic subtypes was obtained from previous publications (C1-CLL, n = 50117,20 ; C2-CLL, n = 7418,21 ; supplemental Table 1). C1-CLL patients had been classified according to subtype by Kulis et al15 and C2-CLL patients as described by Oakes et al16 as low-programmed CLL (mainly n-CLL), intermediate-programmed CLL (mainly i-CLL), or high-programmed CLL (mainly m-CLL). On the basis of the high concordance between the 2 classifications (93% according to Oakes et al16 and 95% in an independent cohort of 64 cases; supplemental Table 2), we used the original classification of the cases, adopting the n-CLL/i-CLL/m-CLL terminology15 to simplify the reading (supplemental Data).
Driver alterations
Mutational data on 104 CLL driver alterations (gene mutations, n = 77; copy-number alterations, n = 27; supplemental Table 3)20,26,27 were already available for C1-CLL.20 For C2-CLL, the main CLL driver alterations, including SF3B1, NOTCH1, ATM, BIRC3, TP53, trisomy 12, and deletion (del) 13q, were obtained from a previous study.21 The mutational status of U1 was determined for all patients using the rhAmp single-nucleotide polymorphism genotyping system (Integrated DNA Technologies).27
RNA-seq analyses
RNA-seq data on 294 C1-CLL and 75 C2-CLL cases were obtained from previous publications (supplemental Table 1).20,21 Sequencing reads were trimmed using trimmomatic (version 0.38),28 and ribosomic RNA reads were filtered out using SortMeRNA (version 2.1b).29 Gene-level counts (GRCh38.p13; Ensembl release 100) were calculated using kallisto (version 0.46.1)30 and tximport (version 1.6.0).31 Differential expression was conducted using DESeq2 (version 1.18.1).32 Shrinkage of effect size was performed using the apeglm method.33 Adjusted P value (Q) <.01 and absolute log2-transformed fold change >1 were used to identify differentially expressed genes (DEGs). IGHV mutational status was used as covariate in differential expression analyses, except when comparing M- vs U-IGHV cases. Immunoglobulin genes were considered in the analysis only in the comparison of M- vs U-IGHV cases. Variance-stabilizing transformation32 was used to transform normalized counts before dimensionality reduction analysis using the uniform manifold approximation and projection (UMAP) algorithm.34 Gene-set enrichment analyses (GSEAs) were conducted with GSEA software (version 4.0.3),35 using the whole set of DESeq2 normalized counts and focusing on curated and hallmark gene sets in the Molecular Signatures Database (version 7.1).36
Statistical methods
Primary end points were time to first treatment (TTFT) and overall survival (OS) measured from time of diagnosis in C1-CLL with an updated follow-up. Deaths previous to any treatment were considered competing events in TTFT analyses. Gray’s and log-rank tests were used to compare cumulative curves (TTFT) and Kaplan-Meier curves (OS), respectively. Multivariate models were modeled using the Fine-Gray (TTFT) and Cox (OS) regression models. Only patients diagnosed with CLL were included in clinical analyses, and only Binet A patients were considered in TTFT analyses. Associations between variables were assessed by Fisher’s exact or χ2 test, and P values were adjusted using the Benjamini-Hochberg correction. All tests were 2 sided. All analyses were performed in R (version 3.4.4).
Results
Immunoglobulin gene reconstruction
We used WGS, WES, and RNA-seq to characterize the immunoglobulin gene rearrangements of 584 CLL cases (both C1-CLL and C2-CLL; supplemental Tables 4-7). As reported previously,22 IgCaller identified 207 (90%) heavy- and 223 (97%) light-chain productive rearrangements in 230 CLL cases with WGS from the 2 CLL cohorts. Although IgCaller was initially designed for WGS, we applied the pipeline to the 441 WESs of C1-CLL, and it was able to identify 225 (51%) productive and 81 partial (V-J) IGH gene rearrangements (supplemental Data). The lower success rate of IgCaller on WES data is the result of the limitations on sequencing coverage in the immunoglobulin regions. A total of 212 (97%) of the 219 productive and 72 (92%) of the 78 partial IGH gene rearrangements obtained from WES were concordant with Sanger sequencing. IgCaller also identified 366 (83%) of the 441 productive light-chain gene rearrangements, matching in all but 1 case (334 [99.7%] of 335) the κ/λ expression detected by flow cytometry. Light-chain gene rearrangements obtained from WES and WGS were concordant in the 72 cases in which both results were available. On the other hand, MiXCR identified a productive IGH gene rearrangement in 361 (98%) of 369 cases and a light-chain gene rearrangement in 366 (99%) of 369. Concordance with Sanger sequencing/LymphoTrack assay (IGH) and flow cytometry (light-chain expression) was 97% (335 of 344) and 100% (271 of 271), respectively. We observed a high, significant correlation between the IGHV identities obtained from the different data types (supplemental Figure 1).
For each patient, we selected a heavy- and light-chain gene rearrangement after careful manual examination (Table 1; supplemental Tables 4-7; supplemental Figure 2). Altogether, we characterized the full length of the productive IGH rearrangement in 567 (97%) of 584 cases (partial rearrangements were obtained in the remaining 17 cases) and productive κ/λ rearrangements in 549 (94%). Among 31 cases in which a productive light-chain rearrangement was not detected by sequencing, flow cytometry detected the expression of κ in 18, λ in 11, and κ/λ in 2 cases (Table 1).
IGLV3-21R110 and epigenetic subtypes
A λ light-chain rearrangement was detected in 156 (32%) of 489 C1-CLL cases and in 37 (47.4%) of 78 C2-CLL cases. In C1-CLL, 39 (8%) of 489 cases used the IGLV3-21 gene. The prevalence of IGLV3-21 was similar between M-IGHV (6.5%) and U-IGHV (10.5%) cases (P = .12; Figure 1A), but it was significantly higher in the i-CLL epigenetic subtype (24 [36%] of 67) compared with m-CLL (7 [2.7%] of 258) and n-CLL (8 [5%] of 160; P < .001). In contrast, the frequency of λ non–IGLV3-21 rearrangements was similar among all 3 epigenetic subtypes (i-CLL, 24%; m-CLL, 27%; n-CLL, 17%), suggesting that their difference relies on IGLV3-21 use rather than on a global increase in the expression of λ gene rearrangements (Figure 1A). IGLV3-21R110 was found in 28 (5.7%) of 489 cases, 24 of (36%) 67 i-CLLs, 3 (1%) of 258 m-CLLs, and 1 (0.6%) of 167 n-CLLs. The IGLV3-21*04 allele was used by all cases carrying the R110 mutation (Figure 1B; supplemental Table 6). n-CLL (U-IGHV) carrying the R110 mutation had an IGLV identity of 99.3%, which is in line with the somatic hypermutation origin of this mutation.
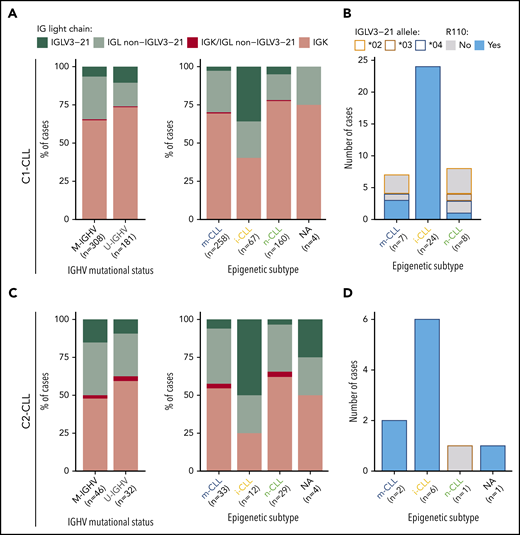
Prevalence of IGLV3-21 among CLL subtypes and presence of IGLV3-21R110 mutations. (A) Bar plot showing light-chain expression among CLL subtypes based on IGHV mutational status (left) and epigenetic subtype (right) for C1-CLL cases. (B) IGLV3-21 allele and presence or absence of R110 mutation among cases expressing the IGLV3-21 gene. (C-D) Same as panels A and B, but for C2-CLL cases (validation cohort). NA, not available.
Prevalence of IGLV3-21 among CLL subtypes and presence of IGLV3-21R110 mutations. (A) Bar plot showing light-chain expression among CLL subtypes based on IGHV mutational status (left) and epigenetic subtype (right) for C1-CLL cases. (B) IGLV3-21 allele and presence or absence of R110 mutation among cases expressing the IGLV3-21 gene. (C-D) Same as panels A and B, but for C2-CLL cases (validation cohort). NA, not available.
Concordant results were observed in the independent C2-CLL, in which 9 (11.5%) of 78 cases expressed IGLV3-21R110. IGLV3-21 was similarly distributed between M-IGHV (7 [15%] of 46) and U-IGHV (3 [9.4%] of 32) cases, and it was significantly enriched in i-CLL cases (6 [50%] of 12). All IGLV3-21 i-CLL cases expressed the IGLV3-21*04 allele carrying the R110 mutation (Figure 1C-D; supplemental Table 7). Combining both cohorts, IGLV3-21R110 was detected in 3.7% (2 of 54) of high-count MBL and 6.8% (35 of 513) of CLL samples (P = .56). Altogether, 6.5% (37 of 567) of the cases carried IGLV3-21R110 (M-IGHV, 23 [6.5%] of 354; U-IGHV, 14 [6.6%] of 213; P = 1), including 30 (38%) of 79 i-CLL but only 5 (1.7%) of 291 m-CLL and 1 (0.5%) of 189 n-CLL cases (P < .001; note that epigenetic subtype was not available for 1 IGLV3-21R110 case).
IGLV3-21 motifs required for autonomous BCR signaling
All IGLV3-21R110 cases carried the germ line K16 and 27 of 37 cases maintained the germ line YDSD motif required for homotypic BCR-BCR interaction. The remaining 10 cases carried a motif that differed by 1 residue, which had similar properties in all (YDTD, n = 5; FDSD, n = 4) but 1 case (YDND, n = 1; supplemental Tables 6-7).
Immunoglobulin gene rearrangement, somatic hypermutation, stereotype, and IGLV3-21R110
Combining both cohorts, we observed that IGLV3-21R110 i-CLL cases had a higher incidence of stereotyped immunoglobulins (11 [38%] of 29) than m-CLL (16 [5.5%] of 291) or n-CLL (34 [18%] of 187) cases (Figure 2A). All stereotyped IGLV3-21R110 i-CLL cases belonged to subset 2 (n = 11). The remaining 3 subset 2 cases also carried IGLV3-21R110 (2 m-CLLs, and 1 lacking the epigenetic subtype; Figure 2B). Therefore, all subset 2 cases carried IGLV3-21R110. Nonetheless, 18 (62%) of 29 IGLV3-21R110 i-CLL, 1 of 1 IGLV3-21R110 n-CLL, and 3 (60%) of 5 IGLV3-21R110 m-CLL cases carried nonstereotyped immunoglobulin genes (supplemental Table 8). Note that stereotype was not available for one IGLV3-21R110 i-CLL case. On the other hand, none of the i-CLLs lacking IGLV3-21R110 had any of the studied stereotypes (Figure 2A). Cases carrying non–subset 2 stereotypes were exclusively n-CLL or m-CLL (Figure 2B). IGLV3-21R110 i-CLL cases had a significantly lower IGHV mutational load than non-IGLV3-21R110 i-CLL cases and frequently rearranged IGHV3-21, as expected in stereotype 2, but also IGHV1-18, IGHV3-53, and IGHV3-64 (Figure 2C-D). In contrast, non-IGLV3-21R110 i-CLL cases rarely used IGHV3-21 and were enriched in IGLV3-25 and IGKV1-8 (Figure 2E).
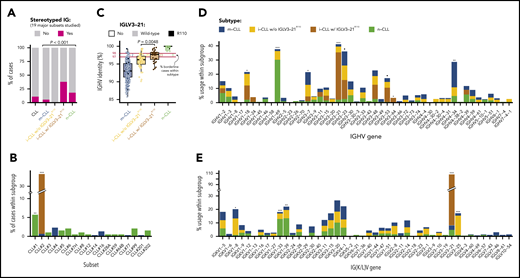
Stereotype, somatic hypermutation, and V gene use in CLL subtypes. (A) Frequency of stereotyped immunoglobulin genes in each CLL subtype (19 major stereotype subsets were annotated using ARResT/AssignSubsets tool). P value by χ2 test. (B) Frequency of specific stereotypes within each subtype of cases. (C) Boxplots showing percentage of identity to germ line of IGHV gene in each CLL subtype. Percentage of cases carrying borderline IGHV identity (97% to 98%) is shown for each subgroup of cases. Note also that none of the IGLV3-21R110 cases had 100% IGHV percentage of identity. P value by Wilcoxon test comparing i-CLL cases with and without IGLV3-21R110. (D) IGHV gene use according to CLL subtype. (E) IG(K/L)V gene use according to CLL subtype. IGKV genes from proximal and distal clusters were merged for simplification. Only the IGLV gene is represented for cases expressing κ and λ gene rearrangements. Q values by χ2 test with Benjamini-Hochberg correction. Q < 0.1, *Q < 0.05, **Q < 0.001, ***Q < 0.0001.
Stereotype, somatic hypermutation, and V gene use in CLL subtypes. (A) Frequency of stereotyped immunoglobulin genes in each CLL subtype (19 major stereotype subsets were annotated using ARResT/AssignSubsets tool). P value by χ2 test. (B) Frequency of specific stereotypes within each subtype of cases. (C) Boxplots showing percentage of identity to germ line of IGHV gene in each CLL subtype. Percentage of cases carrying borderline IGHV identity (97% to 98%) is shown for each subgroup of cases. Note also that none of the IGLV3-21R110 cases had 100% IGHV percentage of identity. P value by Wilcoxon test comparing i-CLL cases with and without IGLV3-21R110. (D) IGHV gene use according to CLL subtype. (E) IG(K/L)V gene use according to CLL subtype. IGKV genes from proximal and distal clusters were merged for simplification. Only the IGLV gene is represented for cases expressing κ and λ gene rearrangements. Q values by χ2 test with Benjamini-Hochberg correction. Q < 0.1, *Q < 0.05, **Q < 0.001, ***Q < 0.0001.
Genomic landscape of IGLV3-21R110 CLL
We used the mutational data of 104 driver alterations for C1-CLL cases to characterize the genomic landscape of IGLV3-21R110 CLL. IGLV3-21R110 CLL had a significant increase in SF3B1 (15 [54%] of 28 vs 26 [5.6%] of 461; Q < 0.001) and ATM mutations (Q = 0.056) and a depletion of trisomy 12 (Q = 0.18) compared with non–IGLV3-21R110 CLL (Figure 3A; supplemental Table 9). Enrichment for SF3B1 mutations was similar to that observed in subset 2 cases (6 [55%] of 11 vs 33 [7%] of 476; P < .001). However, the number of SF3B1-mutated cases recognized by IGLV3-21R110 was remarkably higher. On the basis of IGLV3-21R110 enrichment in i-CLL cases, we next focused on this subgroup of patients. Of note, 13 (54%) of 24 IGLV3-21R110 i-CLL cases carried SF3B1 mutations compared with 2 (5%) of 43 i-CLL cases lacking IGLV3-21R110 (Q < 0.001; Figure 3B; supplemental Figure 3). ATM mutations also significantly cooccurred with IGLV3-21R110 within the i-CLL subtype (Q = 0.04), whereas MYD88 mutations were only found in i-CLLs lacking IGLV3-21R110 (14% vs 0%; Q = 0.32). The total number of driver alterations was higher in i-CLLs expressing IGLV3-21R110 (mean, 2.8; range, 0-7) compared with non–IGLV3-21 i-CLLs (mean, 1.9; range, 0-5; P = .016) and m-CLLs (mean, 1.5; range, 0-5; P < .001) but rather inferior compared with n-CLLs (mean, 3.6; range, 0-11; P = .044). One IGLV3-21R110 i-CLL case did not harbor any previously identified driver alteration, and 3 cases carried del(13q) as a sole aberration (Figure 3B).
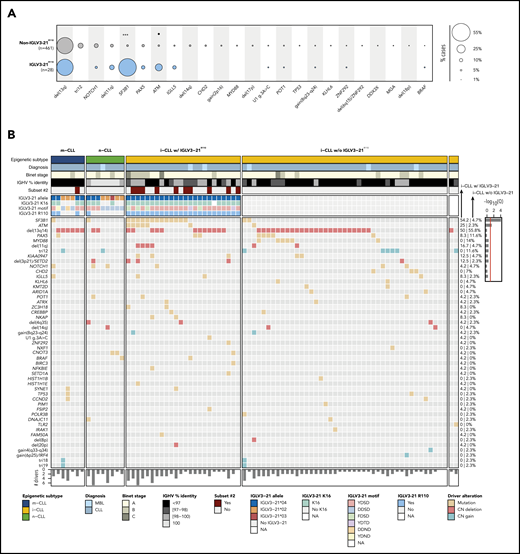
Genomic and immunogenetic landscapes of IGLV3-21R110 CLL. (A) Presence of specific driver alterations in cases with and without IGLV3-21R110. Driver alterations found in ≥10 cases are shown. Q values by Fisher’s exact test with Benjamini-Hochberg correction. (B) Oncoprint representation (variables in rows, cases in columns) showing main clinical variables (diagnosis and Binet stage), IGHV mutational status and subset 2, features associated with characterization of IGLV3-21, and CLL driver alterations. Bar plot represents total number of driver alterations for each case (bottom). Based on enrichment of IGLV3-21R110 in i-CLL subtype, all i-CLL cases are depicted for comparison purposes. In contrast, only m-CLL and n-CLL expressing IGLV3-21 are illustrated. Percentages represent fraction of cases carrying each specific driver alteration among IGLV3-21R110 i-CLL cases (left) and i-CLLs lacking IGLV3-21R110 (right). Bar plot represents Q values by Fisher’s exact test with Benjamini-Hochberg correction (right). Q < 0.1, ***Q < 0.0001. CN, copy number; NA, not available.
Genomic and immunogenetic landscapes of IGLV3-21R110 CLL. (A) Presence of specific driver alterations in cases with and without IGLV3-21R110. Driver alterations found in ≥10 cases are shown. Q values by Fisher’s exact test with Benjamini-Hochberg correction. (B) Oncoprint representation (variables in rows, cases in columns) showing main clinical variables (diagnosis and Binet stage), IGHV mutational status and subset 2, features associated with characterization of IGLV3-21, and CLL driver alterations. Bar plot represents total number of driver alterations for each case (bottom). Based on enrichment of IGLV3-21R110 in i-CLL subtype, all i-CLL cases are depicted for comparison purposes. In contrast, only m-CLL and n-CLL expressing IGLV3-21 are illustrated. Percentages represent fraction of cases carrying each specific driver alteration among IGLV3-21R110 i-CLL cases (left) and i-CLLs lacking IGLV3-21R110 (right). Bar plot represents Q values by Fisher’s exact test with Benjamini-Hochberg correction (right). Q < 0.1, ***Q < 0.0001. CN, copy number; NA, not available.
Transcriptomic profile of IGLV3-21R110 CLL
To determine whether CLL cases expressing IGLV3-21R110 had a distinct gene expression profile, we first performed a differential expression analysis comparing U-IGHV (n = 108) and M-IGHV (n = 186) cases in C1-CLL. This analysis revealed 825 DEGs between the 2 groups (603 and 222 genes were upregulated and downregulated, respectively, in U-IGHV cases; supplemental Table 10). In line with previous studies,37-41 ZAP70, LPL, and MSI2 were found among the top DEGs (supplemental Figure 4). As expected, a dimensionality reduction analysis based on the expression levels of these 825 genes clearly separated most M-IGHV and U-IGHV cases (Figure 4A, top). This clustering was not influenced by the presence of specific driver alterations (supplemental Figure 5). Interestingly, when considering epigenetic subtype, 60% of the i-CLL cases clustered with m-CLL and 1 case (2.5%) with n-CLL. Of note, 37.5% of i-CLL patients formed a small cluster between m-CLL and n-CLL cases, which also included 1 n-CLL and 2 m-CLL cases. This latter cluster included all but 1 IGLV3-21R110 case (Figure 4A, top). This remaining IGLV3-21R110 case (C1-CLL565; m-CLL/M-IGHV) clustered with m-CLL and non–IGLV3-21 i-CLL cases. This case had the YDND motif rather than YDSD or FDSD, suggesting that substitution of 1 residue of YDSD with an amino acid with different properties might impair the homotypic BCR-BCR interaction (Figure 4A, top). Altogether, C1-CLL565 was considered as non–IGLV3-21R110 in subsequent analyses. Also of interest, IGLV3-21wild-type cases clustered based on their IGHV mutational status, emphasizing the key role of the R110 mutation in defining transcriptional clusters (Figure 4A, top).
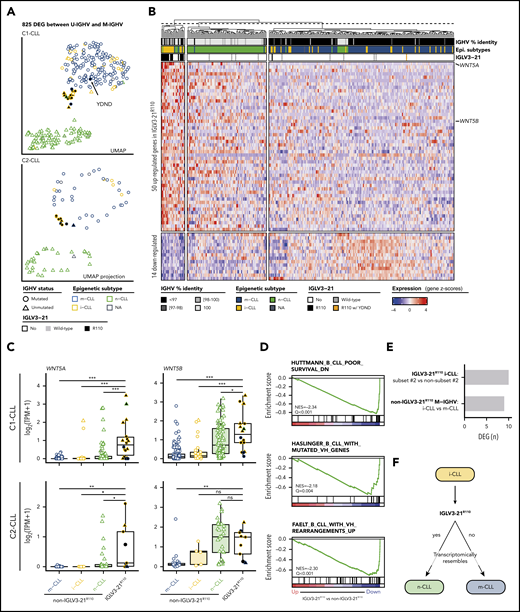
Gene expression profile of IGLV3-21R110 CLL. (A) UMAP representation of C1-CLL cases based on 825 DEGs between U-IGHV and M-IGHV cases (top). Projection of expression levels of these 825 genes from C2-CLL cases on previous UMAP embedding (bottom). C1-CLL565 carrying YDND motif is highlighted. (B) Heatmap representation of 64 DEGs between IGLV3-21R110 and non–IGLV3-21R110 cases. Genes are ordered based on their log2-transformed fold change. (C) Boxplots showing expression levels of WNT5A and WNT5B according to CLL subtype in C1-CLL (top) and C2-CLL (bottom). P values by Wilcoxon test. (D) Gene sets downregulated in IGLV3-21R110 CLL are related to genes downregulated in aggressive CLL (top) and genes upregulated in M-IGHV tumors (middle and bottom). (E) Number of DEGs between subset 2 and non–subset 2 i-CLL cases carrying IGLV3-21R110 as well as between i-CLL and m-CLL cases with M-IGHV and lacking IGLV3-21R110. (F) Summary of findings: cases carrying IGLV3-21R110 mutation have transcriptome mirroring that observed in n-CLL. Considering that most patients carrying IGLV3-21R110 belong to i-CLL subtype, this illustration aims to highlight that IGLV3-21R110 identifies a subset of i-CLL cases resembling n-CLL cases. In contrast, absence of this mutation is associated with phenotype typical of m-CLL tumors. P < .1, *P < .05, **P < .001, ***P < .0001. ns, not significant; TPM, gene-level transcripts per million.
Gene expression profile of IGLV3-21R110 CLL. (A) UMAP representation of C1-CLL cases based on 825 DEGs between U-IGHV and M-IGHV cases (top). Projection of expression levels of these 825 genes from C2-CLL cases on previous UMAP embedding (bottom). C1-CLL565 carrying YDND motif is highlighted. (B) Heatmap representation of 64 DEGs between IGLV3-21R110 and non–IGLV3-21R110 cases. Genes are ordered based on their log2-transformed fold change. (C) Boxplots showing expression levels of WNT5A and WNT5B according to CLL subtype in C1-CLL (top) and C2-CLL (bottom). P values by Wilcoxon test. (D) Gene sets downregulated in IGLV3-21R110 CLL are related to genes downregulated in aggressive CLL (top) and genes upregulated in M-IGHV tumors (middle and bottom). (E) Number of DEGs between subset 2 and non–subset 2 i-CLL cases carrying IGLV3-21R110 as well as between i-CLL and m-CLL cases with M-IGHV and lacking IGLV3-21R110. (F) Summary of findings: cases carrying IGLV3-21R110 mutation have transcriptome mirroring that observed in n-CLL. Considering that most patients carrying IGLV3-21R110 belong to i-CLL subtype, this illustration aims to highlight that IGLV3-21R110 identifies a subset of i-CLL cases resembling n-CLL cases. In contrast, absence of this mutation is associated with phenotype typical of m-CLL tumors. P < .1, *P < .05, **P < .001, ***P < .0001. ns, not significant; TPM, gene-level transcripts per million.
To validate these observations, we next projected the C2-CLL normalized RNA-seq expression counts of the 825 DEGs identified on the C1-CLL–derived UMAP embedding. We observed that C2-CLL cases clustered similarly on the previously identified scaffold, with IGLV3-21R110 cases clustering together and distantly from the remaining i-CLL cases (Figure 4A, bottom). Of note, although 3 cases from C2-CLL carried a YDTD motif rather than the described YDSD, all patients clustered together, suggesting that the YDTD motif might also allow autonomous BCR signaling similar to YDSD and FDSD. These results suggest that IGLV3-21R110 cases have a distinct transcriptomic profile different from that of non–IGLV3-21 i-CLL.
We next conducted a differential expression analysis between 17 IGLV3-21R110 and 277 non–IGLV3-21R110 cases from C1-CLL. The 17 cases included 14 i-CLLs, 2 m-CLLs, and 1 n-CLL. Case C1-CLL565 carrying the YDND motif was considered with the non–IGLV3-21R110 cases as defined. This analysis identified 64 DEGs: 50 upregulated and 14 downregulated in IGLV3-21R110 cases (Figure 4B; supplemental Table 11). The highest DEG was WNT5A, which was upregulated in IGLV3-21R110 tumors. WNT5B was also significantly upregulated in these cases (Figure 4B). These results were concordant in C2-CLL and verified by quantitative polymerase chain reaction with reverse transcriptase (Figure 4C; supplemental Table 12; supplemental Figure 6). As shown in Figure 4B, a UMAP dimensionality reduction analysis based on the 64 DEGs also revealed that most IGLV3-21R110 cases, including those with M-IGHV, clustered near n-CLL tumors, whereas non–IGLV3-21R110 i-CLL cases clustered with m-CLL cases. The UMAP embedding obtained from C1-CLL cases similarly clustered C2-CLL cases (supplemental Figure 7).
In line with the clustering of IGLV3-21R110 cases closer to n-CLL, a GSEA revealed that IGLV3-21R110 cases had low expression of genes downregulated in aggressive CLL as well as of genes upregulated in M-IGHV tumors (Figure 4D).42-44 Similar results were obtained when considering only M-IGHV cases (supplemental Figure 8). Gene sets upregulated in IGLV3-21R110 tumors were related to the activation of the mTORC1 complex, MYC regulation, and the p53 pathway (Q < 0.28; supplemental Figure 9). Of note, mTORC1- and p53-related gene sets were also upregulated in U-IGHV cases compared with M-IGHV (Q < 0.25; supplemental Figure 10). No differences in expression profile were observed between subset 2 (n = 6) and non–subset 2 (n = 8) i-CLLs carrying IGLV3-21R110 (Figure 4E; supplemental Table 13). However, the profile of non–IGLV3-21R110 i-CLL (n = 23; all M-IGHV) was similar to that of m-CLL/M-IGHV (n = 153; Figure 4E; supplemental Table 14). Overall, the transcriptomic profile of IGLV3-21R110 tumors mirrored the phenotype of n-CLL/U-IGHV cases, although they had a specific signature of 64 genes with WNT5A/B as hallmarks (Figure 4F).
Clinical implications
In our cohort (C1-CLL), IGLV3-21R110 disease was associated with shorter TTFT (P < .001) and tended to indicate shorter OS (P = .099) compared with non–IGLV3-21R110 disease (supplemental Figure 11). The prognostic value of IGLV3-21R110 was independent of IGHV mutational status for TTFT but not for OS (Figure 5A-C). The clinical value of IGLV3-21R110 was also independent of subset 2 and borderline (97% to 98%) IGHV identity (supplemental Figures 12-13; Figure 5C). Note that borderline IGHV cases lacking IGLV3-21R110 had similar TTFT and OS than cases with <97% IGHV identity (supplemental Figure 13). We next speculated that IGLV3-21R110, present in 38% of i-CLL cases, could influence the evolution of i-CLL. First, we confirmed that i-CLL cases as a whole had intermediate TTFT between m-CLL and n-CLL (Figure 5D).15,16 Next, we divided the i-CLL cases based on presence or absence of IGLV3-21R110 and observed that IGLV3-21R110 i-CLL patients had a TTFT similar to that of n-CLL patients. In contrast, non–IGLV3-21R110 i-CLL patients had a longer TTFT, similar to that in m-CLL (Figure 5E). A multivariate analysis including IGLV3-21R110 and epigenetic subtype confirmed that IGLV3-21R110 and n-CLL subtype retained independent prognostic value for TTFT. Of note, the i-CLL subtype did not maintain independent prognostic value (Figure 5F).
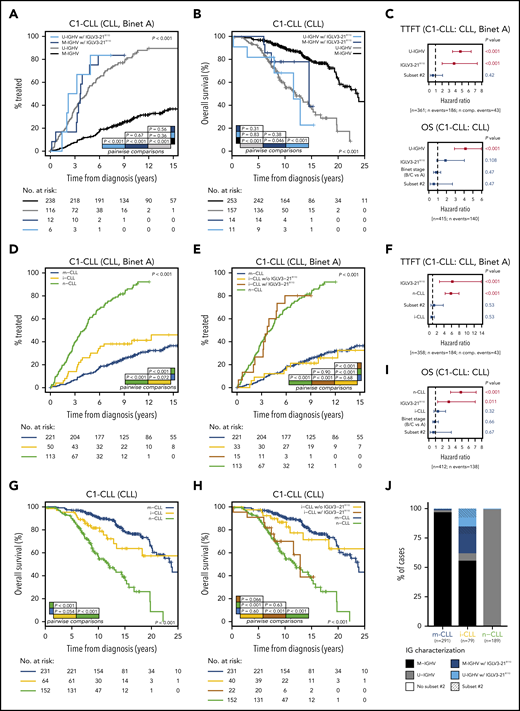
Clinical impact of IGLV3-21R110 according to IGHV and epigenetic classifications. (A) Comparison of TTFT among patients with CLL stratified according to IGHV status and presence or absence of IGLV3-21R110. (B) OS of patients with CLL according to IGHV status and presence or absence of IGLV3-21R110. (C) Multivariate analysis of TTFT (top) and OS (bottom) integrating IGHV status, stereotype subset 2, and IGLV3-21R110. (D) Comparison of TTFT among patients with CLL grouped according to epigenetic classification. (E) Comparison of TTFT of CLL patients classified according to epigenetic subtype and presence of IGLV3-21R110. Note that i-CLL cases were divided according to presence or absence of R110 mutation. (F) Multivariate analysis of TTFT integrating epigenetic subtype (m-CLL, i-CLL, or n-CLL), stereotype subset 2, and IGLV3-21R110. (G) Comparison of OS among patients classified according to epigenetic subtype. (H) Same as panel G but dividing i-CLL cases according to presence or absence of IGLV3-21R110. (I) Multivariate analysis of OS integrating epigenetic subtype, stereotype subset 2, and IGLV3-21R110. (J) Bar plot showing relationship between epigenetic subtype, IGHV mutational status, stereotype subset 2, and presence of IGLV3-21R110. N comp. events, number of competing events for TTFT.
Clinical impact of IGLV3-21R110 according to IGHV and epigenetic classifications. (A) Comparison of TTFT among patients with CLL stratified according to IGHV status and presence or absence of IGLV3-21R110. (B) OS of patients with CLL according to IGHV status and presence or absence of IGLV3-21R110. (C) Multivariate analysis of TTFT (top) and OS (bottom) integrating IGHV status, stereotype subset 2, and IGLV3-21R110. (D) Comparison of TTFT among patients with CLL grouped according to epigenetic classification. (E) Comparison of TTFT of CLL patients classified according to epigenetic subtype and presence of IGLV3-21R110. Note that i-CLL cases were divided according to presence or absence of R110 mutation. (F) Multivariate analysis of TTFT integrating epigenetic subtype (m-CLL, i-CLL, or n-CLL), stereotype subset 2, and IGLV3-21R110. (G) Comparison of OS among patients classified according to epigenetic subtype. (H) Same as panel G but dividing i-CLL cases according to presence or absence of IGLV3-21R110. (I) Multivariate analysis of OS integrating epigenetic subtype, stereotype subset 2, and IGLV3-21R110. (J) Bar plot showing relationship between epigenetic subtype, IGHV mutational status, stereotype subset 2, and presence of IGLV3-21R110. N comp. events, number of competing events for TTFT.
Similar results were observed for OS. Although i-CLL cases as a whole had an intermediate OS between m-CLL and n-CLL (Figure 5G),15,16 IGLV3-21R110 identified i-CLL cases with shorter OS, similar to that of n-CLL patients, whereas non–IGLV3-21R110 i-CLL cases had longer OS, similar to that of m-CLL patients (Figure 5H). A multivariate analysis confirmed the independent prognostic value of IGLV3-21R110 and n-CLL subtype, whereas the i-CLL subtype lost its prognostic prediction (Figure 5I).
In terms of applicability in the clinic, IGLV3-21R110, U-IGHV, and n-CLL subtypes identified patients with aggressive disease. In our cohorts, all n-CLL cases were classified as U-IGHV, whereas 98% of m-CLL cases were M-IGHV (Figure 5J). Therefore, both complete immunoglobulin characterization (IGHV mutational status and IGLV3-21R110) and integration of the n-CLL subtype and IGLV3-21R110 identified virtually the same subset of patients with aggressive disease.
Discussion
Recent studies have highlighted the relevance of antigen-independent, autonomous BCR signaling in CLL pathogenesis.9-11 A single point mutation (R110) in IGLV3-21–expressing cells allows BCR-BCR interactions, triggering BCR signaling, and is associated with poor clinical outcomes.10,11 Here, we studied IGLV3-21R110 in 584 CLL cases in the context of epigenetic classification of tumors as well as their genomic and transcriptomic profiles. We found that IGLV3-21R110 identified 38% of i-CLL cases with aggressive disease similar to n-CLL and retained independent prognostic value in multivariate analyses including epigenetic and IGHV classifications.
After characterizing the complete immunoglobulin gene rearrangement of a large cohort of CLL patients using WGS, WES, and RNA-seq data, we identified 6.5% of cases carrying IGLV3-21R110, which was significantly enriched in i-CLL (38%) compared with m-CLL (1.7%) and n-CLL (0.5%).18 In all IGLV3-21R110 cases, the IGLV3-21*04 allele was rearranged rather than the reported IGLV3-21*01 allele.11 The IGLV3-21*04 allele was recently added on the updated IMGT release and differs from the IGLV3-21*01 allele by 1 nucleotide.13 As previously observed,11,12,45 all stereotype subset 2 CLLs expressed IGLV3-21R110. Subset 2 CLL is well known for its aggressive disease course.45-48 Nonetheless, 62% IGLV3-21R110 cases carried nonstereotyped immunoglobulins with similar genetic and transcriptomic profiles, emphasizing that this biological subgroup of CLL is defined by IGLV3-21R110. This idea was also supported by the observed similar gene expression profile of subset 2 and non–subset 2 IGLV3-21R110 cases. Our transcriptomic analyses also showed that IGLV3-21R110 i-CLL tumors, although varied in terms of IGHV mutational status, resembled n-CLL/U-IGHV tumors, confirming their similar protein expression profile.11 We also identified that IGLV3-21R110 upregulated WNT5A, a ligand of ROR1/2, the upregulation of which has been related to increased chemotaxis and proliferation of CLL cells and associated with poor clinical outcomes.49,50 Interestingly, high WNT5A expression levels were detected in CLL with borderline IGHV identity.50 On the basis of the borderline IGHV identity observed in IGLV3-21R110 i-CLL, we can speculate that these previous findings were related to i-CLL cases expressing IGLV3-21R110.
Previous studies revealed that i-CLL carried significantly high numbers of SF3B1, ATM, and MYD88 mutations.18,20 We showed that SF3B1 and ATM mutations in the i-CLL subtype were virtually exclusive of IGLV3-21R110 cases. We also identified that IGLV3-21R110 i-CLL cases carried a higher number of driver alterations than non–IGLV3-21R110 i-CLL cases. However, IGLV3-21R110 was the only alteration in 1 patient who had been considered as having driverless disease based on the 104 CLL drivers identified in previous genomic studies,20,26,27 and 3 cases carried a sole del(13q), supporting the idea that the R110 mutation could be an initiating event in CLL development. In this regard, this mutation was also found in 2 (3.7%) high-count MBL samples. Overall, these results show that IGLV3-21R110 i-CLL tumors resemble n-CLL/U-IGHV tumors and have features associated with aggressive disease (subset 2, SF3B1 and ATM mutations), although some cases in our study harbored good prognostic markers, such as no other drivers or del(13q).
We also found that i-CLLs lacking IGLV3-21R110 were not stereotyped, had a higher IGHV mutational load than IGLV3-21R110 i-CLL, had frequently rearranged IGLV3-25 and IGKV1-8 genes, lacked SF3B1 and ATM but had MYD88 mutations, and phenotypically resembled m-CLL/M-IGHV tumors. Therefore, IGLV3-21R110 splits i-CLL cases into 2 subtypes with clear differences in their genomic and transcriptomic makeups.
In agreement with the aggressive phenotype associated with IGLV3-21,11,12 we found here that IGLV3-21R110 had marked clinical implications for the epigenetic classification of CLL.15 i-CLL, which has been associated with intermediate prognosis between m-CLL and n-CLL,15-18 could be divided in 2 subgroups of cases with opposite clinical evolutions. IGLV3-21R110 i-CLL cases had an aggressive disease course, with shorter TTFT and OS, similar to n-CLL, whereas non–IGLV3-21R110 i-CLL cases had an indolent disease course, with longer TTFT and OS, similar to m-CLL. In this line, IGLV3-21R110 retained independent prognostic value in multivariate models including epigenetic and IGHV classifications of tumors. In practical terms, complete immunoglobulin characterization (IGHV mutational status and IGLV3-21R110) identified virtually the same subset of patients as epigenetic-based n-CLL subtype and IGLV3-21R110. Altogether, our results refine the prognostic value of epigenetic classification and emphasize the need to determine IGLV3-21R110 status in clinical practice.
We have characterized the link between epigenetic i-CLL and IGLV3-21R110, showing that IGLV3-21R110 has prognostic value beyond the IGHV and epigenetic classifications of CLL. This subgroup of cases also has a particular transcriptional profile overexpressing WNT5A/B and genes of different pathways associated with aggressive behavior in CLL. These findings support the identification of IGLV3-21R110 CLL as a particular disease subgroup with relevance in the risk stratification of patients.
All sequencing data have been obtained from previous publications. We have quoted the appropriate references in the manuscript. Additional information can be found in the data supplement or is available from the authors upon reasonable request.
The online version of this article contains a data supplement.
The publication costs of this article were defrayed in part by page charge payment. Therefore, and solely to indicate this fact, this article is hereby marked “advertisement” in accordance with 18 USC section 1734.
Acknowledgments
The authors thank the Hematopathology Collection registered at the Biobank of Hospital Clínic, Institut d’Investigacions Biomèdiques August Pi i Sunyer, for sample procurement, and Sílvia Ruiz for her logistical assistance. This work was partially developed at the Centre Esther Koplowitz (Barcelona, Spain).
This study was supported by the “la Caixa” Foundation (CLLEvolution LCF/PR/HR17/52150017; Health Research 2017 Program HR17-00221) (E.C.), the European Research Council under the EU Horizon 2020 research and innovation program BCLLatlas 810287 (E.C.), the Instituto de Salud Carlos III and the European Regional Development Fund “Una manera de hacer Europa” (project PMP15/00007) (E.C.), the Generalitat de Catalunya Suport Grups de Recerca AGAUR 2017-SGR-1142 (E.C.), and CERCA Programme/Generalitat de Catalunya. F.N. is supported by a predoctoral fellowship of the Ministerio de Ciencia e Innovación (BES-2016-076372). E.C. is an academia researcher of the Institució Catalana de Recerca i Estudis Avançats of the Generalitat de Catalunya.
Authorship
Contribution: F.N. designed the study, collected, analyzed, and interpreted data, and wrote the manuscript; R.R. collected, analyzed, and interpreted data; G.C., M.D.-F., P.J., X.S.P., and J.I.M.-S. interpreted data; J.L., T.Z., and T.B. collected data; S.M. performed experiments; A.N. and J.D. collected and interpreted data; E.C. designed the study, collected and interpreted data, wrote the manuscript, and directed the research; and all authors read, commented on, and approved the manuscript.
Conflict-of-interest disclosure: F.N. has received honoraria from Janssen for speaking at educational activities. E.C. has received research funding from Gilead Sciences, has been a consultant for Takeda and Illumina, has received honoraria from Janssen and Roche for speaking at educational activities, and is an inventor on Lymphoma and Leukemia Molecular Profiling Project patent “Method for subtyping lymphoma subtypes by means of expression profiling” (PCT/US2014/64161) not related to this project. The remaining authors declare no competing financial interests.
The current affiliation for T.B. is Hematology Department, Hospital Universitario 12 de Octubre, Madrid, Spain.
Correspondence: Ferran Nadeu, Centre Esther Koplowitz, Rosselló 153, 08036, Barcelona, Spain; e-mail: nadeu@clinic.cat; and Elías Campo, Unitat Hematopatologia, Hospital Clínic, Villarroel 170, 08036, Barcelona, Spain; e-mail: ecampo@clinic.cat.
