

Key Points
Isolated PE is well-differentiable from DVT-associated PE based on its acute plasma proteome, suggesting a distinct pathophysiology.
In an external validation in a population-based cohort, the majority of isolated PE-related proteins predicted incident primary isolated PE.

Abstract
Patients with isolated pulmonary embolism (PE) have a distinct clinical profile from those with deep vein thrombosis (DVT)-associated PE, with more pulmonary conditions and atherosclerosis. These findings suggest a distinct molecular pathophysiology and the potential involvement of alternative pathways in isolated PE. To test this hypothesis, data from 532 individuals from the Genotyping and Molecular Phenotyping of Venous ThromboEmbolism Project, a multicenter prospective cohort study with extensive biobanking, were analyzed. Targeted, high-throughput proteomics, machine learning, and bioinformatic methods were applied to contrast the acute-phase plasma proteomes of isolated PE patients (n = 96) against those of patients with DVT-associated PE (n = 276) or isolated DVT (n = 160). This resulted in the identification of shared molecular processes between PE phenotypes, as well as an isolated PE-specific protein signature. Shared processes included upregulation of inflammation, response to oxidative stress, and the loss of pulmonary surfactant. The isolated PE-specific signature consisted of 5 proteins: interferon-γ, glial cell line–derived neurotrophic growth factor, polypeptide N-acetylgalactosaminyltransferase 3, peptidyl arginine deiminase type-2, and interleukin-15 receptor subunit α. These proteins were orthogonally validated using cis protein quantitative trait loci. External replication in an independent population-based cohort (n = 5778) further validated the proteomic results and showed that they were prognostic for incident primary isolated PE in individuals without history of VTE (median time to event: 2.9 years; interquartile range: 1.6-4.2 years), supporting their possible involvement in the early pathogenesis. This study has identified molecular overlaps and differences between VTE phenotypes. In particular, the results implicate noncanonical pathways more commonly associated with respiratory and atherosclerotic disease in the acute pathophysiology of isolated PE.
Introduction
Studies using whole-body magnetic resonance or computed tomography imaging have estimated that more than 50% of pulmonary embolisms (PE) may be classifiable as isolated,1,2 challenging the widely held view that PE necessarily results from the causative embolization of a deep vein thrombosis (DVT). Therefore, isolated PE could be distinct from other phenotypes of venous thromboembolism (VTE).1-3
A range of pulmonary conditions, including bronchial asthma,4 chronic obstructive pulmonary disease (COPD),5 lung carcinoma,6 thoracic surgery,7 exposure to air pollutants,8 and infectious respiratory disease,9-11 have previously been associated with an increased risk of PE without necessitating the presence of DVT. Such findings are suggestive of the possibility that isolated PE may arise under the influence of local processes.
Several studies have demonstrated that the clinical profile of patients presenting with isolated PE differs significantly from that of patients presenting with conventional manifestations of VTE like DVT-associated PE or isolated DVT. In particular, patients with isolated PE have a significantly greater atherosclerotic disease burden, as demonstrated in large cross-sectional studies.12,13 Recently, a prospective study from our group into this phenomenon found that patients with isolated PE are at elevated risk of incident arterial thrombotic events during the first 3 years following diagnosis of the acute event compared with other VTE phenotypes.14
Given the literature suggesting that isolated PE may have a distinct etiology, pathophysiology, and clinical profile, we hypothesized that the molecular signature of isolated PE might be differentiable from that of other VTE phenotypes and that it could help to elucidate the pathophysiology and the mechanisms involved. To test this hypothesis, targeted proteomics technology and machine learning techniques were combined to analyze blood samples of patients with acute isolated PE, DVT-associated PE, and isolated DVT.
Methods
Study participants and methods
For this study, data from the Genotyping and Molecular Phenotyping of Venous ThromboEmbolism (GMP-VTE) Project were analyzed. The GMP-VTE project is a multicenter prospective cohort study initiated by academic investigators of the University Medical Center of the Johannes Gutenberg University, Mainz, Germany, with the primary aim of identifying new endotypes (ie, subphenotypes) of VTE. The GMP-VTE project includes VTE patients from 2 previously registered prospective cohort studies: VTEval (ClinicalTrials.gov identifier: NCT02156401) and FOCUS Bioseq (German clinical trials registry identifier: DRKS00005939). Patient consent and ethics approval for both studies were obtained before study enrollment. The GMP-VTE Project adheres to the Declaration of Helsinki and is conducted in line with Good Epidemiological Practices.
The GMP-VTE project enrolled patients with imaging-validated diagnosis of acute VTE and collected extensive clinical and medication-related information. Patients were enrolled in the acute phase of VTE, at the time of indication for diagnostic imaging or shortly after imaging had confirmed the diagnosis. Diagnostic modalities were whole-leg color Doppler ultrasonography in case of suspected DVT and computed tomographic pulmonary angiography or ventilation/perfusion scintigraphy in case of suspected PE. To assess the full extent of the thrombus burden, all patients diagnosed with PE additionally received whole-leg imaging to screen systematically for the presence of concomitant DVT, in accordance with standard operating procedures at the participating centers. All diagnoses were adjudicated and validated by board-certified medical specialists (eg, angiologists, radiologists). Venous blood samples were obtained from each patient and subsequently stored in a centralized biobank with highly standardized preprocessing of biomaterials and automated temperature control for further analysis. In-depth information regarding all methodological aspects of the GMP-VTE project can be found elsewhere.15
Protein profiling
Blood plasma was obtained from patients during the diagnostic workup for acute VTE. Once-thawed EDTA-treated blood plasma samples were analyzed with proximity extension assay technology (Olink Biosciences, Uppsala, Sweden), a targeted method of protein expression quantification that produces normalized expression values.16 Five panels (trade names: Cardiovascular II, Cardiovascular III, Cardiometabolic, Inflammation, Immune Response), capable of quantifying the expression of 444 unique proteins, were used for analysis. A full list of all 444 proteins and their abbreviations, as used throughout this paper, is provided in supplemental Table 1 on the Blood Web site. A more detailed description of the protein profiling methodology and quality control procedures has been provided recently for the GMP-VTE Project.15
Genotyping
Genotyping of the samples was performed using the Illumina Infinium Omni2.5Exome-8 v1.3 BeadChip according to the manufacturers' protocol using an automated workflow (Life & Brain GmbH, Bonn, Germany). Genotypes were called using GenomeStudio 2.0 (Illumina, Inc, San Diego, CA) and the supported Illumina cluster file. Quality control and filtering was done using GenomeStudio 2.0 (Illumina, Inc) and PLINK1.9 according to basic quality parameters, as described previously.15
Statistical analysis
Given the large influence of cancer on protein expression, individuals with active malignancy were excluded from analysis. VTE patients were classified in 3 phenotypes: subjects with isolated PE, DVT-associated PE, and isolated DVT. Isolated PE was defined as a PE without evidence of a concomitant DVT during the acute VTE event. DVT-associated PE was defined as an acute PE in the presence of acute DVT. Isolated DVT was defined as acute DVT without evidence of concomitant acute PE.
Normalized protein expression levels were computed for each VTE phenotype, quantifying phenotype-specific expression as percent standard deviation (SD) change relative to the global expression average (ie, the mean expression level per protein across the full study sample). A heatmap was generated for the proteins with the 10% highest or lowest expression within the isolated PE phenotype relative to the global average.
Least absolute shrinkage and selection operator (LASSO)-regularized logistic regression models, with 10-fold cross-validation, were used for the identification of protein signatures. Nonlinear relationships were captured by fractional polynomial transformations. All analyses were adjusted for age, sex, body mass index, study center and baseline intake of relevant medications (ie, oral antithrombotics [Anatomical Therapeutic Chemical code: B01A], nonsteroidal anti-inflammatory drugs [M01A], oral contraceptives [G03AA, G02BB], and corticosteroids [H02A]). The λ ratio, a scale-invariant measure of predictive robustness of each protein, was calculated. More detail regarding these analyses is given in supplemental extended methods.
Spearman’s rank-order correlation tests were conducted between model-selected proteins and all other proteins for which the expression level was measured to facilitate network and pathway analyses.
All data preprocessing and analysis was conducted using the statistical software package R, version 3.5.0 (R Foundation for Statistical Computing, Vienna, Austria).
Protein quantitative trait loci-based orthogonal validation
The specificity of the proximity extension assays for their target antigens was orthogonally validated with pooled genotype and proteomics data from 2 hospital-based patient cohorts using identical proximity extension assays, the GMP-VTE project and the MyoVasc study, a prospective cohort study of chronic heart failure patients (N = 3289) based in Mainz, Germany.17 For the orthogonal validation of the main proteomic findings, cis protein quantitative trait loci (cis pQTLs) were identified based on literature and by screening all single nucleotide polymorphisms (SNPs) within the region 500 bp upstream of the transcription start sites until the transcription end sites of their respective genes because the strength of the association between cis pQTLs and protein expression is inversely proportional to their distance from the transcription start site.18 The identified SNPs were subsequently related to the plasma protein concentrations in linear regression models adjusted for age, sex, and study cohort to confirm each SNP as pQTL. Finally, weighted scores were created based on these SNPs and the coefficient estimates obtained in the aforementioned models, and then related to protein levels in both cohorts. A detailed description of the methodology for this orthogonal validation is provided in supplemental extended methods II.
External validation cohort
The Gutenberg Health Study (GHS), a large (N = 15 010), population-based prospective cohort study based in Mainz, Germany, was used as an external validation cohort for the proteomic findings generated by the GMP-VTE Project. All study procedures were described in detail previously.19 In a large subset of the GHS, EDTA plasma from study participants was measured using the Inflammation panel of the identical targeted proteomics assay as was used in the GMP-VTE study, allowing external validation of those findings related to inflammatory mechanisms.
For this analysis, individuals with active cancer (defined as cancer diagnosis within 5 years of enrollment), a history of VTE, and no availability of proteomic measurements were excluded. All inflammation-related proteins identified in relation to isolated PE in the acute-phase setting of the GMP-VTE project were evaluated for their prognostic ability of incident primary isolated PE in this independent external validation cohort. These analyses were performed using individual Cox proportional hazards regression models for each protein, adjusted for age, sex, body mass index, cardiovascular disease, COPD, cardiovascular risk factors and intake of antithrombotic medication, nonsteroidal anti-inflammatory drugs, corticosteroids, and oral contraceptives.
Bioinformatic analysis
Bioinformatic methods were used to aid in the interpretation of the results. STRING20 network analysis (http://string-db.org) was performed to identify functional protein association networks among proteins associated with the isolated PE phenotype. More information on this procedure is given in supplemental extended methods. The Markov clustering algorithm,21 an unsupervised stochastic clustering method for graphs that clusters strongly interconnected nodes, was applied to the resulting network to further identify subclusters.
Further, the text mining module Medscan from the Elsevier Pathway Studio Enterprise software (https://www.pathwaystudio.com/), version 11.4.0, was used to survey publications in the PubMed database (https://www.ncbi.nlm.nih.gov/pubmed/) for appearance of the identified proteins in various disease contexts. Chord diagrams were used to indicate the disease contexts in which the identified proteins had previously received most scientific attention.
Results
Sample characteristics
Sample characteristics for all patients, stratified by VTE phenotype, are displayed in Table 1. The total sample size, after exclusion of patients with active malignancy (n = 81) or missing information for cancer status (n = 9), comprised 532 individuals. Females were relatively overrepresented among the isolated PE phenotype compared with other VTE phenotypes. Patients with isolated PE were much less often obese (prevalence in isolated PE: 19.8%) than patients with other manifestations of VTE (DVT-associated PE: 45.3%; isolated DVT: 31.8%). The number of active smokers was comparable among PE phenotypes (isolated PE: 12.4%; DVT-associated PE: 14.4%), whereas the proportion of smokers among patients presenting with isolated DVT was nearly twofold that of patients with PE.
Sample characteristics stratified by VTE phenotype
| Isolated PE(n = 96) | DVT-associated PE(n = 276) | Isolated DVT(n = 160) | |
|---|---|---|---|
| Female, % (n) | 52.1 (50) | 42 (116) | 41.2 (66) |
| Age, y | 61.3 (17.7) | 61.7 (15.6) | 56 (16.1) |
| Body mass index, kg/m2 | 28 (7.3) | 30.3 (5.9) | 27.8 (5.5) |
| VTE risk factors | |||
| History of VTE, % (n) | 16.9 (15) | 34.7 (91) | 33.3 (53) |
| History of DVT, % (n) | 13.5 (12) | 29.9 (78) | 32.7 (52) |
| History of PE, % (n) | 5.4 (5) | 14.9 (39) | 5.7 (9) |
| Pregnancy, % (n) | 0 (0) | 0.7 (2) | 1.9 (3) |
| Recent immobilization, % (n) | 11.8 (11) | 14.2 (38) | 14.4 (23) |
| Recent long-distance travel, % (n) | 10.9 (10) | 12.2 (32) | 16.9 (27) |
| Recent surgery, % (n) | 8.6 (8) | 3.7 (10) | 4.4 (7) |
| Recent trauma, % (n) | 3.2 (3) | 4.9 (13) | 6.9 (11) |
| Diagnosed thrombophilia, % (n) | 0 (0) | 3.3 (7) | 5.8 (9) |
| Genotyping | |||
| rs6025 (factor V Leiden) | |||
| Heterozygous carrier, % (n) | 3.8 (3) | 14.1 (35) | 19 (27) |
| Homozygous carrier, % (n) | 0 (0) | 0.8 (2) | 1.4 (2) |
| rs1799963 (prothrombin G20210A) | |||
| Heterozygous carrier, % (n) | 1.3 (1) | 6.5 (16) | 6.4 (9) |
| Homozygous carrier, % (n) | 0 (0) | 0.4 (1) | 0 (0) |
| Cardiovascular risk factors | |||
| Active smoking, % (n) | 12.4 (11) | 14.3 (36) | 25 (40) |
| Arterial hypertension, % (n) | 49.5 (46) | 59.9 (154) | 35.7 (56) |
| Diabetes mellitus, % (n) | 16.1 (15) | 14.4 (37) | 9.4 (15) |
| Obesity, % (n) | 19.8 (19) | 45.3 (120) | 31.8 (47) |
| Comorbidities | |||
| Atrial fibrillation, % (n) | 5.4 (5) | 5.1 (13) | 2.5 (4) |
| Chronic kidney disease, % (n) | 7.6 (7) | 5.4 (14) | 3.8 (6) |
| Chronic liver disease, % (n) | 2.2 (2) | 7.4 (19) | 3.8 (6) |
| Chronic pulmonary disease, % (n) | 17.2 (16) | 10 (27) | 11.4 (18) |
| Congestive heart failure, % (n) | 9.7 (9) | 5.6 (14) | 1.9 (3) |
| Coronary artery disease, % (n) | 7.7 (7) | 7.5 (19) | 5.7 (9) |
| History of stroke, % (n) | 4.3 (4) | 7.8 (20) | 0.6 (1) |
| Peripheral artery disease, % (n) | 11.4 (5) | 3 (5) | 3.2 (5) |
| Pulmonary hypertension, % (n) | 1.1 (1) | 1.6 (4) | 0.6 (1) |
| Laboratory markers | |||
| Creatinine, mg/dL | 0.9 (0.8-1.1) | 0.9 (0.8-1.2) | 0.9 (0.8-1) |
| C-reactive protein, mg/L | 14 (3.9-62.8) | 24 (9.1-54.8) | 6.2 (2.7-14.7) |
| D-dimer, mg/L | 2.3 (1.2-7.2) | 4.7 (2.7-11.1) | 1.4 (0.8-4) |
| eGFR, mL/min/1.73 m2 | 74.8 (24.5) | 74.6 (22.4) | 85.1 (22.9) |
| Hematocrit, % | 39.7 (4.5) | 40.9 (5.2) | 41.1 (4.7) |
| Leukocytes, /nL | 8.6 (6.7-11.4) | 9.3 (7.1-11.6) | 7.4 (6-9.5) |
| Platelet count, /nL | 239 (204-289) | 234 (185-287) | 237 (188-290) |
| Troponin I, pg/mL | 10.3 (2.9-38.6) | 16.3 (4.2-60.2) | 2.2 (1.5-4.3) |
| Medication | |||
| Antithrombotic agents (B01A), % (n) | 88.5 (85) | 91.7 (253) | 76.2 (122) |
| Anticoagulants (B01A, excluding B01AC), % (n) | 76 (73) | 81.9 (226) | 69.4 (111) |
| Antiplatelet agents (B01AC), % (n) | 33.3 (32) | 35.5 (98) | 13.1 (21) |
| NSAIDs (M01A), % (n) | 1 (1) | 5.4 (15) | 6.2 (10) |
| Contraceptives (G03AA, G02BB), % (n) | 5.2 (5) | 3.3 (9) | 6.9 (11) |
| Corticosteroids (H02A), % (n) | 7.3 (7) | 9.1 (25) | 5.6 (9) |
Ranges in parentheses denote interquartile ranges and are shown for non-normally distributed variables. Single numbers in parentheses indicate the SD, shown for normally distributed variables. Percentages were calculated based on non-missing data. Individuals with active cancer were excluded from this analysis. All information regarding morbidity, cardiovascular risk factors, and VTE-specific risk factors was determined anamnestically and from the available medical files. Complete or lower limb immobilization, travel, surgery, and trauma were considered recent if they had occurred within 30 days before the baseline event. For medications, Anatomic Therapeutic Chemical (ATC) codes are shown beside the class in parentheses.
eGFR, estimated glomerular filtration rate; NSAIDs, nonsteroidal anti-inflammatory drugs.
Patients presenting with the isolated PE phenotype had a history of VTE approximately one-half as often as those presenting with other phenotypes, and none of the isolated PE patients had diagnosed thrombophilia, contrasting with moderate rates among the other patients. Genotyping confirmed that patients presenting with isolated PE had the lowest proportion of carriers of the factor V Leiden or prothrombin G20210A mutations. In addition, patients presenting with isolated PE more often had invasive surgery in their recent history (prevalence: 8.6% vs DVT-associated PE: 3.7%; isolated DVT: 4.4%).
Concerning the comorbidity profile, patients with isolated PE had higher rates of atherosclerotic disease, especially congestive heart failure and peripheral artery disease. In addition, patients with the isolated PE phenotype more often had chronic pulmonary disease, defined as bronchial asthma or COPD.
The evaluation of standard laboratory markers indicated that C-reactive protein (CRP) and D-dimer concentrations were highest in DVT-associated PE patients (CRP: 24 mg/L; D-dimer: 4.7 mg/L), followed by patients with isolated PE (CRP: 14 mg/L; D-dimer: 2.3 mg/L), who still had, respectively, 2.3- and 1.6-fold higher concentrations of these markers than patients with isolated DVT (CRP: 6.2 mg/L; D-dimer: 1.4 mg/L). Troponin I concentrations followed a similar pattern. With regard to medication, patients presenting with both PE phenotypes had higher antiplatelet agent use than those with isolated DVT. Corticosteroid use was approximately equal between PE phenotypes, but isolated PE patients took nonsteroidal anti-inflammatory drugs less often than patients with other VTE phenotypes.
Differential protein expression by VTE phenotype
Figure 1 shows the proteins with the 10% highest or lowest expression within the isolated PE phenotype, relative to the global aver-age expression level across study participants. Interferon-γ (IFN-γ; percent SD change relative to global average expression, Δ = 24.7%), polypeptide N-acetylgalactosaminyltransferase 3 (GALNT3, Δ = 21.2%), and β-nerve growth factor (Δ = 18.4%) were among the proteins with the highest expression within the isolated PE phenotype. Conversely, cathepsin D (Δ = −26.2%), α-l-iduronidase (Δ = −24.4%), and plasminogen activator inhibitor-1 (Δ = −23.1%) were the proteins with the lowest expression in the isolated PE phenotype. Relative expression levels for all proteins are listed in supplemental Table 2.

Deviation in protein expression of VTE phenotypes compared with the global average of the study sample. The proteins with the 10% highest or lowest expression within the isolated PE phenotype vs the global average. Proteins are listed in alphabetical order. The middle and rightmost columns show the same for the DVT-associated PE and isolated DVT phenotypes, respectively. Percentages indicate percent standard deviation (eg, 16% denotes a 0.16 SD difference compared with the global mean).
Deviation in protein expression of VTE phenotypes compared with the global average of the study sample. The proteins with the 10% highest or lowest expression within the isolated PE phenotype vs the global average. Proteins are listed in alphabetical order. The middle and rightmost columns show the same for the DVT-associated PE and isolated DVT phenotypes, respectively. Percentages indicate percent standard deviation (eg, 16% denotes a 0.16 SD difference compared with the global mean).
Machine learning-based protein selection
In Figure 2, the selected proteins and model characteristics are shown for the LASSO-regularized regression models. In the isolated PE vs isolated DVT model, 56 proteins (total number of selected variables, including adjustment covariates: 61) were selected, providing an area under the curve (AUC) of 0.96 (10-fold cross-validated AUC: 0.68), indicating good discrimination between the phenotypes based on the expression levels for these proteins. The isolated PE vs DVT-associated PE model achieved an AUC of 0.76 (10-fold cross-validated AUC: 0.59) using the expression levels of just 18 proteins (total number of selected variables: 19). Finally, the DVT-associated PE vs isolated DVT model, which served as a control comparison, also had high discriminatory ability (AUC: 0.89, 10-fold cross-validated AUC: 0.68), selecting 61 proteins (total number of selected variables: 65). Model overlaps, indicating common signatures, were indicated with colors. All model estimates, including those for all adjustment covariates and fractional polynomial transformations, are shown in supplemental Tables 3-5; proteins highly correlated with model-identified proteins are summarized in supplemental Tables 6-8.
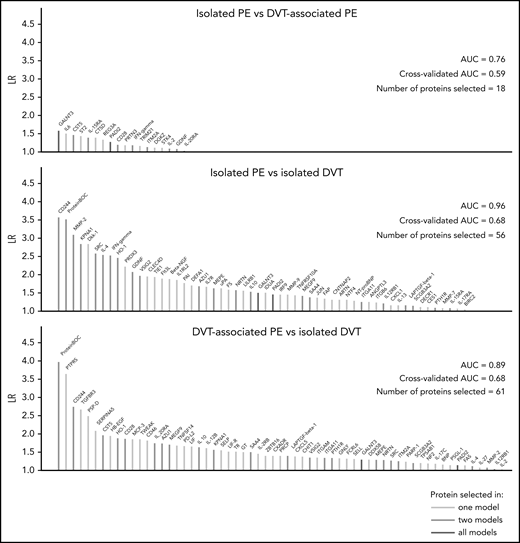
Machine learning–based analysis of differences in protein expression between VTE phenotypes. This figure displays the number of proteins selected by LASSO-regularized logistic regression in each model. The colors of lines indicate overlaps between models. All regression models were adjusted for age, sex, BMI, center, and medication intake. BMI, body mass index; CV-AUC, cross-validated AUC; λ ratio (LR) (unit on y-axis): λ ratio; N, number of selected proteins.
Machine learning–based analysis of differences in protein expression between VTE phenotypes. This figure displays the number of proteins selected by LASSO-regularized logistic regression in each model. The colors of lines indicate overlaps between models. All regression models were adjusted for age, sex, BMI, center, and medication intake. BMI, body mass index; CV-AUC, cross-validated AUC; λ ratio (LR) (unit on y-axis): λ ratio; N, number of selected proteins.
Figure 3 shows model selection overlaps in greater detail. Figure 3A visualizes the predictive robustness, denoted by the λ ratio, for proteins selected in the models that compare the isolated PE phenotype with isolated DVT and DVT-associated PE, respectively. The 5 proteins (IFN-γ, glial cell-line derived neurotrophic factor [GDNF], GALNT3, peptidyl arginine deiminase-2 [PADI2], interleukin-15Rα [IL-15Rα]) had the same direction of expression in both models, providing strong evidence that these proteins had an expression pattern more specifically associated with the isolated PE phenotype. Figure 3B shows the proteins that were selected in both models comparing a PE phenotype (isolated PE, DVT-associated PE) with the isolated DVT phenotype, indicating shared expression patterns between PE phenotypes.

Differences and commonalities in proteomic signatures of isolated vs DVT-associated pulmonary embolism. This figure depicts proteins that were selected in multiple LASSO-regularized regression models, ordered by λ ratio in the leftmost model (isolated PE vs isolated DVT). (A) Protein expression patterns specific to isolated PE are shown, as are (B) patterns that were shared between the isolated PE and DVT-associated PE phenotypes. All regression models were adjusted for age, sex, body mass index, center, and medication intake.
Differences and commonalities in proteomic signatures of isolated vs DVT-associated pulmonary embolism. This figure depicts proteins that were selected in multiple LASSO-regularized regression models, ordered by λ ratio in the leftmost model (isolated PE vs isolated DVT). (A) Protein expression patterns specific to isolated PE are shown, as are (B) patterns that were shared between the isolated PE and DVT-associated PE phenotypes. All regression models were adjusted for age, sex, body mass index, center, and medication intake.
Orthogonal validation using cis pQTLs
Concentrations of all 5 isolated PE-specific proteins were related to their respective cis pQTL scores: IFN-γ (SD increase in protein level per SD increase in score [βpQTL] = 0.05; 95% confidence interval [CI], 0.02-0.08; P = .002), GDNF (βpQTL = 0.19; 95% CI, 0.15-0.22; P = 5.2 × 10⁻²⁷), GALNT3 (βpQTL = 0.23; 95% CI, 0.09-0.37; P = .0009), PADI2 (βpQTL = 0.15; 95% CI, −0.01 to 0.27; P = .07), and IL-15Rα (βpQTL = 0.33; 95% CI, 0.30-0.37; P = 1.7 × 10−87). Detailed results for all pQTLs are shown in supplemental Tables 9-13.
External validation in a population-based setting
The number of study participants of the population-based GHS matching the inclusion criteria for this analysis was 5778 (excluded 7386 without proteomics measurements, 1606 with baseline history of VTE, 236 with active cancer, and 4 with missing information regarding PE status). The mean age of these individuals was 55.7 ± 10.6 years, and 46.4% of them were women. A more comprehensive list of clinical characteristics at enrollment for these individuals is provided in supplemental Table 14. Of this group of study participants, 49 participants developed primary isolated PE over the course of the study, meaning that they had no baseline history of VTE and no incident DVT preceding the formation of the isolated PE event. The median follow-up time was 5 years; the median time to event for those individuals that developed primary isolated PE was 2.87 years (interquartile range: 1.60-4.16). Of all 69 proteins that were selected in relation to isolated PE vs other VTE phenotypes, 18 (IFN-γ, GDNF, IL-15Rα, and 15 others shown in Figure 4) were measured on the Inflammation panel, allowing external validation in the independent, population-based GHS cohort. Sixteen of these (all except CST5 and Flt3L) were nominally significantly related to the formation of a primary isolated PE at a 2-sided P value <.05. Using a Bonferroni-corrected significance threshold of 0.0028, 11 of these proteins were still significantly prognostic for the development of primary isolated PE in the fully adjusted Cox regression model, including the 3 inflammation-related proteins selected as most strongly associated with isolated PE in the GMP-VTE study: IFN-γ (hazard ratio [HR] per SD increase = 1.34; 95% CI, 1.23-1.45; P < .0001), GDNF (HR = 0.40; 95% CI, 0.29-0.55; P < .0001), and IL-15Rα (HR = 0.55; 95% CI, 0.43-0.71; P < .0001) (Figure 4).
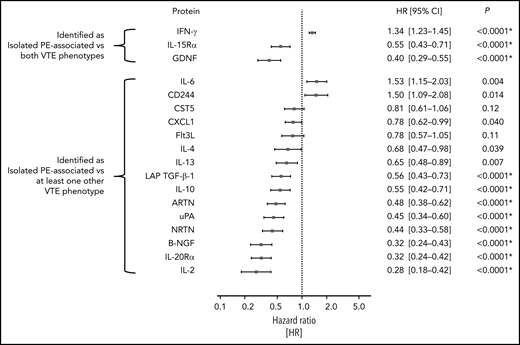
External validation of isolated PE-related proteins in a prognostic, population-based setting. This figure shows the hazard ratios and 95% CI per SD increase in protein concentration for all isolated PE-related proteins that could be externally validated (18/70), in the prospective, population-based cohort study the Gutenberg Health Study. Individual Cox proportional hazards regression models were used to identify the relationship between each protein and the formation of a first incident isolated PE in a population-representative sample free of history of VTE and active cancer, adjusted for age, sex, BMI, cardiovascular disease, COPD, cardiovascular risk factors and intake of antithrombotic medication, NSAIDs, corticosteroids, and oral contraceptives. P values with asterisks signify those that survived Bonferroni multiple testing correction (ie, those P values below a 2-sided significance threshold of 0.05/18 = 0.0028). NSAID, nonsteroidal anti-inflammatory drug.
External validation of isolated PE-related proteins in a prognostic, population-based setting. This figure shows the hazard ratios and 95% CI per SD increase in protein concentration for all isolated PE-related proteins that could be externally validated (18/70), in the prospective, population-based cohort study the Gutenberg Health Study. Individual Cox proportional hazards regression models were used to identify the relationship between each protein and the formation of a first incident isolated PE in a population-representative sample free of history of VTE and active cancer, adjusted for age, sex, BMI, cardiovascular disease, COPD, cardiovascular risk factors and intake of antithrombotic medication, NSAIDs, corticosteroids, and oral contraceptives. P values with asterisks signify those that survived Bonferroni multiple testing correction (ie, those P values below a 2-sided significance threshold of 0.05/18 = 0.0028). NSAID, nonsteroidal anti-inflammatory drug.
Network analysis
STRING analysis suggested a large degree of connectivity among isolated PE-related proteins, identifying 11 interconnected protein clusters (Figure 5). Supplemental Figure 1 shows whether these proteins were relatively over- or underexpressed in the isolated PE phenotype compared with the other VTE phenotypes. The 5 proteins that were most robustly selected as discriminating between isolated PE and both other VTE phenotypes in the regularized regression models are underscored with red.
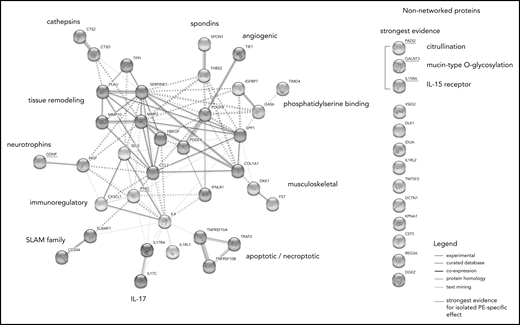
Network analysis of proteins associated with isolated PE. STRING network analysis incorporating proteins with 10% highest or lowest expression within the isolated PE phenotype relative to the global average, proteins identified as specific to the isolated PE phenotype in LASSO-regularized regression, and proteins highly correlated (Spearman’s ρ > 0.7) with these proteins in the sample. The non-networked proteins shown are sorted by strength of evidence, which is based on their consistency of selection across LASSO-regularized regression models: the strongest evidence for an association with isolated PE is provided by the proteins being selected in both the isolated PE vs isolated DVT as well as the isolated PE vs DVT-associated PE models. Node colors indicate cluster membership, as determined using the unsupervised Markov clustering algorithm. Dashed lines indicate inter-cluster edges, whereas solid lines represent intra-cluster connections. Protein–protein connections (ie, the edges of the graph) reflect experimentally established protein–protein interactions, coexpression patterns, protein homology, and putative connections based on text mining.
Network analysis of proteins associated with isolated PE. STRING network analysis incorporating proteins with 10% highest or lowest expression within the isolated PE phenotype relative to the global average, proteins identified as specific to the isolated PE phenotype in LASSO-regularized regression, and proteins highly correlated (Spearman’s ρ > 0.7) with these proteins in the sample. The non-networked proteins shown are sorted by strength of evidence, which is based on their consistency of selection across LASSO-regularized regression models: the strongest evidence for an association with isolated PE is provided by the proteins being selected in both the isolated PE vs isolated DVT as well as the isolated PE vs DVT-associated PE models. Node colors indicate cluster membership, as determined using the unsupervised Markov clustering algorithm. Dashed lines indicate inter-cluster edges, whereas solid lines represent intra-cluster connections. Protein–protein connections (ie, the edges of the graph) reflect experimentally established protein–protein interactions, coexpression patterns, protein homology, and putative connections based on text mining.
Text mining–based summary of relevant disease
Text mining analysis of the literature indicates that proteins with relative overexpression in the isolated PE phenotype (Figure 6A) have been predominantly investigated in the pulmonary disease context, with the largest degree of overrepresentation associated with bronchial asthma, pulmonary fibrosis, and pulmonary hypertension, followed by arterial cardiovascular disease. Conversely, proteins with relative underexpression in the isolated PE phenotype (Figure 6B) were most prominently studied in the context of thrombotic disease (eg, VTE, peripheral vascular disease).
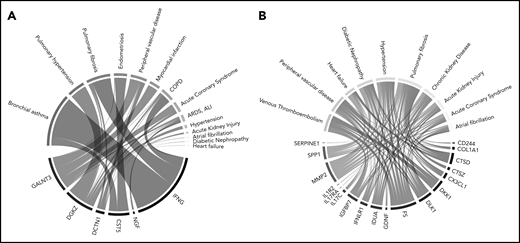
Diseases significantly related to (A) overexpressed and (B) underexpressed isolated PE-related proteins in literature. To generate these Chord diagrams, the same protein selection as was incorporated in the STRING network analysis was used. Connections with specific diseases were made by algorithmically searching PubMed for each protein, and testing which diseases were overrepresented among the search results, determined using a 1-sided Fisher’s exact test. The areas of the connections in these figures are proportional to the –log10-transformed P values derived from these tests. Cancer-related results were filtered because individuals with active cancer are excluded from this analysis.
Diseases significantly related to (A) overexpressed and (B) underexpressed isolated PE-related proteins in literature. To generate these Chord diagrams, the same protein selection as was incorporated in the STRING network analysis was used. Connections with specific diseases were made by algorithmically searching PubMed for each protein, and testing which diseases were overrepresented among the search results, determined using a 1-sided Fisher’s exact test. The areas of the connections in these figures are proportional to the –log10-transformed P values derived from these tests. Cancer-related results were filtered because individuals with active cancer are excluded from this analysis.
Discussion
In this analysis, machine learning techniques were applied to high-dimensional, targeted proteomics data to contrast acute isolated PE against other acute VTE phenotypes, resulting in novel insights into their molecular differences. Here, it was demonstrated that there are significant differences between the proteomic profiles of different manifestations of acute VTE. The specificity of the proteomic assays for their target antigens was orthogonally validated using cis pQTLs. These results support the hypothesis that these presentations of VTE constitute pathophysiologically distinct entities. Moreover, proteins identified in relation to isolated PE were validated in an independent, population-based cohort, where they were shown to be significantly prognostic for the development of an incident primary isolated PE in plasma collected a median of 2.9 years in advance of the event, further confirming their importance.
The distribution of clinical characteristics among phenotypes demonstrates consistency with previous findings from literature. In particular, the observations that individuals with isolated PE more often had events provoked by surgery,22 took oral contraceptives at higher rates,22 and that this group had a higher prevalence of chronic lung disease4,5 and atherosclerotic comorbidities12,13 align with the established evidence base on the phenotype. The relative absence of thrombophilia and low prevalence of personal VTE history are noteworthy and suggest that these thrombi are especially rarely based on an inherited prothrombotic state or the result of residual thrombosis. These results are consistent with the previously reported factor V Leiden paradox, which holds that the prevalence of the eponymous prothrombotic mutation is much lower in patients with isolated PE than in patients with DVT.23 Additionally, a similar finding was reported for the prothrombin G20210A mutation.24
By investigating the overlaps between regression models, it was shown that the isolated PE phenotype has diverging as well as shared molecular signatures with DVT-associated PE. Among the proteins that were identified as shared between PE phenotypes, there were immunoregulatory proteins (CD244, AZU1, SRC, SAA4, IL-4, IL-10), the antioxidant HO-1, the lung-specific surfactant protein SCGB3A2, and the extracellular matrix glycoprotein MEPE, which was very strongly correlated (Spearman’s ρ > 0.9) with brain natriuretic peptide in the study sample. These findings illustrate common mechanisms that are intuitively understood to be of greater relevance in the lungs than in the deep veins, and so it is unsurprising that they were significantly overexpressed in both PE phenotypes relative to the isolated DVT phenotype. In recognizing these overlaps, it should be considered that, even though the selection of proteins was shared, the degree of expression varied between the PE phenotypes.
The proteins that were most robustly associated with the isolated PE phenotype in this analysis (ie, proteins selected in both regularized regression models comparing the isolated PE phenotype against both other VTE phenotypes) are briefly discussed in the following section.
IFN-γ
Canonical functions of this highly pleiotropic cytokine include regulation of the innate and adaptive immune response in response to pathogens, apoptosis, and the activation of macrophages.25,26 In addition to its proinflammatory roles, IFN-γ signaling protects against inflammation-induced tissue destruction by inhibiting the expression of various tissue degrading factors, such as matrix metalloproteinases (MMPs), coagulation factors, complement components, and serine proteases.25,27
GDNF
Besides their canonical functions in regulating neuronal survival and differentiation,28 GDNF family neurotrophins and ligands modulate the bronchopulmonary vagal afferent nerves.29 Accumulating evidence suggests that airway hyperresponsiveness, mucus secretion, and dyspnea are at least partially related to neurotrophin-mediated abnormal activity of the vagal bronchopulmonary sensory nerves.30
GALNT3
GALNT3 inhibits nuclear factor κ-light-chain-enhancer of activated B cells (NF-κB) signaling by prohibiting phosphorylated P65 from nuclear transmigration.31 Inhibition of the NF-κB pathway effectively protects against nonsevere manifestations of both airway and interstitial pulmonary disease, and GALNT3-mediated inhibition of NF-κB signaling was shown to inhibit viral replication and mucin production in influenza A infection.32
PADI2
PADI2 is a Ca2+-dependent enzyme that catalyzes the citrullination of arginine residues of proteins. Known in particular for their ability to hypercitrullinate histones, PADIs in general have been the object of prolific recent study in the context of neutrophil extracellular traps.33 The PADI-dependent citrullination pathway has been shown to be relevant for a number of especially immune-related and chronic inflammatory conditions,34 such as rheumatoid arthritis-associated interstitial lung disease,35 idiopathic pulmonary fibrosis,34 and COPD.36
IL-15Rα
IL-15Rα is a subunit of a heterotrimeric receptor complex that specifically binds to IL-15 with high affinity, enabling effective IL-15 signaling.37 Among other effects, IL-15 upregulates the expression of both IFN-γ and IL-4, disproportionately in favor of the former, resulting in a T helper 1 (Th1)-dominant immune response.38
Of note, the 3 proteins of the 5 that were measured on the Inflammation panel of the proximity extension assays used for the relative quantification of proteins (ie, IFN-γ, GDNF, and IL-15Rα) were all significantly prognostic for development of a first incident isolated PE in an independent, population-based prospective cohort. This suggests that these proteins could be relevantly involved even very early on in the pathogenesis of isolated PE.
Network analysis
The protein–protein interaction network analysis provides further contextualization of the results, which allows speculation on their connection to the isolated PE phenotype. The analysis identified 11 highly interconnected clusters (Figure 4). Unsurprisingly, considering their pleiotropic effects, the mutually antagonistic “master cytokines” IFN-γ and IL-4 are centrally located in the network, with direct intercluster connections to proteins in the SLAM and IL-17 families, neurotrophins, and tissue remodeling-mediating proteins. Through these clusters, they are also indirectly connected to other clusters: spondins, angiogenic proteins, phosphatidylserine-binding proteins. and musculoskeletal proteins. Notably, nearly all proteins in these clusters were highly underexpressed in isolated PE compared with the other VTE phenotypes (supplemental Figure 1), potentially indicating downregulation.
The largest subcluster of proteins in this network analysis comprised proteins that mediate tissue-remodeling processes. The comparative underexpression of tissue destructive proteins, which include the MMPs and the fibrinolytic serine protease urokinase-type plasminogen activator, is consistent with a potential IFN-γ–mediated downregulation of such proteins.25 Conversely, positive regulators of tissue remodeling, like osteopontin, are induced by IFN-γ but inhibited by its antagonist IL-4.39 The underexpression of the closely connected musculoskeletal protein cluster (consisting of the Wnt inhibitor Dickkopf-1 and the activin inhibitor follistatin) could similarly reflect an inflammatory tissue damage-limiting mechanism.40,41
Host defense processes and local thrombosis
The proteomic signature associated with the isolated PE phenotype, together with the observed higher prevalence of inflammatory airway disease in this subgroup, suggests a relevant role of host defense processes in the pathophysiology of isolated PE. The interface between immunity and hemostasis in general is increasingly recognized.42-44 The potential tissue-specific aspects of this connection have not been explored in as much detail. In mice, resident lung monocytes and monocyte-derived cells preferentially reside in the alveolar compartment, from where these cells actively migrate into and patrol both the airways and the pulmonary vasculature.45 In addition, considerable literature describes leukocyte sequestration in pulmonary capillaries under conditions of pulmonary inflammation.46 It is conceivable that immune cells contribute locally to thrombus formation via these mechanisms. Our previous finding that isolated PE is preferentially localized in the peripheral pulmonary arteries14 can be interpreted as consistent with this hypothesis.
Relation to atherosclerotic disease
Because atherosclerotic disease is overrepresented in patients with the isolated PE phenotype, and because such patients appear to have a persistently elevated risk of arterial thrombotic events relative to other VTE patients,14 exploring this relationship in more detail is warranted. As discussed previously, the isolated PE-specific molecular signature differentiates itself by a relatively strong Th1 response, and there is evidence for the involvement of PADI-driven protein hypercitrullination. Th1 cytokines are implicated in various complex, site-specific, predominantly proatherogenic processes, including the modulation of endothelial barrier permeability, the recruitment of monocytes and T cells to vulnerable sites, and plaque destabilization.47 Atherosclerotic plaques harbor large numbers of Th1 cells, which secrete proatherogenic cytokines, including IFN-γ.47 PADI-mediated hypercitrullination was shown to promote atherosclerosis via its contribution to neutrophil extracellular trap formation.48
In addition to the Th1 cells, the activated form of NF-κB is also present in atherosclerotic plaques, and its pleiotropic proatherogenic and prothrombotic effects are increasingly recognized.49 The high expression of GALNT3 within the acute isolated PE phenotype is likely responsive to an upregulation in NF-κB signaling, constituting another plausible mechanism through which the increased prevalence of atherothrombotic disease in this patient group may be explained.
Finally, from network analysis, there are indications that profibrotic processes may also feature in the pathophysiology of isolated PE. MMPs can promote vascular smooth muscle growth and stabilize plaques on the one hand, whereas their tissue-destructive properties, when combined with the accumulation of monocytes and macrophages, can also induce plaque rupture.50
Limitations
This study has a number of limitations that deserve consideration. Although whole-leg ultrasound was used to exclude DVT in the patients classified as having isolated PE, it is possible that small thrombi were missed during this part of the diagnostic workup or that isolated pulmonary thrombi represented complete dislodgments of very small DVT. This possibility was minimized by having board-certified, experienced angiologists adjudicate all diagnoses.
Second, because of the systemic nature of the blood measurements, cellular origin and tissue-specific expression of the detected proteins could not be determined. Given the practical and ethical constraints surrounding local measurements and the lack of indication for autopsy following PE-related death, we believe that the proteomics approach chosen for this investigation constitutes the best possible approach of gaining insights relating to this question within the human context.
Third, it should be assumed that the time from event onset to clinical presentation differed between patients. Thus, the blood plasma profiles of the included patients may reflect different stages of the acute disease. This may have obscured some of the relevant etiopathological mechanisms in this analysis. Nevertheless, the external validation in an independent, population-based setting confirmed that the proteins identified as associated with isolated PE in the GMP-VTE study were in fact prognostic of the formation of a primary isolated PE, providing additional evidence in favor of the involvement of these proteins in the early pathogenesis of the isolated PE phenotype.
The final limitation is that only those proteins measured using the Inflammation panel of the proximity extension assay used in this investigation could be replicated in an external cohort because of unavailability of the other panels. However, of the 18 candidate proteins that could be validated in the external cohort, 16 were nominally significantly related to the formation of a first isolated PE, and 11 of these survived Bonferroni correction for multiple testing. This finding is all the more noteworthy considering the differences in setting (acute-phase hospital setting vs population-based setting years in advance of the event) between the derivation and validation cohorts. Finally, orthogonal validation of the main proteomic findings via cis pQTLs provided further evidence for the validity of the results.
Conclusions
This systems-oriented analysis has demonstrated that acute isolated PE is differentiable from other acute VTE phenotypes based on its molecular signatures, suggesting a distinct pathophysiology. In particular, the findings of this analysis suggest the relevant involvement of noncanonical pathways that have more established roles in respiratory and chronic inflammatory disease than in VTE, especially a particularly strong Th1 immune response, PADI-mediated hypercitrullination, neurotrophin involvement, and GALNT3-mediated inhibition of NF-κB signaling. The results were orthogonally validated using cis pQTLs, and externally validated in an independent population-based setting by analyzing plasma collected years before the formation of the first isolated PE event. Taken together, these findings support the hypothesis that a proportion of isolated PE may be local in origin. Moreover, they provide putative mechanisms to account for the observed higher prevalence of atherosclerotic disease in patients with isolated PE. Future work should seek to further elucidate the mechanisms underlying the observed findings.
The publication costs of this article were defrayed in part by page charge payment. Therefore, and solely to indicate this fact, this article is hereby marked “advertisement” in accordance with 18 USC section 1734.
For original data and code, please e-mail the corresponding author.
The online version of this article contains a data supplement.
Acknowledgments
The authors are indebted to all study participants, without whom this study would not have been possible. The authors extend their thanks to all members of the study teams involved and are grateful to Heidrun Lamparter, Bianca Zäpf, Jacqueline Kandsberger, and Heidrun Dorsch for the project management of this study. Collaborators include R. Ewert (Greifswald), M. Halank (Dresden), M. Held (Würzburg), C. Opitz (Berlin), H.-J. Seyfarth (Leipzig), and G. Weißer (Mainz).
The GMP-VTE project was funded by the German Federal Ministry of Education and Research (BMBF 01EO1003 and 01EO1503), internal funds of Clinical Epidemiology and Systems Medicine (Center for Thrombosis and Hemostasis, Mainz, Germany), and a grant from Bayer AG. A.P.R. received funding from the European Union’s Horizon 2020 research and innovation program under the Marie Skłodowska-Curie grant agreement No. 813409.
Authorship
Contribution: P.S.W., K.L., A.S., T.K., M.L., H.A.G., F.J.M., C.E.-K., K.J.L., T.M., and S.V.K. designed the study; V.T.C., A.S., J.H.P., S.R., T.K., A.M.Z., S.H., M.A.A.-N., M.P.-N., L.E., V.L., A.P.R., M.M., A.K.S., K.S., K.L., and P.S.W. designed the analysis plan; A.S. performed the statistical analysis; V.T.C., J.H.P., and P.S.W. drafted the manuscript; A.P.R. designed the visual summary of the results; and all authors contributed to the interpretation of results and the composition of the final manuscript.
Conflict-of-interest disclosure: A.Z., V.L., S.H., and K.L. are employees of Bayer AG. The remaining authors declare no competing financial interests.
Correspondence: Philipp S. Wild, University Medical Centre Mainz of the Johannes Gutenberg University Mainz, Langenbeckstrasse 1, 55131 Mainz, Germany; e-mail: philipp.wild@unimedizin-mainz.de.

This feature is available to Subscribers Only
Sign In or Create an Account Close Modal