

Key Points
Functionally distinct stem-like and mature immunomodulatory states coexist in ETP-ALL.
Immunomodulation of CD8+ T-cell dysfunction is mediated by Galectin-9 expression on ETP-ALL cells.

Abstract
Lineage plasticity and stemness have been invoked as causes of therapy resistance in cancer, because these flexible states allow cancer cells to dedifferentiate and alter their dependencies. We investigated such resistance mechanisms in relapsed/refractory early T-cell progenitor acute lymphoblastic leukemia (ETP-ALL) carrying activating NOTCH1 mutations via full-length single-cell RNA sequencing (scRNA-seq) of malignant and microenvironmental cells. We identified 2 highly distinct stem-like states that critically differed with regard to cell cycle and oncogenic signaling. Fast-cycling stem-like leukemia cells demonstrated Notch activation and were effectively eliminated in patients by Notch inhibition, whereas slow-cycling stem-like cells were Notch independent and rather relied on PI3K signaling, likely explaining the poor efficacy of Notch inhibition in this disease. Remarkably, we found that both stem-like states could differentiate into a more mature leukemia state with prominent immunomodulatory functions, including high expression of the LGALS9 checkpoint molecule. These cells promoted an immunosuppressive leukemia ecosystem with clonal accumulation of dysfunctional CD8+ T cells that expressed HAVCR2, the cognate receptor for LGALS9. Our study identified complex interactions between signaling programs, cellular plasticity, and immune programs that characterize ETP-ALL, illustrating the multidimensionality of tumor heterogeneity. In this scenario, combination therapies targeting diverse oncogenic states and the immune ecosystem seem most promising to successfully eliminate tumor cells that escape treatment through coexisting transcriptional programs.
Introduction
T-cell acute lymphoblastic leukemia (T-ALL) is an aggressive malignancy mainly affecting children and young adults. Although overall outcomes are good, conventional therapy fails in roughly 20% of patients, and most of these patients die as a result of relapsed/refractory disease. Various cytogenetic and molecular abnormalities that disrupt normal thymocyte development can lead to T-ALL, and a majority of cases can be subclassified based on arrest at different thymocyte maturation stages.1 For example, early T-cell precursor ALL (ETP-ALL) shows unique genetic and transcriptional signatures suggesting a close relationship with myeloid precursors and myeloid malignancies.2-4 However, it is unclear if these signatures coexist within individual ETP-ALL cells or if they reflect discrete, heterogeneous cell states within the leukemia cell population. Here, we determined the heterogeneity of relapsed/refractory ETP-ALL carrying activating NOTCH1 mutations at single-cell resolution using full-length single-cell RNA sequencing (scRNA-seq) before and after targeted therapy with Notch inhibitor. We identified a heterogeneous composition of malignant cell populations with a deranged developmental hierarchy marked by the presence of 2 distinct stemness programs and ineffectual commitment to either lymphoid or myeloid lineage. The 2 stem-like states differed with regard to their cell-cycle states, transcriptional circuits, and PI3K signaling pathway activation, which occurred in the absence of mutations involving genes encoding components of the pathway. These 2 states converged onto a third, more mature cell state. Posttreatment cells had low Notch and high PI3K activity and likely accounted for the generally poor clinical response of T-ALL to Notch inhibition. A broader analysis of cellular interactions in the leukemia ecosystem revealed that leukemic ETP blasts expressed the checkpoint ligand LGALS9 and were associated with dysfunctional CD8+ T cells that expressed HAVCR2, the LGALS9 receptor, in the leukemia microenvironment. Targeting LGALS9 may revert T-cell exhaustion in these patients and provide a novel therapeutic approach to overcome T-ALL heterogeneity and lineage plasticity. Together, these findings provide a framework for rationally designed combination treatments in incurable hematopoietic malignancies.
Materials and methods
Primary samples
Banked blood or bone marrow samples from patients with relapsed/refractory ETP-ALL, all with activating NOTCH1 mutations (Table 1), who had signed consent for tissue banking (Dana-Farber Cancer Institute 01-206) and enrolled in a phase 1 clinical trial (registered at www.clinicaltrials.gov as #NCT01363817) with the γ-secretase inhibitor (GSI) BMS-906024, a Notch inhibitor, were used in this study.
Clinical information and tumor characteristics (immunophenotype, cytogenetics, and targeted DNA sequencing results) of relapsed/refractory ETP-ALL patients
| Patient | Sex | Age, y | Clinical targeted sequencing results | Cytogenetics | Immunophenotype | Source | Days posttreatment | Response to BMS-906024 |
|---|---|---|---|---|---|---|---|---|
| P1 | F | 44 | ETV6 NM_001987 c.1105C>T p.R369W (AF 42.1%) ETV6 NM_001987 c.1106G>A p.R369Q (AF 44.9%) NOTCH1 NM_017617 c.7171C>T p.Q2391* (AF 51.2%) RUNX1 NM_001754 c.750_750insGG p.R251fs* (AF 29.4%) TP53 NM_000546 c.1119delA p.K374fs* (AF 55%) WT1 NM_024426 c.1109_1100-5GTCGCACATCCTGC ATCGGAC p.R367_370DVRRsplice (AF 39.1%) | 46,XX,inv(3)(p2?5q2?5),add(4)(q21),-6,add(19)(q13.1),+21,+der(?)t(6;?)(p21;?),+mar [cp17]//46,XY[3] | CD45 (dim), CD34, CD56, CD7, CD5 (subset), CD33, CD117 (subset), CD15 (subset) | Blood | 0 | Persistent disease after cycle 1 |
| P2 | M | 53 | CSF3R NM_000760, c.1853C>T, pT618I (AF 46.2%) DNMT3A NM_022552, c.1204C>T, p.Q402* (AF 99.3%) NOTCH1 NM_017617, c4775T>G, p.F1592C (AF 64.9%) PTPN11 NM_002834, c.854T>C, p.F285S (AF 40%) | 46, XY, karyotype with del(7p13) | CD45 (dim), CD34, CD3 (cytoplamic), CD5, CD7, CD33, and TdT (dim) | Blood | 0 | Complete response after 1 cycle (4 wk), reported in CSHML 2015 |
| P3 | M | 18 | GATA3 NM_001002295 c.830G>A p.R277Q (AF 46.2%) IL7R NM_002185 c.722T>A p.I241N (AF 50.2%) JAK1 NM_002227 c.2108C>A p.S703I (AF 68.8%) NOTCH1 NM_017617 c.4793C>G p.R1598P (AF 50%) NOTCH1 NM_017617 c.7399_7399insATGGAGAAATCC p.S2467fs* (AF 50%) | 46,XY,add(1)(q42)[13]/46,XY[7] | CD45 (dim), CD38, CD2, CD3 (cytoplasmic), CD7, CD13 | Blood | 0, 3, 10 | Initial drop, then rising blast count after 1-2 wk and persistent disease |
| P4 | F | 27 | NOTCH1 NM_017617 c.4721T>C p.L1574P (AF 47.8%) | 45,X,-X,del(1)(p13p22),add(5)(p15),del(5)(q22q31),der(6)del(6)(p11p21)del(6)(q13q21),add(9)(p13),-11,del(11)(q23),del(12)(p13),del(13)(q12q22),+der(?)t(?;1)(?;q21)[cp15]/47,idem,+X,del(6)(q13q22),−add(9),add(14)(p11.2),−17,+21,+22,del(22)(q13)[3]//46,XY[2].ish add(5)(MLL+),?add(9)(MLL+), 14q11(TRA/D+),add(14)(TRA/D+)[5/5] | CD45 (dim), CD34, TDT, CD7, CD33, CD117, CD3 (cytoplasmic) | Blood | 0, 1 | Persistent disease after cycle 1 |
| P5 | M | 39 | DNMT3A NM_175629 c.1987T>C p.S663P (AF 6.2%) JAK1 NM_002227 c.2171G>A p.R724H (AF 44.7%) JAK3 NM_000215 c.2872G>A p.E958K (AF 35.9%) NOTCH1 NM_017617 c.4778T>C p.L1593P (AF 75%) | 46,XY,del(12)(p11.2)[9]/46,XY[cp11] | CD45 (dim), HLA-DR (variable), CD117 (dim), CD56, CD5, CD7, CD3 (cytoplasmic) | Bone marrow (d 0)/blood (d 8, 15) | 0, 8, 15 | Persistent disease after cycle 1 |
AF, allele frequency.
PDX models
Generation and characterization of ETP-ALL and T-ALL patient-derived xenograft (PDX) models have been described.5-7 T-ALL PDX models were kindly provided by D. Weinstock. Clinical and molecular characteristics of these models are listed in Table 2.
Clinical information and tumor characteristics (immunophenotype, cytogenetics, and targeted DNA sequencing results) of ETP-ALL and T-ALL PDX models
| PDX name | WHO classification | Treatment phase at time of sample | Age, y | Sex | Patient tumor mutations | Patient tumor karyotype | PDX immunophenotype | PDX molecular details | PDX NOTCH1 mutations | Mouse strain |
|---|---|---|---|---|---|---|---|---|---|---|
| TALL-06078-150 | T-ALL | Relapse | 0.87 | F | CDKN2A homozygous deletion (?) | TCR gamma homozygous deletion | NA | NA | ARID1B missense NM_017519 c.2791G>A p.A931T in 50.4% of 260 reads | MLL3 missense NM_170606 c.2959T>C p.Y987H in 26.3% of 604 reads | MLL3 missense NM_170606 c.2963G>T p.C988F in 13.5% of 600 reads | MLL3 missense NM_170606 c.943G>A p.G315S in 11.0% of 872 reads | None detected | NSG |
| TALL-x-12 | T-ALL | Unknown | 12.61 | M | NA | 47XY,+8,add(9)(p13) | CD45+, CD2+, CD34−, CD33−, CD19− | NOTCH1 missense NM_017617 c.4721T>C p.L1574P in 99.0% of 101 reads | NOTCH1 p.L1574P | NSG |
| TALL-DFAT-28537 | T-ALL | Diagnosis | 25 | M | FBXW7 NM_033632 c.1394G>A p.R465H - in 35.4% of 311 reads | FBXW7 NM_033632 c.1514G>A p.R505H - in 5.7% of 316 reads | NOTCH1 NM_017617 c.4775T>C p.F1592S - in 36.8% of 57 reads | NA | CD45+, CD2+, CD34−, CD33−, CD19− | NA | NOTCH1 p.F1592S | NSG |
| TALL-x-15 | T-ALL | Relapse | 2.87 | M | CDKN2A homozygous deletion | TCR gamma homozygous deletion | NA | NA | MYCN missense NM_005378 c.131C>T p.P44L in 55.2% of 270 reads | TP53 missense NM_001126112 c.503A>C p.H168P in 48.9% of 325 reads | MLL3 missense NM_170606 c.2963G>T p.C988F in 37.0% of 492 reads | MLL3 missense NM_170606 c.2959T>C p.Y987H in 23.6% of 512 reads | MLL3 missense NM_170606 c.1042G>A p.D348N in 14.7% of 504 reads | None detected | NSG |
| TALL-x-9 | T-ALL | Diagnosis | 6.05 | F | CDKN2A homozygous deletion | PTEN heterozygous deletion | TCR gamma ABD heterozygous deletion | 46XX,−7,−14. +2 mar | CD45+, CD2 (dim), CD34−, CD33−, CD19− | NOTCH1 missense NM_017617 c.4793G>C p.R1598P in 45.9% of 146 reads | NOTCH1 p.R1598P | NSG |
| ETP-1-IKN | ETP-ALL | Diagnosis | 8 | M | CTCF SV, DNM2 K557_K558 . K, JAK3 M511I, WT1 R370fs | NA | CD1a−, cCD3+, CD5 dim, CD7+ | NA | NOTCH1 p.F1693S | NSG |
| ETP-12 | ETP-ALL | Diagnosis | 16 | M | EZH2 S651L, RUNX1 T148fs, NOTCH1 S2492*, IKZF1 SV, PHF6 N147fs, SUZ12 C350R, WT1 C350R L564_S568, SH2B3 SV | NA | CD1a−, cCD3+, CD5+, CD7+ | NA | NOTCH1 p.S2492* | NSG |
| ETP-13 | ETP-ALL | Diagnosis | 3 | M | EED S259F | NA | CD1a−, cCD3+, CD5+, CD7+ | NA | NOTCH1 p.G1433R | NSG |
| ETP-14 | ETP-ALL | Diagnosis | 14 | M | GATA3 N286T and S271_W275fs, JAK1 S703I, PTEN SV, RB1 SV CDKN2A/B SV | NA | CD1a−, cCD3+, CD5 dim, CD7+ | NA | Not detected | NSG |
| PATRAP (ETP-27) | ETP-ALL | Diagnosis | 7 | F | NA | NA | CD1a−, cCD3+, CD5 dim, CD7+ | NA | Not detected | NSG |
| ETP-5-XNE | ETP-ALL | Diagnosis | 15 | M | PTPN11 A72V | NA | CD1a−, cCD3+, CD5 dim, CD7+ | NA | Not detected | NSG |
| ETP-8-KMG | ETP-ALL | Diagnosis | 19 | F | ECT2L E12_splice and W440G, GATA3 A310_A314 . A, R276Q, JAK1 E1012 > EK, SH2B3 V65A, I257T | NA | CD1a−, cCD3+, CD5 dim, CD7+ | NA | NOTCH1 p.V1578E | NSG |
NA, not available.
Tumor cell lines
DND-41, KOPT-K1, HPB-ALL, Loucy, MOLT-4, NALM-6, SEM, KG-1, Jurkat, and HL-60 were obtained from the American Type Culture Collection or German Collection of Microorganisms and Cell Cultures.
T-cell activation and functional assays
T cells were activated and expanded with Dynabeads Human T-activator CD3/CD28 (ThermoFisher Scientific) in X-VIVO 15 (Lonza), 5% human AB serum, and 50 U/mL of interleukin-2 (Miltenyi Biotech). For T-cell exhaustion experiments, activated CD8+ T cells were cultured in DND-41–conditioned media, with and without anti-human Galectin-9 at 10 μg/mL (ThermoFisher Scientific) or recombinant Galectin-9 at 2.5 μg/mL (R&D Systems) for 72 hours. Additional details are included in the supplemental Data (available on the Blood Web site).
IHC staining for LGALS9 and HAVCR2
All immunohistochemistry (IHC) staining was performed on the Leica Bond automated staining platform. After citrate buffer antigen retrieval, anti-HAVCR2 (Cell Signaling Technology) was applied at a 1:100 dilution, and anti-LGALS9 (BioLegend) was applied at a 1:50 dilution. Staining was developed with the Leica Biosystems Refine Detection Kit.
Quantitative real-time PCR
RNA was isolated using the RNeasy Mini Kit (Qiagen) and reverse transcribed with SuperScript III Reverse Transcriptase (ThermoFisher Scientific), and gene expression was quantified by real-time polymerase chain reaction (PCR) using Power SYBR Green PCR Master Mix (Via7 instrument; Applied Biosystems; primer sequences listed in supplemental Table 1). Error bars represent ± 1 standard deviation of 3 technical replicates.
Single-cell RNA-seq library preparation
Full-length single-cell RNA-seq libraries were prepared using the SMART-seq2 protocol.8 Complementary DNA was fragmented using Nextera XT (Illumina) and amplified with indexed Nextera PCR primers. Products were quantified using the Bioanalyzer High Sensitivity DNA Kit. Pooled libraries were sequenced on a NextSeq 500 (Illumina) with an average sequencing depth of 0.5 million to 1 million reads per cell.
Computational and statistical analyses
Processing and quality filtering of single-cell RNA-seq (scRNA-seq) data were carried out using trimmomatic,9 STAR,10 HTSeq,11 and RSEM.12 Clustering of single-cell profiles and marker gene analyses were performed using PAGODA2,13 monocole2,14 SEURAT,15 and RNA velocity.16 Single-nucleotide variant (SNV) and copy-number analyses were performed with mutect2,17 InferCNV,18,19 and CONICS.20 We compared single-cell profiles with cell types from ImmGen21 and BLUEPRINT22 using a log-likelihood model. Transcriptional regulon and signaling pathway activities were analyzed with SCENIC23 and PROGENy.24
Targeted sequencing and mutation calling
PCR amplicons of AKT1, AKT2, NOTCH1, PIK3CA, PIK3CB, PIK3CD, PIK3R1, PIKR3, PIKR6, and PTEN were sequenced to an average sequencing depth of 568 857× (primer sequences are listed in supplemental Table 1). Mutations were called and annotated using Mutect217 and Oncotator25 and manually confirmed in IGV.
Results
Refractory ETP-ALL cells express transcription factors associated with normal lymphoid and hematopoietic progenitors
To define ETP-ALL heterogeneity at the single-cell level, we performed full-length transcriptome analysis of 5077 malignant and normal immune cells (T cells, B cells, and monocytes) from bone marrow or blood from 4 normal donors and 5 patients with relapsed/refractory ETP-ALL, all with NOTCH1 gain-of-function mutations, who were treated with the GSI BMS-906024 in a phase 1 clinical trial. Pre- and posttreatment samples of patients who had provided consent for tissue banking were processed for this study. Patient information and tumor characteristics are summarized in Table 1. Serial samples were available from 3 of these 5 patients (Table 1). Four of the 5 patients had refractory disease; 1 patient showed a complete response.26 We enriched for leukemia cells by sorting on CD45low-expressing blasts (Table 1) and also collected CD3+ T cells, CD19+ B cells, and CD14+ monocytes by sorting (Figure 1A). After several scRNA-seq quality control filtering steps (data supplement; supplemental Figure 1), we performed PAGODA2 clustering and t-distributed stochastic neighbor embedding (t-SNE) visualization,13 which revealed 13 distinct cell clusters (Figure 1B-C). Five clusters (clusters 1, 7, 8, 10, and 11) were common to different patients and healthy donors, whereas most of the remaining clusters were specific to individual patients and showed high intrapatient correlation (Figure 1A,C,D). Comparisons of these single-cell profiles with 2 independent expression data sets of immune cell populations (BLUEPRINT22 and ImmGen21 ) showed that clusters 1, 7, 8, 10, and 11 represented CD4+ T cells, CD8+ T cells, natural killer cells, B cells, and myeloid cells, respectively (supplemental Figure 2). This classification was also confirmed by differential expression of well-established lineage markers (Figure 1E). Cell-cycle differences comprise another possible driver of cluster formation in single-cell data.27 We did not observe cell cycle–driven effects in a majority of the clusters (supplemental Figure 3; supplemental Table 2), with the notable exception of cluster 9, which consisted of high-cycling cells and was composed of leukemia cells from all 5 patients. Differential expression analyses to identify genes specifically expressed in cluster 9 in comparison with the patient-specific malignant clusters illustrated the predominance of cell-cycle genes (supplemental Tables 3-7).
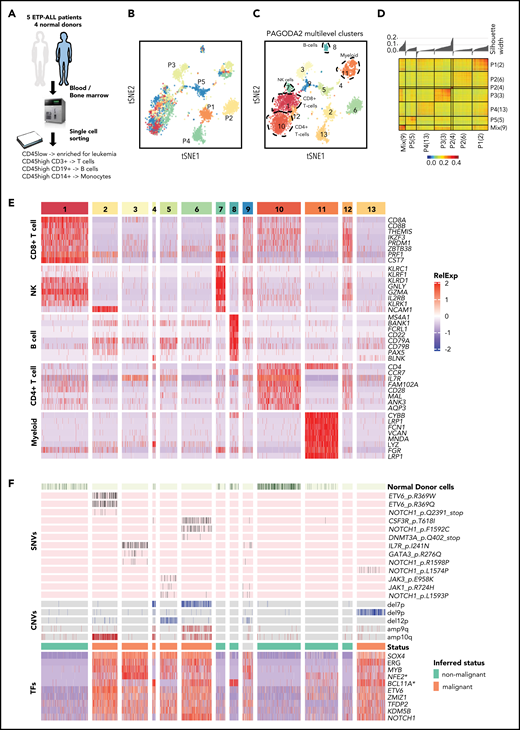
ETP-ALL cells have distinct transcriptional profile. (A) Schematic depicting the cohort, sample collection, processing and sorting of cells for single-cell transcriptional profiling using SMART-seq2 protocol. (B) t-SNE of the processed single-cell RNA-seq gene expression data reveals distinct patient-specific clusters along with heterogeneous clusters. (C) Clusters were further analyzed using PAGODA2 to identify the cell type of individual cells. (D) Correlation distance matrix (1-Pearson correlation coefficient) derived from normalized gene expression values of individual malignant cells. The silhouette plot on top of the matrix depicts the uniqueness of each of the patient-specific malignant clusters. (E) Marker gene analyses identify heterogeneous clusters as CD4+ T cells, CD8+ T cells, natural killer (NK) cells, B cells, and myeloid cells. Expression of the top marker genes for each of the clusters containing normal cells is depicted as heatmap. (F) Cells from normal donors are highlighted in the heatmap (top) and fall into normal cell clusters. Malignant clusters identified by calling of those pathogenic variants (SNVs and CNVs) in single cells that were identified in individual patients by clinical targeted sequencing (middle; Table 1). Expression of transcription factors (TFs) distinguishing malignant cells from nonmalignant cells sequenced in this study (as inferred from random forest model). *NFE2 was ranked lower when only untreated leukemic cells were used to build the model, whereas *BCL11A was ranked higher.
ETP-ALL cells have distinct transcriptional profile. (A) Schematic depicting the cohort, sample collection, processing and sorting of cells for single-cell transcriptional profiling using SMART-seq2 protocol. (B) t-SNE of the processed single-cell RNA-seq gene expression data reveals distinct patient-specific clusters along with heterogeneous clusters. (C) Clusters were further analyzed using PAGODA2 to identify the cell type of individual cells. (D) Correlation distance matrix (1-Pearson correlation coefficient) derived from normalized gene expression values of individual malignant cells. The silhouette plot on top of the matrix depicts the uniqueness of each of the patient-specific malignant clusters. (E) Marker gene analyses identify heterogeneous clusters as CD4+ T cells, CD8+ T cells, natural killer (NK) cells, B cells, and myeloid cells. Expression of the top marker genes for each of the clusters containing normal cells is depicted as heatmap. (F) Cells from normal donors are highlighted in the heatmap (top) and fall into normal cell clusters. Malignant clusters identified by calling of those pathogenic variants (SNVs and CNVs) in single cells that were identified in individual patients by clinical targeted sequencing (middle; Table 1). Expression of transcription factors (TFs) distinguishing malignant cells from nonmalignant cells sequenced in this study (as inferred from random forest model). *NFE2 was ranked lower when only untreated leukemic cells were used to build the model, whereas *BCL11A was ranked higher.
Because clusters 2, 3, 4, 5, 6, and 13 were specific to patients and not seen in healthy donors (Figure 1B-C), we hypothesized these to be malignant cells, because patient-specific clustering of malignant cells is typical of single-cell analyses, probably because of the presence of genetic/epigenetic alterations that are specific to individual tumors.19 We employed complementary approaches to definitively distinguish malignant and nonmalignant immune cells (T cells, B cells, and monocytes) in our data set (Figure 1F). First, we used mutect217 to detect tumor-specific pathogenic SNVs that were known to be present based on targeted DNA sequencing of bulk tumor cells as part of routine clinical workup and also inferred copy-number variants (CNVs) from all single cells using CONICS.20 SNVs and CNVs agreed well with clinical sequencing results and were only detected in the presumed malignant cell clusters (Figures 1F; supplemental Figures 4 and 5; supplemental Tables 8 and 9; Table 1), with the caveat that SNVs with allele frequencies of <40% and SNVs in genes that were expressed at low levels were not detected, likely because of dropout events.28,29 Next, we examined the presumed malignant clusters for expression of key transcription factors with known roles in T-ALL.30,31 Immature T-ALLs commonly exhibit deregulation of LMO2/LYL1, which was expressed in all of the presumed malignant clusters (supplemental Figure 6). We also compared our scRNA-seq profiles with a cohort of 216 T-ALLs from the National Cancer Institute TARGET study.3 This revealed that the malignant clusters most closely resembled the ETP subset with deregulated LMO2/LYL1 (supplemental Figure 7). Lastly, we employed a random forest model to rank transcriptional regulators that differentiated malignant and nonmalignant clusters (Figure 1F; supplemental Figure 8). This identified several transcription factors with known function in T-ALL (ie, NOTCH1, MYB, ERG, ETV6, and ZMIZ32-39 ) as well as several master regulators of other hematopoietic lineages (TFDP2 and erythroid lineage40 ) or malignancies (KDM5B, dysregulated in acute myeloid leukemia [AML] and B-ALL41 ). SOX4 expression was the strongest predictor of malignant cells; it is aberrantly expressed in myeloid leukemias and has been implicated in B-ALL but not T-ALL pathogenesis.42
To differentiate whether these transcription factors were specific to T-ALL or also present in normal thymic precursors, we evaluated their expression in bulk RNA-seq profiles of normal human precursor cells from BLUEPRINT.2 Most of these transcription factors are highly expressed in hematopoietic progenitor populations and early thymocytes (supplemental Figure 9). The 2 notable exceptions are ZMIZ1 and KDM5B, which are only expressed at low levels in normal progenitors, suggesting they may have particular relevance for T-ALL. Indeed, all transcription factors identified were found to have high expression in T-ALL cell lines profiled by CCLE43 (supplemental Figure 10). Specifically, SOX4, MYB, TFDP7, and NOTCH1 showed the highest expression in T-ALL cell lines when compared with other cancer cell lines profiled in CCLE. We also assessed expression of these transcription factors in a T-ALL cohort from the TARGET study that included 216 patients.3 All of the transcription factors identified by the random forest model were strongly expressed in all T-ALL subtypes, including ZMIZ1 and KDM5B (supplemental Figure 11). Therefore, in addition to known transcriptional regulators in T-ALL and thymic progenitors, there was expression of transcriptional regulators of other hematopoietic lineages in all 5 leukemias, consistent with lineage infidelity.
ETP-ALL exhibits deranged developmental hierarchy with ineffectual lineage commitment and coexisting stem-like states
To further explore lineage infidelity within single cells, we looked for expression of hematopoietic stem cell (HSC), multipotent progenitor (MPP), common myeloid progenitor (CMP), granulocyte-monocyte progenitor (GMP), and common lymphoid progenitor (CLP) early lineage commitment signatures, as defined by BLUEPRINT,22 as well as thymic precursor signatures (ETP, DN1, DN2, DN3, DN4, and DP), as defined by ImmGen.21 Most leukemic cells showed high expression of DN1 signatures, consistent with their clinical annotation as ETP-ALL (Figure 2A). Interestingly, expression of both more mature thymocyte signatures (DN2, DN3, DN4, and DP) and more immature hematopoietic precursor signatures (HSC, MPP, GMP, CMP, and CLP) was quite heterogeneous and promiscuous across single leukemic cells, with some leukemic cells simultaneously expressing strong HSC and the most differentiated DP thymocyte signatures (Figures 2A; supplemental Figure 12A). Importantly, normal hematopoietic and thymic precursors did not show lineage infidelity, and neither HSC nor CMP signatures were observed in normal thymic populations (supplemental Figure 12A-B). Thus, ETP-ALL cells coexpressed multiple developmental signatures in a majority of single cells, with only a small fraction of cells demonstrating the complete absence of CLP or HSC signatures.
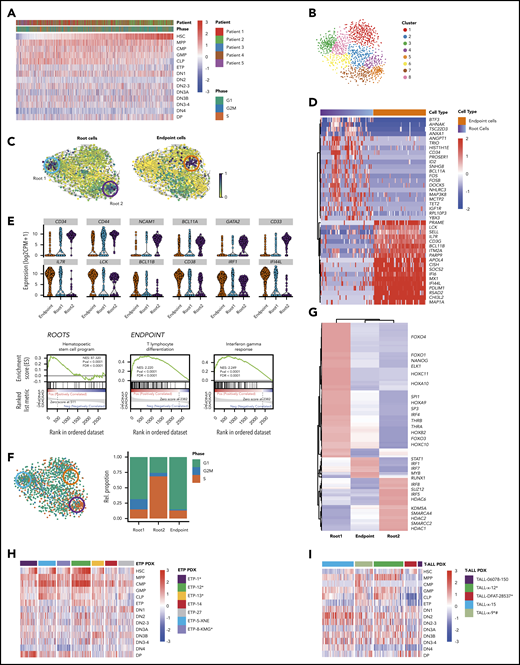
Functional heterogeneity in ETP-ALL reveals deranged developmental hierarchy with coexisting stem-like states and ineffectual lineage commitment. (A) Heatmap demonstrates expression of HSC, MPP, CMP, GMP, CLP, ETP, DN1, DN2, DN2-3, DN3A, DN3B, DN3-4, DN4, and DP signatures as defined by xcell23 in individual leukemic cells. (B) t-SNE plot of all malignant cells using genes involved in HSC, CLP, and CMP progenitor programs. Clusters are derived using the Louvain algorithm. (C) RNA velocities projected on the t-SNE plot containing leukemic cells with root and endpoint cells highlighted (circles). (D) Heatmap depicting the expression of marker genes in the identified root and endpoint cells. (E) Violin plots depicting expression of key marker genes in root cells (top) and endpoint cells (bottom). Gene set enrichment analysis plots depicting the enrichment of HSC signature in root cells (left), differentiating T-lymphocyte signature (middle), and interferon-γ response (right) in endpoint cells. (F) t-SNE plot of leukemic cells colored based on the predicted cell-cycle phase (left), and relative percentage of cell-cycle phase in stacked bar plot for roots and endpoint states (right). (G) Heatmap depicting clustered transcriptional regulons (predicted transcription factor activity based on target gene expression) in root and endpoint cells (“Materials and methods”). (H-I) Heatmaps demonstrate expression of HSC, MPP, CMP, GMP, CLP, ETP, DN1, DN2, DN2-3, DN3A, DN3B, DN3-4, DN4, and DP signatures in ETP-ALL and T-ALL PDX models. *NOTCH1 mutated. #PTEN deleted.
Functional heterogeneity in ETP-ALL reveals deranged developmental hierarchy with coexisting stem-like states and ineffectual lineage commitment. (A) Heatmap demonstrates expression of HSC, MPP, CMP, GMP, CLP, ETP, DN1, DN2, DN2-3, DN3A, DN3B, DN3-4, DN4, and DP signatures as defined by xcell23 in individual leukemic cells. (B) t-SNE plot of all malignant cells using genes involved in HSC, CLP, and CMP progenitor programs. Clusters are derived using the Louvain algorithm. (C) RNA velocities projected on the t-SNE plot containing leukemic cells with root and endpoint cells highlighted (circles). (D) Heatmap depicting the expression of marker genes in the identified root and endpoint cells. (E) Violin plots depicting expression of key marker genes in root cells (top) and endpoint cells (bottom). Gene set enrichment analysis plots depicting the enrichment of HSC signature in root cells (left), differentiating T-lymphocyte signature (middle), and interferon-γ response (right) in endpoint cells. (F) t-SNE plot of leukemic cells colored based on the predicted cell-cycle phase (left), and relative percentage of cell-cycle phase in stacked bar plot for roots and endpoint states (right). (G) Heatmap depicting clustered transcriptional regulons (predicted transcription factor activity based on target gene expression) in root and endpoint cells (“Materials and methods”). (H-I) Heatmaps demonstrate expression of HSC, MPP, CMP, GMP, CLP, ETP, DN1, DN2, DN2-3, DN3A, DN3B, DN3-4, DN4, and DP signatures in ETP-ALL and T-ALL PDX models. *NOTCH1 mutated. #PTEN deleted.
Although there is strong evidence for the existence of cancer stem cells in some solid tumors and AML, leukemia stem cells in ALL are much less studied.44-46 We hypothesized that despite the coexpression of stem cell and lineage markers in almost all cells, there might be a subpopulation of cells with more robust stem-like features. To this end, we first used t-SNE to cluster all leukemic cells based on expression of genes associated with HSC and progenitor cell programs (Figure 2B). We then employed RNA velocity to identify cells along a trajectory of maturation based on the levels of unspliced/spliced transcripts.16 Velocity projections onto t-SNE dimensions revealed 2 immature root states and a single endpoint state (Figure 2C). These states fell into distinct unsupervised clusters and consisted of cells from all patients, suggesting that they were governed by discrete transcriptional circuits (Figure 2C; supplemental Figure 13). Both root states were enriched for genes frequently associated with HSC, such as CD34, CD44, NCAM1, BCL11A, and GATA247-52 (Figure 2D-E; supplemental Tables 10 and 12). In contrast, the endpoint state was characterized by expression of genes associated with T-cell differentiation, such as IL7R, LCK, BCL11B, and CD38,53-56 typically expressed at low levels in stem-like root cells (Figure 2D-E; supplemental Tables 11 and 13). Endpoint cells also demonstrated strong enrichment of immune modulation signatures, marked by expression of IRF1, IFITM3, and IFI44L (Figure 2D-E).
We next focused on understanding how the 2 root states differed. Cell-cycle analysis demonstrated that cells in root 1 were not cycling, whereas root 2 cells were enriched for cells in S phase (Figure 2F; supplemental Figure 14). We reasoned that if these root states reflected distinct stem-like states, there should be distinct transcriptional regulators driving each state. Consequently, we identified the most prominent transcriptional regulons (transcription factor and its target genes) for each of the 2 root states using SCENIC23 (Figure 2G). Noncycling root 1 cells were enriched for transcriptional regulators involved in stemness (NANOG, SP1, and SP3), HOX genes, and AKT/mitogen-activated protein kinase signaling (FOXO1 and THRA). In contrast, cycling root 2 cells were characterized by activity of several chromatin remodelers, including histone deacetylases, SWI/SNF complex members, and SUZ12, as well as genes associated with glucocorticoid signaling. Of note, cells that did not belong to any of the 2 root states expressed transcriptional regulons driving immune modulation, including genes in the interferon pathway (supplemental Tables 11 and 13). Thus, ETP-ALL cells not only demonstrated deranged developmental states with ineffectual lineage commitment, but also showed 2 coexisting stem-like states that differed in their cell-cycle state and transcriptional dependencies.
Because our analyses so far focused on relapsed/refractory ETP-ALL patients with NOTCH1 mutations, which are present in up to 60% of ETP patients,30 we next investigated developmental hierarchies and lineage commitment in a panel of 7 ETP-ALL PDXs that were established from pediatric patients at time of diagnosis. Clinical characteristics, immunophenotype, and NOTCH1 mutation status of these models are listed in Table 2. Importantly, all of these ETP-ALL models also demonstrated coexpression of multiple precursor signatures and more mature thymocyte signatures in the same cell, independent of Notch mutation status (Figure 2H). We similarly evaluated a panel of 5 mature T-ALL PDXs, with and without NOTCH1 mutations. Clinical characteristics, immunophenotype, and NOTCH1 mutation status of these models are listed in Table 2. Although mature T-ALL cells also showed coexpression of HSC and CLP signatures simultaneously with more mature thymic signatures, activation of myeloid programs (GMP and CMP) was less common than in the ETP-ALL PDX models (Figure 2I).
Next, we evaluated whether we could detect transcriptional evidence of coexisting root states in these models. We first compiled markers for each of the 3 states from the differential transcription factor analysis and used CIBERSORT57 for deconvolution of the collapsed single cells of each PDX model (supplemental Figure 15A,G). Next, we called root and endpoint states after t-SNE clustering on HSC, CMP, and CLP signatures as described. These analyses also showed 2 coexisting root states with differential cell-cycle activity in the ETP and T-ALL PDX models (Figure 4B; supplemental Figure 15E,K). Lastly, coexisting signatures of these stem-like states could also be detected using CIBERSORT to deconvolute bulk RNA-seq data in a majority of the 216 T-ALLs in the National Cancer Institute TARGET study (supplemental Figure 16).
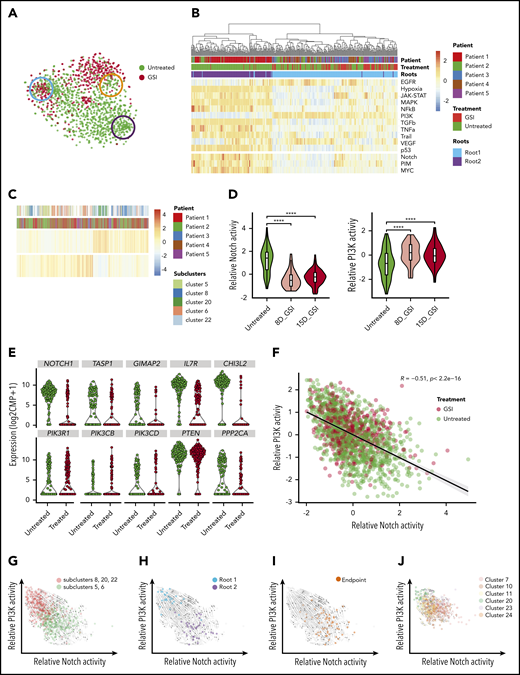
Notch inhibition expands preexisting cells with PI3K signaling activity that coexist with Notch-dependent cells and demonstrate opposing differentiation trajectories. (A) t-SNE plot of leukemic cells colored based on GSI treatment with roots and endpoint highlighted as in Figure 2C. (B) Heatmap depicts the relative activity of various signaling pathways as inferred by PROGENy in all cells comprising the 2 root states. (C) Heatmap demonstrating preexisting cells with PI3K activity in untreated patients. (D) Violin plots show decreasing Notch activity with increasing PI3K activity upon GSI treatment in patient 5 (P5). (E) Violin plots depicting expression of Notch1 target genes (top) and PI3K pathway genes (bottom) in untreated and GSI-treated single cells of P5. (F) Scatter plot depicting negative correlation between relative Notch activity and PI3K activity in leukemic cells from all patients. Cells are colored based on GSI treatment. (G) Projection of RNA velocity vectors onto untreated leukemic cells plotted by PI3K and Notch activity (subclusters defined by monocle; supplemental Figure 14G). (H) Leukemic cells belonging to 2 different root states are highlighted and fall into either high PI3K or high Notch activity clusters. (I) Enrichment of endpoint cells at the interface of converging velocity trajectories. (J) Leukemic cells with high PI3K activity persist after GSI treatment with preserved directionality of RNA velocity (subclusters identified by monocle; supplemental Figure 14G). ****P ≤ .0001 using Kruskal-Wallis test.
Notch inhibition expands preexisting cells with PI3K signaling activity that coexist with Notch-dependent cells and demonstrate opposing differentiation trajectories. (A) t-SNE plot of leukemic cells colored based on GSI treatment with roots and endpoint highlighted as in Figure 2C. (B) Heatmap depicts the relative activity of various signaling pathways as inferred by PROGENy in all cells comprising the 2 root states. (C) Heatmap demonstrating preexisting cells with PI3K activity in untreated patients. (D) Violin plots show decreasing Notch activity with increasing PI3K activity upon GSI treatment in patient 5 (P5). (E) Violin plots depicting expression of Notch1 target genes (top) and PI3K pathway genes (bottom) in untreated and GSI-treated single cells of P5. (F) Scatter plot depicting negative correlation between relative Notch activity and PI3K activity in leukemic cells from all patients. Cells are colored based on GSI treatment. (G) Projection of RNA velocity vectors onto untreated leukemic cells plotted by PI3K and Notch activity (subclusters defined by monocle; supplemental Figure 14G). (H) Leukemic cells belonging to 2 different root states are highlighted and fall into either high PI3K or high Notch activity clusters. (I) Enrichment of endpoint cells at the interface of converging velocity trajectories. (J) Leukemic cells with high PI3K activity persist after GSI treatment with preserved directionality of RNA velocity (subclusters identified by monocle; supplemental Figure 14G). ****P ≤ .0001 using Kruskal-Wallis test.
![Targeting preexisting drug-resistant leukemic cells with Notch/PI3K-directed combination therapy. (A) Heatmap depicts the relative activity of PI3K, Notch, PIM, and MYC activation signatures in single cells of ETP-ALL and T-ALL PDX samples. (B) Relative percentage of cell-cycle phase for root cells in ETP-ALL and T-ALL PDXs demonstrating lower cell-cycle activity in root 1 vs root 2. (C) Violin plots show Notch and PI3K activation in root 1 (PI3K high) and root 2 (Notch high) in ETP and T-ALL PDXs. (D) GSI and buparlisib are synergistic in KOPT-K1 T-ALL cells. Cell survival as assayed by CellTiter-Glo after 7-day culture (error bars reflect standard deviation [SD] from 3 replicates; left). Combination index analyses (3 replicates; right). (E) KOPT-K1 cells were pretreated with 1 μM buparlisib or DMSO for 3 days and then immediately sorted or cultured for an additional 24 hours without drug (Washout). Single cells from each of these populations were sorted into individual wells of 96-well plates and cultured with GSI (1 μM) or DMSO for 6 weeks. Bar plots indicate the fraction of single cells that form colonies in GSI (n = 480 wells). Pretreatment with buparlisib eliminates preexisting GSI-tolerant cells from untreated T-ALL populations, which cannot be reversed by 24-hour washout (error bars reflect SD, averaged from 5 plates, using 2-sided Student t test). (F) Flow cytometry demonstrating subpopulation of CD34+ cells with p4E-BP1(S65) and pAKT (Thr308) staining in KOPT-K1 cells (overlay histogram gated on CD34+ or CD34− cells, respectively; left). CD34+ population decreases with buparlisib treatment (barplot below; error bars reflect SD from 3 replicates). *NOTCH1 mutated, #PTEN deleted (A), **P < .01, ****P < .0001 using Kruskal-Wallis test (C), ****P < .0001 using 2-sided Student t test (E), *P < .05 using 2-sided t test (F). CI, combination index; Fa, fraction affected.](https://ash.silverchair-cdn.com/ash/content_public/journal/blood/137/18/10.1182_blood.2019004547/4/m_bloodbld2019004547f4.png?Expires=1763482936&Signature=owbu0PNQLFNvQpyaPwBdzLfr7exwG1ukvWHJ70Z4D-1G~it0hJ62nEJpMjFNXs4Ct8-pSIpXXnekxR0YJmjKNXUkFbKEe9nIZ60JQLB-o0FVb7Vld94O-RwIAF385yB0kQdrp8jcfcJYJg-AQelzTWgj6Mn-gaqnkdisOIAxWvl5b~8r7XNGO~-HCa2rrKSDvf53wHUxtRtwippqFDbBGgh~PYOWLM2XCZnbL3jYF0TjJVEtPkvimk7YntoK5zxqUEEGI-Z0yKp2ZsZ~DjvCyA0uHJoPdGgOjDm63bPutAYGgdkrj0r2KgTmrbxzRc5242gcnLRMVaCbOfoEd2Yyzg__&Key-Pair-Id=APKAIE5G5CRDK6RD3PGA)
Targeting preexisting drug-resistant leukemic cells with Notch/PI3K-directed combination therapy. (A) Heatmap depicts the relative activity of PI3K, Notch, PIM, and MYC activation signatures in single cells of ETP-ALL and T-ALL PDX samples. (B) Relative percentage of cell-cycle phase for root cells in ETP-ALL and T-ALL PDXs demonstrating lower cell-cycle activity in root 1 vs root 2. (C) Violin plots show Notch and PI3K activation in root 1 (PI3K high) and root 2 (Notch high) in ETP and T-ALL PDXs. (D) GSI and buparlisib are synergistic in KOPT-K1 T-ALL cells. Cell survival as assayed by CellTiter-Glo after 7-day culture (error bars reflect standard deviation [SD] from 3 replicates; left). Combination index analyses (3 replicates; right). (E) KOPT-K1 cells were pretreated with 1 μM buparlisib or DMSO for 3 days and then immediately sorted or cultured for an additional 24 hours without drug (Washout). Single cells from each of these populations were sorted into individual wells of 96-well plates and cultured with GSI (1 μM) or DMSO for 6 weeks. Bar plots indicate the fraction of single cells that form colonies in GSI (n = 480 wells). Pretreatment with buparlisib eliminates preexisting GSI-tolerant cells from untreated T-ALL populations, which cannot be reversed by 24-hour washout (error bars reflect SD, averaged from 5 plates, using 2-sided Student t test). (F) Flow cytometry demonstrating subpopulation of CD34+ cells with p4E-BP1(S65) and pAKT (Thr308) staining in KOPT-K1 cells (overlay histogram gated on CD34+ or CD34− cells, respectively; left). CD34+ population decreases with buparlisib treatment (barplot below; error bars reflect SD from 3 replicates). *NOTCH1 mutated, #PTEN deleted (A), **P < .01, ****P < .0001 using Kruskal-Wallis test (C), ****P < .0001 using 2-sided Student t test (E), *P < .05 using 2-sided t test (F). CI, combination index; Fa, fraction affected.
Targeting preexisting drug-resistant leukemic cells with Notch/PI3K-directed combination therapy. (A) Heatmap depicts the relative activity of PI3K, Notch, PIM, and MYC activation signatures in single cells of ETP-ALL and T-ALL PDX samples. (B) Relative percentage of cell-cycle phase for root cells in ETP-ALL and T-ALL PDXs demonstrating lower cell-cycle activity in root 1 vs root 2. (C) Violin plots show Notch and PI3K activation in root 1 (PI3K high) and root 2 (Notch high) in ETP and T-ALL PDXs. (D) GSI and buparlisib are synergistic in KOPT-K1 T-ALL cells. Cell survival as assayed by CellTiter-Glo after 7-day culture (error bars reflect standard deviation [SD] from 3 replicates; left). Combination index analyses (3 replicates; right). (E) KOPT-K1 cells were pretreated with 1 μM buparlisib or DMSO for 3 days and then immediately sorted or cultured for an additional 24 hours without drug (Washout). Single cells from each of these populations were sorted into individual wells of 96-well plates and cultured with GSI (1 μM) or DMSO for 6 weeks. Bar plots indicate the fraction of single cells that form colonies in GSI (n = 480 wells). Pretreatment with buparlisib eliminates preexisting GSI-tolerant cells from untreated T-ALL populations, which cannot be reversed by 24-hour washout (error bars reflect SD, averaged from 5 plates, using 2-sided Student t test). (F) Flow cytometry demonstrating subpopulation of CD34+ cells with p4E-BP1(S65) and pAKT (Thr308) staining in KOPT-K1 cells (overlay histogram gated on CD34+ or CD34− cells, respectively; left). CD34+ population decreases with buparlisib treatment (barplot below; error bars reflect SD from 3 replicates). *NOTCH1 mutated, #PTEN deleted (A), **P < .01, ****P < .0001 using Kruskal-Wallis test (C), ****P < .0001 using 2-sided Student t test (E), *P < .05 using 2-sided t test (F). CI, combination index; Fa, fraction affected.
Stem-like states are characterized by opposing oncogenic signaling through Notch or PI3K
We next focused on the effects of Notch inhibition. Monotherapy directed at Notch with GSI infrequently induces complete remission in T-ALL patients,26,58-62 suggesting that preexisting GSI-resistant tumor cells are present in most cases. We first confirmed cell-cycle arrest and downregulation of Notch target genes in the patients treated with GSI (supplemental Figure 14). We hypothesized that persistence of a stem-like population might be the reason for the limited effects of Notch inhibitors in patients with relapsed/refractory Notch-mutant T-ALL. Indeed, although Notch inhibition abolished the cycling stem-like root cells (root 2), noncycling root cells (root 1) persisted after Notch inhibitor treatment (Figure 3A).
We next sought to investigate the dependencies of the noncycling root cells, which must involve pathways independent of Notch. Differential activation of signaling pathways has been described as a mechanism of Notch inhibitor resistance.63-65 We predicted the activity of signaling pathways using PROGENy24 and also curated additional pathway signatures reflecting Notch, MYC, and PIM activation. This analysis revealed PI3K activation as the most anticorrelated pathway with Notch signaling, with PI3K activation being strongly enriched in noncycling root cells and virtually absent in the cycling root cells (Figure 3B; supplemental Figures 17 and 18; Table 3; supplemental Table 14). Interestingly, cells with high PI3K and low Notch signaling activity were already present pretreatment (Figure 3C), and PI3K activity increased with treatment while Notch activity decreased (Figure 3D-F; supplemental Figure 14; supplemental Table 14).
Correlation scores of signaling pathways inferred by PROGENy with Notch activity in root 1 vs root 2 leukemic cells
| Correlation | P | |
|---|---|---|
| PI3K – Notch | −0.69 | <2.2e−16 |
| VEGF – Notch | −0.12 | .022 |
| EGFR – Notch | −0.26 | 1.60e−06 |
| Hypoxia – Notch | 0.75 | <2.2e−16 |
| MAPK – Notch | 0.68 | <2.2e−16 |
| p53 – Notch | 0.7 | <2.2e−16 |
| TGFβ – Notch | 0.66 | <2.2e−16 |
| JAK/STAT – Notch | 0.52 | <2.2e−16 |
| TNFα – Notch | 0.62 | <2.2e−16 |
| NF-κB – Notch | 0.57 | <2.2e−16 |
| Trail – Notch | 0.54 | <2.2e−16 |
| PIM – Notch | 0.65 | <2.2e−16 |
| MYC – Notch | 0.74 | <2.2e−16 |
EGFR, endothelial growth factor receptor; MAPK, mitogen-activated protein kinase; TGF, transforming growth factor; TNF, tumor necrosis factor; VEGF, vascular endothelial growth factor.
PI3K pathway–activating mutations have been linked to Notch inhibitor resistance in murine models63,64 ; however, it is unclear how transcriptional rewiring, independent of PI3K pathway mutations, contributes to Notch and PI3K activation. To exclude genetically driven PI3K pathway activation, we performed deep targeted sequencing and mutation calling for known activating mutations in AKT1, AKT2, NOTCH1, PIK3CA, PIK3CB, PIK3CD, PIK3R1, PIKR3, PIKR6, and PTEN in all treated and untreated samples. We did not detect any mutations in these PI3K pathway genes, even in treated samples (average sequencing depth, 568 857×; supplemental Table 15). These data support transcriptional rewiring as the dominant driver of divergent Notch and PI3K activation. Indeed, PI3K-active vs Notch-active cells clustered separately by monocle2,14 consistent with their distinct transcriptional states (supplemental Figure 14A). Further analysis of the transcriptional dynamics of these subclusters revealed 2 states within untreated cells with either high Notch activity or high PI3K activity and antagonistic differentiation trajectories by RNA velocity that both pointed toward a shared state with intermediate PI3K and Notch activity (Figure 3G). Stem-like root cells fell into either Notch-active or PI3K-active populations (Figure 3H; correlation coefficient R = −0.7; P = 2.2e−16), whereas endpoint state cells were enriched at the interface, with no correlation between Notch and PI3K activity (Figure 3I; R = −0.28; P = 1.2e−07). With treatment, the subclusters with high PI3K activity dominated, but without any change in their differentiation trajectory toward the intermediate endpoint state at the interface (Figure 3J).
Because our analyses so far focused on relapsed/refractory ETP-ALL patients with NOTCH1 mutations, we next investigated whether we could detect divergent Notch and PI3K states in PDX models established from samples obtained at time of diagnosis before treatment. Within the 7 ETP-ALL PDXs and 5 mature T-ALL PDXs (Table 2), cells with high Notch expression signatures had low PI3K activation signatures and vice versa (Figure 4A). Focusing on the 2 root states, we found differential signatures of Notch and PI3K signaling, with root cells in the low-cycling state expressing high PI3K activation signatures and high-cycling root cells expressing higher Notch activation signatures (Figure 4B-C). Of note, these findings were independent of the presence of NOTCH1 mutations or PTEN deletions, consistent with transcriptional rewiring serving as the basis for these cell states.
These analyses suggest that combined targeting of Notch and PI3K signaling might target both stem-like states. To test this hypothesis, we first confirmed the synergistic effects of combined Notch inhibition (GSI) and PI3K inhibition (buparlisib) in T-ALL cell lines in vitro (Figure 4D; supplemental Figure 19A-C). We previously showed that a population of GSI-resistant cells preexisted in untreated T-ALL populations.58 We reasoned that this population might reflect preexisting PI3K dependent cells. Using single-cell cloning, we confirmed a preexisting population of GSI-tolerant cells (Figure 4E). These cells were highly dependent on PI3K signaling and were almost entirely eliminated by pretreatment with buparlisib before single-cell cloning in the presence of GSI (Figure 4E). Importantly, when we pretreated cells with buparlisib for 72 hours and then removed buparlisib 24 hours before isolation of individual cells, we did not recover GSI-resistant clones. Thus, PI3K inhibition effectively abrogated a population that did not recover after short-term drug removal, consistent with these cells carrying features required for colony growth.
To further explore whether we could detect direct evidence of PI3K activation in a subpopulation of untreated T-ALL cells, we assessed PI3K pathway activation by flow cytometry and identified a small fraction of cells that stained positive for the markers pAKT and p4E-BP1. Because CD34 was strongly expressed in the PI3K-dependent root state, we asked whether pAKT and p4E-BP1 were enriched in CD34+ cells. Indeed, we detected a small population of CD34+ cells in untreated KOPT-K1 cells (Figure 4F; supplemental Figure 19D), ∼20% of which showed PI3K activation by phosphoflow analysis, whereas CD34− KOPT-K1 cells were negative for these markers. Moreover, when KOPT-K1 cells were treated with GSI, this population expanded, whereas PI3K inhibition had the opposite effect (Figure 4F). These data support the existence of a PI3K-dependent population that expresses markers enriched in the stem-like root 1 state.
Immune evasion resulting from Galectin-9–HAVCR2 interactions in the leukemia microenvironment
Our analyses so far suggest that the 2 stem-like root populations in ETP-ALL can be targeted successfully by Notch and PI3K inhibition. However, the endpoint population that does not belong to either of the 2 root states may escape Notch/PI3K inhibition. This population was more mature and harbored active transcriptional regulons driving immune modulation (Figure 2D,E,G), indicating an unexpected interaction of leukemic cells with the immune microenvironment. Interestingly, this population carried prominent interferon signatures (Figure 2E), suggesting a particular role for T cells.66 We therefore assessed whether ETP-ALL was associated with altered T-cell function in the immune microenvironment. Remarkably, the T-cell receptor (TCR) repertoire of endogenous T cells in the leukemic patients was skewed toward oligoclonal TCR use when compared with normal donor T cells (Figure 5A). We hypothesized that oligoclonal TCR use reflected the presence of an expanded population of dysfunctional CD8+ T cells, as has been demonstrated in the microenvironment of several other malignancies.19,67
![CD8+ T-cell dysfunction in ETP-ALL. (A) Stacked bar plots depict percentage of clonal CD8+ T cells observed in individuals as inferred from TCR group use. (B-C) Pseudotime trajectory of CD8+ T cells inferred using monocle. Cells color coded based on monocle states (B) and source of CD8+ T cells (C). (D) Heatmap depicting expression of state-specific markers obtained through monocle. Canonical marker genes for naïve CD8+ T cells, activation and exhaustion/dysfunction are annotated in the heatmap. (E) Projection of RNA velocity vectors on the CD8+ T-cell states 5 and 6. (F) Boxplots depict exhaustion score calculated for each CD8+ T cell of all individuals from relative gene expression values of canonical naïve and exhaustion gene markers (“Materials and methods”; green, unique TCR; orange, recurrent TCR; blue, not determined [n.d.]). ****P ≤ .0001. ND, normal donor.](https://ash.silverchair-cdn.com/ash/content_public/journal/blood/137/18/10.1182_blood.2019004547/4/m_bloodbld2019004547f5.png?Expires=1763482936&Signature=XeMSprCC2G1ryDXvfgXGY6c8D1VsNCVlmtnFNGDszh33h-GqkB97vmRFQFDtSTZZbYkA-CKOCE9SHBWjKD48EsKHQUuZLFcqjTZqOOiwL6uasOcoPA8G60QjYVGevMnC4iTVogj8U0ffQG78JEmSjCaNQ38o~x7NlzLnT2yD8F3AhcQInV1RgL9DpHbhRzAIPz2nCFXeo--yWW~bdcXaXQSK8vqrYcF2ZiSAVugwShe3KUZzkNGhVEjtV1V-aE5tLYPlHyXQEOKs-dsk2uq5FqguORraU9y8MXcmPuG4v5mWAN7uhjIbgz8Zwqf1KzMP0GadewXDIwncCQgO4Bvo1w__&Key-Pair-Id=APKAIE5G5CRDK6RD3PGA)
CD8+ T-cell dysfunction in ETP-ALL. (A) Stacked bar plots depict percentage of clonal CD8+ T cells observed in individuals as inferred from TCR group use. (B-C) Pseudotime trajectory of CD8+ T cells inferred using monocle. Cells color coded based on monocle states (B) and source of CD8+ T cells (C). (D) Heatmap depicting expression of state-specific markers obtained through monocle. Canonical marker genes for naïve CD8+ T cells, activation and exhaustion/dysfunction are annotated in the heatmap. (E) Projection of RNA velocity vectors on the CD8+ T-cell states 5 and 6. (F) Boxplots depict exhaustion score calculated for each CD8+ T cell of all individuals from relative gene expression values of canonical naïve and exhaustion gene markers (“Materials and methods”; green, unique TCR; orange, recurrent TCR; blue, not determined [n.d.]). ****P ≤ .0001. ND, normal donor.
CD8+ T-cell dysfunction in ETP-ALL. (A) Stacked bar plots depict percentage of clonal CD8+ T cells observed in individuals as inferred from TCR group use. (B-C) Pseudotime trajectory of CD8+ T cells inferred using monocle. Cells color coded based on monocle states (B) and source of CD8+ T cells (C). (D) Heatmap depicting expression of state-specific markers obtained through monocle. Canonical marker genes for naïve CD8+ T cells, activation and exhaustion/dysfunction are annotated in the heatmap. (E) Projection of RNA velocity vectors on the CD8+ T-cell states 5 and 6. (F) Boxplots depict exhaustion score calculated for each CD8+ T cell of all individuals from relative gene expression values of canonical naïve and exhaustion gene markers (“Materials and methods”; green, unique TCR; orange, recurrent TCR; blue, not determined [n.d.]). ****P ≤ .0001. ND, normal donor.
To determine CD8+ T-cell differentiation states, we performed unsupervised pseudotime analysis using monocle214 and identified 6 T cell states that developed along a common trajectory (Figure 5B). State 1 consisted mostly of CD8+ T cells from normal donors that expressed markers characteristic of naïve CD8+ T cells (CCR7, IL7R, NELL2, SELL, and TCF7; Figure 5C-D). T cells demonstrated gradually increased expression of activation markers from state 2 through state 4. In contrast, states 5 and 6 contained mostly patient CD8+ T cells that exhibited increased expression of markers of T-cell exhaustion (PDCD1, TIGIT, LAG3, HAVCR2, and CD244), suggesting that these cells were dysfunctional (Figure 5D). Indeed, RNA velocity analyses confirmed the differentiation directionality from state 5 toward the more dysfunctional state 6 (Figure 5E). To determine the extent of exhaustion, we analyzed T-cell exhaustion scores in all single CD8+ T cells.19 High exhaustion scores were predominantly found in cells that showed oligoclonal TCR use from ETP-ALL patients, whereas CD8+ T cells with high exhaustion scores were much less prevalent in normal donors (Figure 5F).
Maintenance of T-cell dysfunction requires signals that are generated by binding of ligands to inhibitory receptors on activated T cells.68 Previous studies in mice have described distinct categories of dysfunctional T cells with differing susceptibilities to checkpoint inhibition, highlighting the need to identify specific ligand-receptor pairs across dysfunctional categories when considering therapeutic intervention.67 To determine which ligands and receptors were potentially relevant to T-cell dysfunction in ETP-ALL, we determined their expression levels and computed interaction scores69 between inhibitory receptors expressed on CD8+ T cells and their respective ligands in leukemia cells (Figure 6A-B). We found the strongest interaction score for HAVCR2 (TIM-3) and its ligand LGALS9 (Galectin-9), with LGALS9 being universally expressed in all leukemic cells (Figure 6B; supplemental Figure 20A). Analysis of T-ALLs from the TARGET study confirmed high expression of LGALS9 in the LMO2/LYL1 category, which contained most of the ETP cases, and also in more mature types of T-ALL (supplemental Figure 20B). IHC staining of bone marrow biopsies of ETP-ALL patients confirmed expression of LGALS9 on leukemic blasts and HAVCR2 on interspersed mononuclear cells (Figure 6C). In contrast to recent reports in AML, where LGALS9 has been shown to be coexpressed with its receptor HAVCR2, creating an autocrine loop,70 HAVCR2 and LGALS9 were not coexpressed on ETP-ALL blasts (supplemental Figure 20A). IHC staining on a larger panel of ETP and T-ALL patients confirmed LGALS9 expression in almost all cases, although it was sometimes confined to a subset of cells. This might still suffice to blunt T-cell responses, because LGALS9 can be secreted and function in a paracrine manner71,72 (supplemental Table 16).
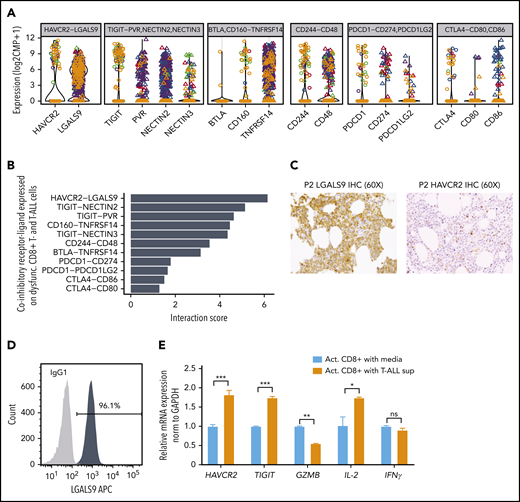
HAVCR2-LGALS9 interactions on dysfunctional CD8+ T cells and leukemic blasts. (A) Violin plots depict expression of coinhibitory receptors (on dysfunctional CD8+ T cells, shown as open circles) and their interacting ligands (on malignant T-ALL cells, depicted as triangles). Colors represent malignant clusters based on PAGODA2 (Figure 1). Each box corresponds to expression of the indicated coinhibitory receptor-ligand combination. (B) Receptor-ligand interaction scores inferred from expression of receptors (in CD8+ T cells) and ligands (in T-ALL cells), respectively, pointing toward prominent HAVCR2-LGALS9 interaction. (C) IHC of LGALS9 and HAVCR2 on bone marrow from representative ETP-ALL patient (P2) demonstrates strong staining of LGALS9 on leukemic blasts and interspersed HAVCR2 staining on microenvironmental cells (magnification ×60). (D) Intracellular immunofluorescent staining of LGALS9 and isotype control in DND-41 T-ALL cells. (E) mRNA expression of T-cell dysfunction markers (HAVCR2 and TIGIT) and effector cytokines (GZMB, IL-2, and IFNγ) on normal donor activated CD8+ T cells cultured with T-ALL supernatant vs control media. *P < .05, **P < .01, ***P < .001, averaged from 3 technical replicates using 2-sided Student t test.
HAVCR2-LGALS9 interactions on dysfunctional CD8+ T cells and leukemic blasts. (A) Violin plots depict expression of coinhibitory receptors (on dysfunctional CD8+ T cells, shown as open circles) and their interacting ligands (on malignant T-ALL cells, depicted as triangles). Colors represent malignant clusters based on PAGODA2 (Figure 1). Each box corresponds to expression of the indicated coinhibitory receptor-ligand combination. (B) Receptor-ligand interaction scores inferred from expression of receptors (in CD8+ T cells) and ligands (in T-ALL cells), respectively, pointing toward prominent HAVCR2-LGALS9 interaction. (C) IHC of LGALS9 and HAVCR2 on bone marrow from representative ETP-ALL patient (P2) demonstrates strong staining of LGALS9 on leukemic blasts and interspersed HAVCR2 staining on microenvironmental cells (magnification ×60). (D) Intracellular immunofluorescent staining of LGALS9 and isotype control in DND-41 T-ALL cells. (E) mRNA expression of T-cell dysfunction markers (HAVCR2 and TIGIT) and effector cytokines (GZMB, IL-2, and IFNγ) on normal donor activated CD8+ T cells cultured with T-ALL supernatant vs control media. *P < .05, **P < .01, ***P < .001, averaged from 3 technical replicates using 2-sided Student t test.
To test whether T-ALL cells could cause T-cell dysfunction, we first confirmed LGALS9 protein expression in T-ALL cell lines by flow cytometry (Figure 6D; supplemental Figure 21). We then cultured activated polyclonal CD8+ T cells from normal donors with and without T-ALL supernatant (containing LGALS9) for 3 days. CD8+ T cells exposed to T-ALL supernatant showed downregulation of Granzyme B, a major CD8+ T-cell effector molecule, and upregulation of the exhaustion markers HAVCR2 and TIGIT (Figure 6E), effects that were abrogated by a neutralizing anti-LGALS9 antibody (supplemental Figure 22). Moreover, upregulation of exhaustion markers was also observed when recombinant soluble LGALS9 was added to the culture (supplemental Figure 22).
Discussion
Here we defined the cellular states that characterized treatment failure in NOTCH1-mutated relapsed/refractory ETP-ALL treated with Notch inhibitor. Using full-length scRNA-seq analyses, we identified a deranged developmental hierarchy with coexisting stem-like and more mature states, ineffectual commitment to either lymphoid or myeloid lineage, and immunomodulatory characteristics. Stem-like states showed distinct transcriptional circuitries and differed with regard to cell cycle, epigenetic machinery, and oncogenic signaling.
Notch pathway activation is the most prevalent oncogenic aberration in T-ALL, including ETP-ALL; however, Notch inhibition usually fails to control the disease in vivo.26,59 Based on our results, Notch inhibition seems to be ineffectual because of preexisting stem-like cells exhibiting a resistant state defined by high levels of PI3K signaling and low Notch activity. Genetic mechanisms of PI3K activation that allow for active proliferation and outgrowth of resistant subclones in the presence of Notch inhibition have been well characterized.63,64 Our findings described here differ from past work in several aspects: 1) we show that cells with PI3K activity are preexisting, meaning present before exposure to Notch inhibitors in relapsed disease and also in samples taken at diagnosis before any therapy; 2) we note that PI3K activation is independent of genetic mutations in PI3K/AKT/PTEN pathway genes, consistent with epigenetic rewiring; 3) we find that the subpopulation of PI3K high cells demonstrates stem-like gene expression signatures; and 4) our analyses show that the PI3K active stem-like population proliferates less than the stem-like state with high Notch activity and other leukemic cells, reminiscent of slow-cycling stem cells that have been described in other malignancies.73 These findings have important therapeutic implications, because they provide support for use of combination therapies targeting Notch and PI3K. However, combining Notch with PI3K inhibitors may also be antagonistic given biochemical data showing that GSI treatment of NOTCH1-mutant T-ALL cells may increase AKT phosphorylation,63,74 which might lead to decreased effects of PI3K inhibitors. In addition, our study also cautions that combined inhibition of Notch and PI3K may not be enough to completely eliminate all cancer cells because of the coexistence of multiple transcriptional states, resulting in low Notch and PI3K activity in individual cancer cells, which provide a route to escape. Additional studies investigating the mechanistic and temporal relationships of genetic and epigenetic drivers of PI3K vs Notch activation are needed to develop optimal combination regimens for clinical translation. Interestingly, a recent study using deep genomic sequencing of matched diagnosis/relapsed ALL samples showed that ∼20% of relapses progress through a nongenetic drug-resistant state before the acquisition of resistance mutations,75 suggesting that similar resistance mechanisms may be at play as described here for Notch inhibition.
Lineage plasticity and stemness have been implicated in drug resistance in cancer, and single-cell sequencing studies of solid tumors have highlighted how cancer cells relate to and maintain the developmental hierarchy of their respective tissue.76-78 A recent study in AML demonstrated that although leukemic cells take on different developmental states based on their genetic drivers, they follow the developmental hierarchy of hematopoiesis.79 Remarkably, in ETP-ALL, we found a deranged developmental hierarchy. We identified hematopoietic stem, myeloid, and lymphoid progenitor signatures present in almost all individual cells. Differentiation trajectories within the leukemic population identified 2 coexisting stem-like states that differed with regard to cell cycle as well as Notch and PI3K activity. Our work indicates that stem-like states in relapsed ETP-ALL are nonuniform and differ in their epigenetic wiring, oncogenic signaling, and cycling potential. Although our study mostly focused on relapsed/refractory ETP-ALL, our data also suggest that coexisting stem-like states are present in newly diagnosed, untreated ETP-ALL and in more mature T-ALLs. Whereas these states were associated with a considerable degree of lineage infidelity, the differentiation routes that each individual cancer cell took do not seem to have been arbitrary but followed convergent trajectories. Therefore, therapeutic targeting based on cellular states rather than genetic variants may limit the options of molecular escape for each cancer cell.
Closer exploration of ETP-ALL cells within their immune microenvironment demonstrated an unexpected role of immune evasion. Surprisingly, strong immune activation signatures were detected in all states, most prominently in the endpoint state. Targeting a dysfunctional microenvironment with checkpoint blockade has gained attention in several cancers, including lymphomas.80-82 Our study demonstrates a possible role for HAVCR2-LGALS9 interactions in causing CD8+ T-cell dysfunction, which may provide a novel therapeutic strategy to restore T-cell function and thereby generate an effective host immune response. Our data suggest that the convergence to the endpoint state may be due to microenvironmental pressure. Additional studies are needed to understand the relative contributions of cell-intrinsic rewiring and microenvironmental effects and their evolution with treatment. Encouragingly, immunomodulatory programs in ETP-ALL cells seem to transcend individual stem-like and differentiation states, providing attractive opportunities for the combination of specific targeting of signaling pathways with checkpoint blockade or other immunotherapy approaches. Thus, combination therapies that target defined cellular states combined with immunotherapeutic approaches may produce more effective treatments for relapsed/refractory hematopoietic cancers.
Presented in abstract form at the 61st Annual Meeting of the American Society of Hematology, Orlando, FL, 9 December 2019.
Data have been deposited at GEO under accession number GSE161901. Codes used for generation of all the figures and the analyses will be made available on Github upon request.
The online version of this article contains a data supplement.
The publication costs of this article were defrayed in part by page charge payment. Therefore, and solely to indicate this fact, this article is hereby marked “advertisement” in accordance with 18 USC section 1734.
Acknowledgments
The authors thank the Knoechel and Lohr laboratory members for discussions and helpful comments on the manuscript, the Jimmy Fund DFCI Flow Cytometry core for its support with flow sorting, and the Dana-Farber/Harvard Cancer Center (Boston, MA) for the use of the Specialized Histopathology Core, which provided histology and IHC services.
The Dana-Farber/Harvard Cancer Center is supported in part by the National institutes of Health (NIH), National Cancer Institute (NCI) Cancer Center Support (grant NIH 5 P30 CA06516). A.G.-A. was supported by a PMC FLAMES Award for Innovation in Research. This research was supported by NIH, NCI (K08CA191091, K08CA191026), St. Baldrick’s Foundation (B.K.), Hyundai Hope on Wheels Foundation (B.K.), AACR Mark Foundation (B.K.), Cookies for Kids' Cancer Childhood Research Foundation (B.K.), and Ludwig Cancer Research (A.A.L., J.C.A.). J.C.A. is the Michael Gimbrone Chair at Brigham and Women’s Hospital. B.E.B. is the Bernard and Mildred Kayden Endowed MGH Research Institute Chair and an American Cancer Society Research Professor.
Authorship
Contribution: P.A., A.G.-A., V.D., H.Y., Y.D., N.S., A.R., M.M.O., M.N., S.P., R.I., J.A.K., T. Vijaykumar, L.N., T. Vincent, G.G., and J.F. designed and performed the experiments and analyzed the data; M.H.H., A.E.P., L.B.S., D.T.T., A.A.L., D.J.D., J.C.A., and B.E.B. provided input on the study design; P.A., A.G.-A., V.D., J.G.L., and B.K. wrote the manuscript with input from B.E.B. and J.C.A; and J.G.L. and B.K. supervised the project.
Conflict-of-interest disclosure: J.G.L. receives research funding from Celgene for an unrelated research project and is an advisor for T2 Biosystems. B.E.B. discloses financial interests in Fulcrum Therapeutics, 1CellBio, HiFiBio, Arsenal Biosciences, Cell Signaling Technologies, and Nohla Therapeutics. J.C.A. is an advisor for Cellestia, Ayala, and Epizyme. The remaining authors declare no competing financial interests.
Correspondence: Birgit Knoechel, Dana-Farber Cancer Institute, 450 Brookline Ave, Boston, MA 02215; e-mail: birgit_knoechel@dfci.harvard.edu; and Jens G. Lohr, Dana-Farber Cancer Institute, 450 Brookline Ave, Boston, MA 02215; e-mail: jensg_lohr@dfci.harvard.edu.

This feature is available to Subscribers Only
Sign In or Create an Account Close Modal