

Key Points
Impaired cell surface tPA-dependent plasmin generation is associated with VTE.
Reduced expression of the cell surface fibrinolytic coreceptor annexin A2 may constitute a risk factor for VTE.

Abstract
Reduced plasma fibrinolysis has been identified as a potential risk factor for venous thromboembolism (VTE), but the role of cell surface fibrinolysis in VTE is unknown. The annexin A2/S100A10 complex serves as a coreceptor for plasminogen and tissue plasminogen activator (tPA), augmenting plasmin generation by 60-fold on the endothelial cell surface. Several studies in both mice and humans support the concept that A2 regulates fibrin homeostasis and intravascular thrombosis in vivo. Here, we examined A2 protein expression and function in 115 adult subjects with VTE and 87 healthy controls. Using peripheral blood mononuclear cells as a surrogate for endothelial cells, we found a 41% mean decrease in cell surface tPA-dependent fibrinolytic activity in subjects who had a positive personal and family history of VTE but tested negative for known inherited thrombophilias (ITs). A2 protein was reduced on average by 70% and messenger RNA levels by 30%, but neither decrease correlated with anticoagulant therapy. Neither cell A2 protein nor cell surface plasmin generation correlated with plasma-based clot lysis times, suggesting that the plasma and cell surface fibrinolytic systems operate independently of one another. These data suggest that reduced expression of annexin A2 protein is associated with cell surface hypofibrinolysis and may represent a novel risk factor for IT.
Introduction
Thrombosis is a major contributor to morbidity and mortality worldwide. In the United States alone, venous thromboembolism (VTE) affects up to 600 000 people and causes 60 000 to 100 000 deaths each year.1,2 The pathophysiology of VTE includes environmental triggers such as prolonged immobility, trauma, or malignancy; acquired autoimmune disorders such as antiphospholipid antibody syndrome; and common inherited thrombophilias (ITs), such as factor V Leiden (FVL), prothrombin G20210A variant (prothrombin gene mutation [PGM]), and deficiencies in the natural anticoagulants protein C (PC), protein S (PS), or antithrombin (AT). In most studies of VTE, only 30% to 50% of patients have an identified inherited or acquired thrombophilia, suggesting the existence of undiscovered mechanisms.3-5 Although most studies on thrombophilia have focused on abnormalities in the coagulation pathway, recent evidence indicates that plasma hypofibrinolysis, defined as a clot lysis time (CLT) at or above the 90th percentile, doubles the risk of VTE.6 Additional studies have revealed the existence of cell surface receptors that localize fibrinolytic activity on endothelial cells and circulating mononuclear cells, but there are, to our knowledge, no studies that identify cell surface fibrinolytic dysfunction with VTE and/or suspected thrombophilia.2
Annexin A2, a regulator of cell surface–based fibrinolysis, is a calcium-sensing, phospholipid-binding protein that forms a heterotetramer with S100A10 (protein p11) on the surface of endothelial cells.7 This complex, designated (A2-S100A10)2, serves as tightly regulated surveillance system that binds plasminogen and tissue plasminogen activator (tPA) and increases the catalytic efficiency of tPA-dependent cell surface plasmin generation by 60-fold in vitro.8,9 Previous studies from our group indicate that tPA interacts specifically with the N-terminal “tail” domain of A2,10 whereas plasminogen binds to a C-terminal lysine residue (K308) that is revealed upon cleavage of the protein.9 In mouse studies, global knockout of the annexin A2 gene is associated with both fibrin accumulation in and around blood vessels and impaired clearance of arterial thrombi.11 Fibrinolytic dysfunction is also evident when the tPA-binding N-terminal domain of A2 is blocked upon adduct formation with homocysteine through C9.12 In rat stroke models, pretreatment with A2 reduced infarct size and improved cerebral blood flow,13,14 and the combination of low-dose tPA with A2 was as effective as high-dose tPA alone in restoring blood flow, reducing infarct size, and extending the therapeutic window.15 Another recent study in mice revealed that fibrinolytic activity serves to prevent thrombosis in mice subjected to venous stasis.16
In humans, overexpression of annexin A2 is associated with hyperfibrinolysis and severe hemorrhage in acute promyelocytic leukemia.17,18 On the other hand, anti-A2 antibodies have been identified in patients with severe thrombotic manifestations in antiphospholipid syndrome19 and idiopathic cerebral venous thrombosis.20 In patients with sickle cell disease, moreover, single-nucleotide polymorphisms (SNPs) in ANXA2 correlate with increased risk of stroke.21,22
In the present study, we assessed the potential contribution of the annexin A2 cell surface fibrinolytic system to the development of VTE. We show for the first time that severe reduction in A2 protein expression and function is associated with VTE, especially in subjects with a positive family history (FH) of VTE but without evidence of IT (PGM, FVL, PC, PS, or AT). These data suggest that deficiency of A2 may underlie VTE in some subjects.
Methods
Study subjects
The study protocol was approved by the Institutional Review Board and the Clinical Translational Science Center at Weill Cornell Medicine. Subjects 18 to 66 years of age were enrolled in the outpatient hematology clinic and provided written informed consent. The primary case population (n = 115), enrolled between September 2010 and May 2019, included patients with a history of VTE in any location, with or without an FH of IT, including (PGM, FVL, PC, PS, and AT) (Table 1). An FH was considered positive if one or more first- or second-degree relatives had sustained a VTE. Healthy controls (HCs; n = 87) were recruited through the Clinical Translational Science Center. Exclusion criteria included a history of VTE within the prior 3 months. All samples were processed and analyzed in a double-blind fashion.
Characteristics of VTE subjects and HCs
| Healthy controls | VTE subjects | |
|---|---|---|
| Number | 87 | 115 |
| Age (mean ± SD), y | 35.6 ± 11.7 | 43.6 ± 11.6* |
| Female, n (%) | 45 (51.7) | 59 (51.3) |
| Mean BMI, kg/m2 ± SD | 26.9 ± 6.2 | 28.0 ± 5.5 |
| Overweight (BMI = 25-29.9 kg/m2), n (%) | 28 (32.2) | 45 (39.1) |
| Obese (BMI >30 kg/m2), n (%) | 23 (26.4) | 36 (31.3) |
| Hypertension, n (%) | 0 (0) | 11 (9.6) |
| History of smoking, n (%) | 0 (0) | 6 (5.2) |
| History of diabetes, n (%) | 8 (9.2) | 2 (1.7) |
| Receiving anticoagulant treatment, n (%) | 0 (0) | 74 (64.3) |
| VTE subjects with ≥1 IT, n (%) | NT | 40 (34.8) |
| Total number of ITs detected† | 45 | |
| FVL | NT | 25 (21.7) |
| PGM | NT | 13 (11.3) |
| PS | NT | 4 (3.5) |
| PC | NT | 1 (0.9) |
| AT | NT | 2 (1.7) |
| VTE subjects with >1 IT, n (%) | NT | 5 (4.4) |
| FH of VTE, n (%) | 3 (3.4) | 51 (44.3) |
| Positive FH and ≥1 IT, n (%) | 0 (0) | 19 (37.3) |
| Positive FH and no IT, n (%) | 0 (0) | 32 (62.7) |
| Anti-annexin A2 IgG, number positive/number assayed (%) | 1/60 (1.7) | 1/95 (1.1) |
| Anti-S100A10 IgG, number positive/number assayed (%) | 2/60 (3.3) | 0/95 (0) |
P values reflect comparison of experimental group with HC group by 1-way ANOVA and Tukey’s post hoc test.
BMI, body mass index; NT, not tested; SD, standard deviation.
P = .0000.
Five subjects had >1 IT.
Isolation of PBMCs
Whole blood (10 mL) was collected in EDTA-coated vacutainer tubes (Becton Dickinson) and stored at 4°C within 1 hour. Within 3 hours, blood was diluted aseptically into Dulbecco’s phosphate-buffered saline (PBS) containing 0.10 g/L CaCl2 and 0.10 g/L MgCl2•6H2O (PBS-CM), layered on FicollPaque PLUS (GE Healthcare Life Sciences), and centrifuged at 400g (30 minutes, 19°C). The buffy coat at the plasma-FicollPaque interface was removed, and peripheral blood mononuclear cells (PBMCs) were washed twice and stored in 90% fetal bovine serum/10% dimethyl sulfoxide at −80°C. This method typically yielded 95% ± 5% mononuclear cells composed of ∼85% lymphocytes and 15% monocytes.23
Cell surface plasmin generation
PBMCs were thawed in a 37°C water bath within 1 month of blood drawing, washed 3 times with PBS-CM, and counted by hemocytometer. Viability, as judged by Trypan blue exclusion, was ≥95%. Cells were suspended in PBS-CM containing 10 mM ε-aminocaproic acid (Sigma, #A2504-25G; 4°C, 20 minutes), centrifuged, and resuspended in sterile PBS-CM/0.2% BSA (4°C, 5 minutes). Human Glu-plasminogen (1.7 µM, Sekisui) was added (1 hour, 4°C, gentle rocking), and the cells washed twice with PBS-CM, resuspended in PBS-CM containing tPA (20 nM, Genentech or Molecular Innovations #HTPA) premixed with a fluorogenic plasmin substrate (AFC-81, D-Val-Leu-Lys-7-amino-4-trifluoromethylcoumarin, 125 µM, MP Biomedicals) at 0.3 × 10⁷ cells/mL, and deposited into 96-well plates (100 µL/well). Substrate hydrolysis was measured as relative fluorescence units (RFUs) at excitation 400 nm and emission 505 nm using a SpectraMax Gemini microplate spectrofluorometer (Molecular Devices) at 3-minute intervals for the first 15 minutes of the reaction. Initial rates of plasmin generation were calculated using linear regression analysis of RFUs vs time,2 as previously described,24 and typically varied 3.9% to 4.9% when repeated 3 times. In antibody blocking experiments, PBMCs were treated with mouse monoclonal anti-A2 immunoglobulin gG1 (IgG1; BD Biosciences, #610069; 10 µg/mL) or mouse non-immune IgG1 (BD Biosciences, #550878; 10 µg/mL) with gentle rocking (30 minutes, 4°C) prior to addition of plasminogen and again during the tPA/AFC-81 incubation step (10 µg/mL, 30 minutes, 4°C).
Protein expression
Washed PBMCs were resuspended in radioimmunoprecipitation assay buffer (RIPA; 150 mM Tris HCl, pH 7.5, 150 mM NaCl, 1 mM EDTA, 1% octylphenoxypolyethoxyethanol [Igepal CA-630, Sigma-Aldrich], and 1% sodium deoxycholate) containing a broad-spectrum protease inhibitor cocktail active against serine, cysteine, and metalloproteases, as well as calpains (Roche, #11836153001; 1:100 v/v dilution), and lysed on ice (30 minutes). The lysates were clarified (16 000g; 15 minutes, 4°C) and protein concentration determined using the bicinchoninic acid assay (Sigma). Lysate proteins (20 µg) were resolved on 4% to 20% linear gradient sodium dodecyl sulfate-polyacrylamide gel electrophoresis gels (Invitrogen) under reducing conditions (20 mM dithiothreitol) at constant 150 V (90 minutes). Proteins were transferred to polyvinylidene difluoride membranes (Thermo Fisher Scientific; constant 110 V, 4°C, 90 minutes) and the membrane washed twice in Tris-buffered saline containing 0.1% Tween 20 (TBS-T; pH 7.4, 20°C, 10 minutes each), blocked with 5% nonfat milk in TBS-T (20°C, 60 minutes), and incubated with primary antibodies (4°C, 16 hours). The membranes were washed twice again and incubated with secondary antibodies (20°C, 60 minutes). All antibodies were diluted in 5% nonfat milk in TBS-T. Primary antibodies included mouse monoclonal anti-human annexin A2 (1:1000; BD, #610069), rabbit monoclonal anti-human annexin A2 (1:1000; Cell Signaling, #D11G2), and anti-human annexin A2 (1:5000; kindly provided by Pfizer), as well as mouse monoclonal anti-human S100A10 (1:3000; BD Bioscience, #610070), mouse monoclonal anti-human glyceraldehyde-3-phosphate dehydrogenase (GAPDH; 1:13 000; Meridian, #H86504M), and rabbit polyclonal anti-human annexin A5 (1:1000; Cell Signaling, #8555S). Secondary antibodies were ovine horseradish peroxidase (HRP)–conjugated anti-mouse IgG used at 1:1000 to 1:13 000 (GE Healthcare, #NA931) and donkey HRP-conjugated anti-rabbit IgG at 1:2000 (GE Healthcare, #NA934). Blots were developed with chemiluminescent HRP substrate (ECL, Promega). Pixel counts were obtained from scanned images of immunoblot bands within the linear signal range of interest using Image Studio Lite software, version 5.2, and protein ratios calculated with respect to the GAPDH signal. All subjects with VTE and low A2 had a repeat sample drawn at least 3 months after the initial sample.
Anti-A2 autoantibody screening
For autoantibody screening, recombinant A2, A5, S100A10, or S100A4 proteins (100 ng/lane) were resolved by sodium dodecyl sulfate-polyacrylamide gel electrophoresis, transferred to polyvinylidene difluoride membranes, probed with subject IgG affinity purified on protein A/G agarose beads (100 ug/mL; 18h, 4°C), followed by HRP-conjugated ovine anti-human IgG (1:3000), and developed as above.
Quantitative RT-PCR
RNA was isolated from 4 × 10⁶ thawed PBMCs using the RNeasy Plus Mini Kit Quick-Start protocol (Qiagen). Reverse transcriptase polymerase chain reaction (RT-PCR) reactions were carried out using the One-Step RT-PCR kit (Invitrogen) using Taq polymerase and ANXA2 forward (5′-ATGTCTACTGTTCACGAAATC-3′) and reverse (5′-CCGACGAGGACTCTCTCATT-3′) primers, which capture all major messenger RNA (mRNA) variants. Thermal cycler (Applied Biosystems 7900HT) settings were 50°C/30 minutes and 95°C/15 minutes to initialize, followed by 26 cycles of 94°C/30 seconds, 50°C/30 seconds, and 72°C/30 seconds for denaturation, annealing, and extension, respectively, and 72°C/2 minutes and 4°C/18 hours for stabilization. All samples were run in triplicate. The integrity of the PCR products was evaluated on 2% agarose gels using GreenGlo Safe DNA stain (Denville Scientific).
Long-range PCR and DNA sequencing
Approximately 60 kb of the ANXA2 gene sequence, along with 10 kb of the 5′ untranslated region (UTR) and 1 kb of the 3′ UTR, was segmented into 6 overlapping fragments for long-range PCR using the PrimeSTAR GXL DNA polymerase kit (Takara, #R050A). The following sets of primers were used: set 1, forward 5′-GTGAGAATGCAGCCAAGCCAAGGA-3′ and reverse 5′-GCTGCACTCAACACCTACTAGCGCC-3′; set 2, forward 5′-GAAGGCTGGCTGCCATGACTACCG-3′ and reverse 5′-TCTTGCCTTTCACTGCCAGGGCAC-3′; set 3, forward 5′-TCGGCATGGGAGGAAAGTGGCCA-3′ and reverse 5′-AACACAGGCCTAGGGGTGGACAGA-3′; set 4, forward 5′-TTCCCAGCATGTCATTGCAGCAGCC-3′ and reverse 5′-GCAGGCAGTCATTGCTCCAGAATCG-3′; set 5, forward 5′-AGCCCAGGCACACGTCCACTTTG-3′ and reverse 5′-GCAGGCATCTTAGCCCGAACCCT-3′; and set 6, forward 5′-CCACCATCT TGTGCTCTGGTGAAGC-3′ and reverse 5′-ACAGCTTGACTGAAGAGGACAGGCT-3′. PCR products were resolved on 0.7% agarose gels, and DNA isolated from products of the correct size using the QIAEX II Gel Extraction Kit (Qiagen, #20021). The resulting isolates were fragmented and subsequently sequenced (single end, 150 bp) on an Illumina MiSeq Sequencer at Cornell University’s Genomics Facility in Ithaca, NY. Sequence data were analyzed by the Applied Bioinformatics Core at Weill Cornell Medicine Variants were identified, annotated, and manually explored using SnpEff open source software according to the Broad Institute’s Genome Analysis Tool Kit best practices.
Statistical analysis
Statistical analyses were performed using 1-way analysis of variance (ANOVA) followed by Tukey’s multiple comparisons test using statpages.info.
Results
A total of 115 subjects with a history of VTE and 87 HCs were studied (Table 1). Mean age was 43.6 and 35.6 years for the VTE and HC groups, and female subjects were equally represented at 51.3% and 51.7%, respectively. Rates of obesity, hypertension, smoking, and diabetes did not differ significantly between the 2 groups. Among all VTE subjects, 34.8% had ≥1 identified IT (FVL, 21.7%; PGM, 11.3%; PS, 3.5%; PC, 0.9%; and AT, 1.7%); 5 subjects had >1 IT. Of note, ITs were found in subjects with (32.8%) and without (41.2%) an FH. A positive FH for VTE was reported in 44.3% of VTE subjects, 37.3% of whom tested positive for ≥1 IT. A total of 32 VTE subjects, 62.7% of those with a positive FH or 27.8% of all VTE subjects, had a positive FH but no evidence of an IT.
To examine cell surface fibrinolysis in subjects with VTE, we conducted cell surface plasmin-generation assays using PBMCs as a surrogate for endothelial cells (Figure 1). The mean rate of plasmin generation for subjects with VTE was reduced by 33% compared with HCs (0.33 ± 0.02, n = 106 vs 0.49 ± 0.05, n = 60, RFU/min2, standard error of the mean [SEM], P = .0034) (Figure 1A), and this reduction was seen in VTE subjects both receiving and not receiving anticoagulant therapy (Figure 2A). We also observed a significant reduction in cell surface plasmin generation in samples from the subgroup with VTE and a positive FH (0.29 ± 0.04, n = 45, SEM, P = .0037), but not in those with VTE and a negative FH (0.35 ± 0.03, n = 61, SEM, P = .0572) compared with HCs. In addition, cell surface plasmin generation was reduced further in VTE subjects with a positive FH, but no identified IT (0.25 ± 0.04, n = 24, SEM, P = .0031), but not for those with ≥1 IT (0.35 ± 0.07, n = 21, SEM, P = .3057). Plasmin generation among VTE subjects with a positive FH but no identified IT was further reduced vs those with an identified IT, but the comparison did not reach statistical significance. These data indicated a significant reduction in cell surface tPA-dependent plasminogen activation among subjects with a FH but no known IT.
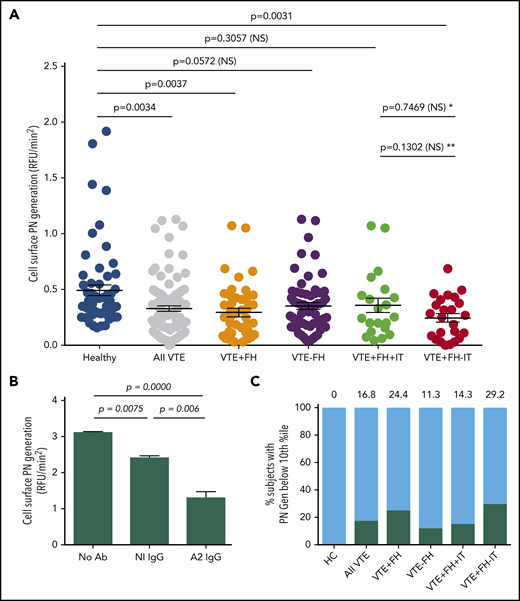
Cell surface tPA-dependent plasmin generation in VTE. (A) PBMC-related plasmin generating capacity. PBMCs from HCs and subjects with history of VTE were incubated with human Glu-plasminogen, washed, and then incubated with tPA (Genentech) in the presence of the fluorogenic plasmin substrate AFC-81. Shown are individual RFU/min2 values as well as means ± SEM for 60 HCs, 106 subjects with history of VTE, and VTE subgroups, including VTE with positive FH (VTE+FH, n = 45), VTE-FH (n = 61), VTE+FH+IT (n = 21), and VTE+FH-IT (n = 24). P values were determined using 1-way ANOVA and Tukey’s post hoc test of significance. Asterisks (* and **) indicate statistical significance (by Tukey’s post hoc vs unpaired t test, respectively). (B) Annexin A2–specific cell surface plasmin generation. HC PBMCs were incubated with Glu-plasminogen, followed by tPA (Molecular Innovations) and AFC-81 in the absence or presence of blocking monoclonal anti-A2 IgG or control IgG. Shown are values for mean RFU/min2 ± SEM from 3 separate experiments combined. The data were analyzed using 1-way ANOVA and Tukey’s post hoc test of significance. (C) Stratification of cell surface plasmin generation values. Values for cell surface plasmin generation (RFU/min2) depicted in panel A were stratified into 10th-percentile bins. The proportion of samples from each group falling into the lowest decile is indicated above each bar and by the black solid bars. NS, not significant; PN, plasmin.
Cell surface tPA-dependent plasmin generation in VTE. (A) PBMC-related plasmin generating capacity. PBMCs from HCs and subjects with history of VTE were incubated with human Glu-plasminogen, washed, and then incubated with tPA (Genentech) in the presence of the fluorogenic plasmin substrate AFC-81. Shown are individual RFU/min2 values as well as means ± SEM for 60 HCs, 106 subjects with history of VTE, and VTE subgroups, including VTE with positive FH (VTE+FH, n = 45), VTE-FH (n = 61), VTE+FH+IT (n = 21), and VTE+FH-IT (n = 24). P values were determined using 1-way ANOVA and Tukey’s post hoc test of significance. Asterisks (* and **) indicate statistical significance (by Tukey’s post hoc vs unpaired t test, respectively). (B) Annexin A2–specific cell surface plasmin generation. HC PBMCs were incubated with Glu-plasminogen, followed by tPA (Molecular Innovations) and AFC-81 in the absence or presence of blocking monoclonal anti-A2 IgG or control IgG. Shown are values for mean RFU/min2 ± SEM from 3 separate experiments combined. The data were analyzed using 1-way ANOVA and Tukey’s post hoc test of significance. (C) Stratification of cell surface plasmin generation values. Values for cell surface plasmin generation (RFU/min2) depicted in panel A were stratified into 10th-percentile bins. The proportion of samples from each group falling into the lowest decile is indicated above each bar and by the black solid bars. NS, not significant; PN, plasmin.
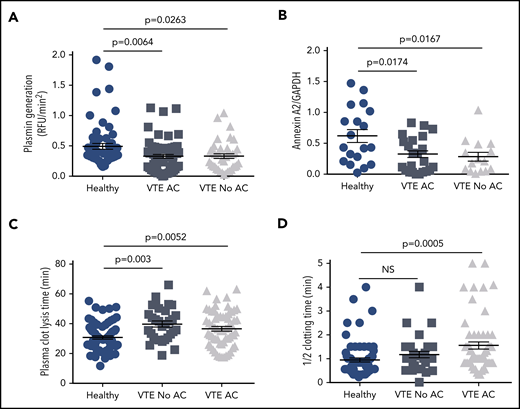
Effect of anticoagulation on plasmin generation, annexin A2 expression, and plasma CLT and CT. The data for cell surface plasmin generation (A), annexin A2 expression (B), plasma CLT (C), and plasma half-CT (D) were stratified according to anticoagulation therapy (AC) and compared with HCs. Shown are mean values ± SEM and P values derived by ANOVA and Tukey’s post hoc test of significance.
Effect of anticoagulation on plasmin generation, annexin A2 expression, and plasma CLT and CT. The data for cell surface plasmin generation (A), annexin A2 expression (B), plasma CLT (C), and plasma half-CT (D) were stratified according to anticoagulation therapy (AC) and compared with HCs. Shown are mean values ± SEM and P values derived by ANOVA and Tukey’s post hoc test of significance.
To determine the degree to which annexin A2 (compared with other fibrinolytic receptors)25 might contribute to cell surface tPA-dependent fibrinolysis on PBMCs, we assayed plasmin generation in the presence or absence of a monoclonal anti-A2 blocking antibody (Figure 1B). Compared with untreated cells from an HC, there was a small but statistically significant (22.8%) reduction in cell surface plasmin generation in the presence of a nonspecific isotype control antibody (3.11 ± 0.03 vs 2.40 ± 0.06 RFU/min2; n = 3, SEM, P = .0075). In the presence of anti-A2 IgG; however, we observed a greater reduction in plasmin generation (3.11 ± 0.03 vs 1.30 ± 0.17 RFU/min2; n = 3, SEM, P = .0000) to 41.8% of the untreated control. Consistent with previous data from both endothelial cell and monocyte experiments, these data indicated that A2 supports more than half (58.2%) of plasmin generation on the surface of PBMCs.9,19,26,27
To compare the distribution of cell surface plasmin generation values across all experimental groups, we stratified rates of plasmin-generation values by percentile (Figure 1C). Interestingly, all samples that fell within the lowest 10th percentile for plasmin generation were from subjects who had experienced VTE (0% of HCs, 16.8% of all VTE subjects). In addition, low plasmin generation was more common among VTE subjects with an FH (24.4%) than among those without an FH (11.3%) and in those with an FH but without an identified IT (29.2%) than among those with an FH and a documented IT (14.3%). These data suggested that impaired tPA-dependent cell surface plasmin generation is most prevalent among VTE subjects with a positive FH but no previously identified IT.
To determine whether reduced cell surface plasmin generation might have an autoimmune origin as previously described,19,20 we screened plasma samples for the presence of autoantibodies to A2 or its binding partner, S100A10, by immunoblot. We found anti-A2 IgG in 1.7% of HCs (n = 60) and 1.1% of VTE subjects (n = 95). Similarly, anti-S100A10 autoantibodies were found in 3.3% of HCs and 0% of VTE subjects (Table 1). Together, these results indicated that the observed reduction in cell surface fibrinolysis in VTE subjects is not explained by autoantibodies to A2 or S100A10.
We next evaluated total annexin A2 protein expression by PBMCs (Figure 3). Using an antibody directed against a large region of the core domain of A2 (supplemental Figure 1, available on the Blood Web site), quantitative immunoblot analysis of PBMC lysates (supplemental Figure 2) revealed that A2 protein was significantly reduced in subjects with VTE (0.35 ± 0.04, n = 41, vs 0.62 ± 0.10, n = 19, SEM, P = .0452) (Figure 3A). We found that A2 protein expression was reduced regardless of whether the subjects were receiving anticoagulant therapy (Figure 2B). Mean expression of A2 protein in subjects with VTE and a positive FH but no known IT was even more dramatically reduced to 30% of the mean value for HCs (0.19 ± 0.05, n = 11, SEM vs 0.62 ± 0.10, n = 19, P = .0085) (Figure 3A). Mean A2 protein expression in VTE subjects with a positive FH and a previously identified IT did not differ significantly from that of HCs (0.66 ± 0.42, SEM, n = 5, P = .9998). A2 protein expression was significantly different from that for subjects with VTE, a positive FH, and a known IT when the 2 groups were compared using Student’s unpaired t test (P = .0003). When A2 protein expression for each group was stratified into percentile bins, 10.5% of HCs vs 37.2% of subjects with VTE had values in the lowest 10th percentile (Figure 3B). In addition, none of the 5 VTE subjects with a positive FH and ≥1 IT had low A2, whereas A2 in the lowest 10th percentile was found in 54.6% of VTE subjects with an FH and no previously identified IT. Together, these data suggested that VTE subjects with a positive FH, but without previously identified IT, exhibited the lowest levels of A2 protein.
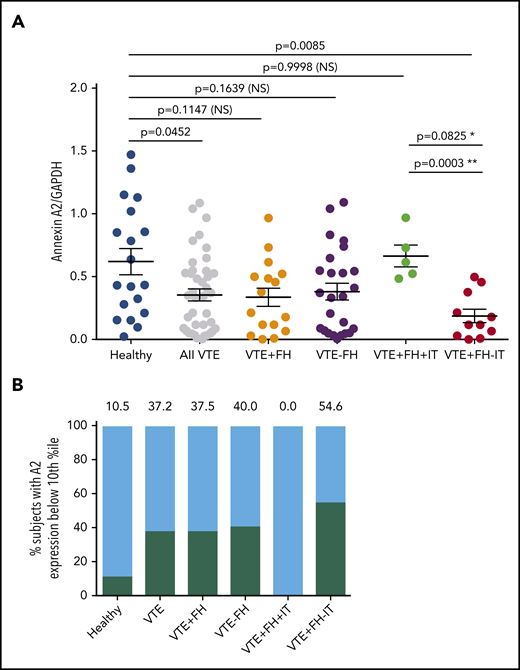
Annexin A2 protein expression in VTE. (A) A2 protein expression in VTE subgroups. Annexin A2 to GAPDH expression ratios are indicated for 19 HCs, 41 subjects with history of VTE, 16 subjects with VTE+FH, 25 subjects with VTE−FH, 5 subjects with VTE+FH+IT, and 11 subjects with VTE+FH−IT. Shown are individual values, mean ± SEM, and P values determined using 1-way ANOVA and Tukey’s post hoc test of significance. Asterisks (* and **) indicate statistical significance (by Tukey’s post hoc vs unpaired t test, respectively). (B) Stratification of annexin A2 expression values into decile bins. The percent of subjects with A2/GAPDH ratios in the lowest 10th-percentile for each group are depicted by black bars and numbers above each bar.
Annexin A2 protein expression in VTE. (A) A2 protein expression in VTE subgroups. Annexin A2 to GAPDH expression ratios are indicated for 19 HCs, 41 subjects with history of VTE, 16 subjects with VTE+FH, 25 subjects with VTE−FH, 5 subjects with VTE+FH+IT, and 11 subjects with VTE+FH−IT. Shown are individual values, mean ± SEM, and P values determined using 1-way ANOVA and Tukey’s post hoc test of significance. Asterisks (* and **) indicate statistical significance (by Tukey’s post hoc vs unpaired t test, respectively). (B) Stratification of annexin A2 expression values into decile bins. The percent of subjects with A2/GAPDH ratios in the lowest 10th-percentile for each group are depicted by black bars and numbers above each bar.
We performed immunoblots with several antibodies directed against A2 and related proteins in PBMC lysates from subjects with VTE as well as HCs (Figure 4). Using a monoclonal antibody recognizing most of the core domain (D123-D328) of A2, we noted that A2 protein expression was reduced in 5 VTE samples and somewhat reduced in 1 HC sample, whereas expression of GAPDH remained stable (Figure 4A-B). In 2 subjects with low A2, A5 was also reduced by immunoblot, suggesting the possibility of a multiannexin deficiency (Figure 4B). We obtained similar results with 2 additional antibodies, one recognizing a sequence immediately surrounding F307 in proximity to the presumptive C-terminal plasminogen-binding domain (K308-R309), and a third recognizing the N-terminal 14 residues encompassing the S100A10- and tPA-binding region (not shown). Interestingly, none of the 5 subjects with low A2 protein expression had a previously identified IT, and all but 1 had a positive FH. In samples where A2 protein expression was reduced, expression of S100A10 was also reduced, in agreement with our previous in vitro studies.28 We found no evidence of A2 proteolysis with any of the 3 antibodies but did note 2 molecular mass forms, most likely representing the 2 major isoforms of human A2.29 Taken together, these data suggest that reduced A2 levels may be associated with unexplained VTE.
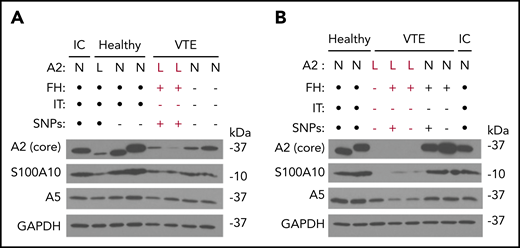
Epitope-specific immunoblotting. (A-B) Representative immunoblots depicting annexin A2, S100A10, annexin A5, and GAPDH expression in PBMCs. PBMC lysates from HCs as well as subjects with VTE and low (labeled in red) or normal A2 expression were probed with IgG directed against the core domain of A2, as well as IgGs directed against S100A10, GAPDH, and annexin A5. A sample from the same internal control (IC) was also examined in each blot. FH status, presence or absence of an IT, and presence or absence of the 5-SNP cluster are also indicated. Black dots indicate not tested. All results shown are representative of blots on samples collected on ≥2 separate occasions ≥3 months apart. L, low; N, normal.
Epitope-specific immunoblotting. (A-B) Representative immunoblots depicting annexin A2, S100A10, annexin A5, and GAPDH expression in PBMCs. PBMC lysates from HCs as well as subjects with VTE and low (labeled in red) or normal A2 expression were probed with IgG directed against the core domain of A2, as well as IgGs directed against S100A10, GAPDH, and annexin A5. A sample from the same internal control (IC) was also examined in each blot. FH status, presence or absence of an IT, and presence or absence of the 5-SNP cluster are also indicated. Black dots indicate not tested. All results shown are representative of blots on samples collected on ≥2 separate occasions ≥3 months apart. L, low; N, normal.
To explore potential causes of low A2 protein expression in individuals with VTE, we examined mRNA levels by quantitative RT-PCR (Figure 5). We found an overall 30% reduction in mRNA in VTE subjects with low A2 protein levels compared with HCs (1.05 ± 0.074 vs 0.72 ± 0.069 units, SEM, P = .0131), whereas VTE subjects with normal A2 had mean mRNA levels that were indistinguishable from the controls (1.05 ± 0.074 vs 0.90 ± 0.09, SEM, P = .3594; Figure 5A). We then isolated and sequenced ∼60 kb of genomic DNA, encompassing ∼10 kb of the 5′ UTR, all 13 exons and intervening sequences, and ∼1 kb of the 3′ UTR, from 6 HCs, 6 subjects with VTE and normal A2 protein expression, and 6 subjects with VTE and reduced A2 levels. Using 3 variant callers, 256 unique SNPs were detected across all 18 samples, none of which predicted changes in coding sequence. We identified a cluster of 5 SNPs in 4 of 6 samples from subjects with VTE and low A2 protein expression, as well as 1 HC, and 1 subject with VTE and normal A2 levels (supplemental Table), but the presence of the SNP cluster did not correlate significantly with low mRNA levels (0.933 ± 0.054 vs 0.868 ± 0.124, SEM, P = .5756; Figure 5B). These data suggested that reduced mRNA levels of indeterminant origin may explain lower expression of A2 protein in some individuals.
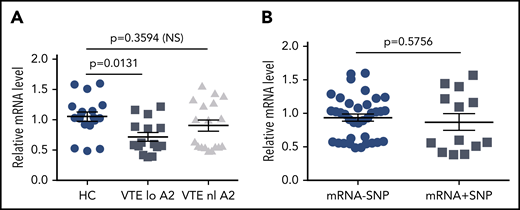
Relative annexin A2 mRNA levels. mRNA was isolated from PBMCs as described in “Methods” and analyzed by quantitative RT-PCR. (A) mRNA levels were stratified according to normal (n = 6) or low A2 protein expression (n = 5), defined as below the 10th percentile for all subjects, and compared with mRNA levels in HCs (n = 6). All samples were run in triplicate. (B) mRNA levels were stratified according to the presence or absence of the 5-SNP cluster. Shown in panels A and B are mean relative mRNA levels ± SEM.
Relative annexin A2 mRNA levels. mRNA was isolated from PBMCs as described in “Methods” and analyzed by quantitative RT-PCR. (A) mRNA levels were stratified according to normal (n = 6) or low A2 protein expression (n = 5), defined as below the 10th percentile for all subjects, and compared with mRNA levels in HCs (n = 6). All samples were run in triplicate. (B) mRNA levels were stratified according to the presence or absence of the 5-SNP cluster. Shown in panels A and B are mean relative mRNA levels ± SEM.
To ascertain whether there are relationships among plasma-based coagulation, fibrinolytic potential, and cell surface fibrinolysis in HCs and VTE patients, we performed plasma clotting time (CT) and CLT assays on samples from 73 HCs and 91 VTE subjects, 42 with and 49 without a positive FH. Mean CT was prolonged in the VTE and VTE with positive FH groups compared with HCs (1.42 ± 0.11 and 1.65 ± 0.20 vs 0.96 ± 0.08 minutes, SEM, P = .011-.001; supplemental Figure 3A), most likely due to anticoagulation therapy in 64% of VTE subjects (Figure 2D and Table 1). Mean plasma CLT was also prolonged in all VTE groups, regardless of FH, compared with HCs (37.6 ± 1.2, 37.0 ± 1.7, and 38.6 ± 1.8 minutes vs 30.7 ± 1.1, respectively, SEM, P = .0176-.0005; supplemental Figure 4A), as previously reported,6 but the prolongation in CLT did not correlate with anticoagulant therapy (Figure 2C). In addition, neither CT nor CLT showed any correlation with A2 protein or cell surface plasmin generation (supplemental Figures 3B-C and 4B-C).
Finally, we plotted the rate of cell surface plasmin generation vs the overall level of A2 protein in PBMCs isolated from HCs as well as from subjects with VTE (Figure 6). We noted that all subjects with VTE and a positive FH, but no evidence of IT (red dots), clustered in the low A2/low plasmin generation quadrant, whereas those with VTE, a positive FH, and known IT (green dots) had higher A2 levels and higher plasmin generation. HCs (blue dots) and VTE subjects without a positive FH (purple dots) were distributed throughout the plot. Interestingly, the identified 5-SNP cluster was associated with low A2 protein and low plasmin generation in 4 of the 6 sequenced subjects who had VTE, a positive FH, and no IT. We conclude that diminished A2 protein expression and reduced cell surface fibrinolysis may contribute to familial VTE in subjects without a previously identified thrombophilia.
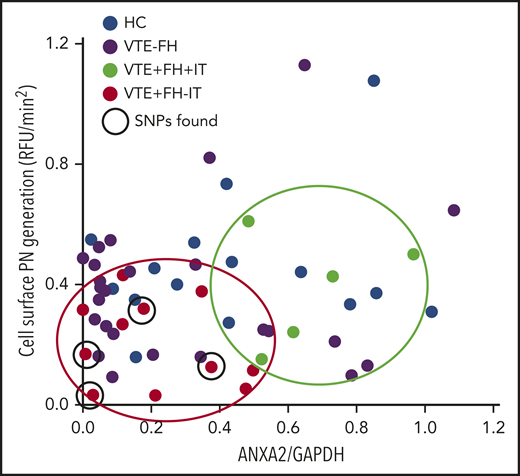
Relationship between A2 expression and plasmin generation. Plasmin-generating capacity (RFU/min2) is plotted against A2/GAPDH expression ratio. Samples from HCs (n = 15, blue dots), VTE with negative FH (VTE−FH, purple dots), VTE with a positive FH and an IT (VTE+FH+IT, green dots, enclosed in green oval), and VTE with a positive FH but no known IT (VTE+FH−IT, red dots, enclosed in red oval) are shown. Subjects testing positive for the 5-SNP cluster are indicated by solid black circles.
Relationship between A2 expression and plasmin generation. Plasmin-generating capacity (RFU/min2) is plotted against A2/GAPDH expression ratio. Samples from HCs (n = 15, blue dots), VTE with negative FH (VTE−FH, purple dots), VTE with a positive FH and an IT (VTE+FH+IT, green dots, enclosed in green oval), and VTE with a positive FH but no known IT (VTE+FH−IT, red dots, enclosed in red oval) are shown. Subjects testing positive for the 5-SNP cluster are indicated by solid black circles.
Discussion
In the United States, VTE is a leading cause of disability-adjusted life years lost in hospitalized patients.30 Approximately 10% to 20% of hospitalized patients develop VTE,31,32 and VTE may contribute to death in 7% to 13% of hospitalized patients.33,34 Despite its high prevalence, the exact etiology of VTE is often unclear. The prevalence of ITs differs significantly within healthy populations and in patients with VTE. FVL and the prothrombin G20210A heterozygote mutations are common among healthy whites, with a prevalence of 3% to 8% and 2.7% respectively. In contrast deficiencies of the natural anticoagulants are rare, with a prevalence of 0.02% to 0.04% for AT deficiency, 0.2% to 0.4% for PC deficiency, and 0.03% to 0.13% for PS deficiency. The frequency of these thrombophilias is between 2.3% to 20% and 4.3% to 40% in unselected and selected patients with VTE, respectively.35 Whereas numerous reports have highlighted the contribution of dysregulated coagulation, recent evidence suggests a role for dysfunctional plasma fibrinolysis.6 Indeed, we confirmed here an increase in plasma CLT in VTE subjects,6,36 which could not be explained by anticoagulant treatment, but could reflect increased levels of fibrinolytic inhibitors, such as plasminogen activator inhibitor-1 and thrombin activatable fibrinolysis inhibitor, which have been reported to be increased in populations with VTE6,37-39 and obesity.40-42
In this study, we show for the first time that cell surface plasmin generation is reduced in some subjects with VTE, especially those with a positive FH but no prior evidence of a known IT. We note, further, that expression of annexin A2, the cell surface fibrinolytic coreceptor for tPA and plasminogen, is also reduced in this cohort. We used PBMCs as a surrogate for endothelial cells, based on evidence that circulating mononuclear cells, like endothelial cells, rely upon A2 for ∼50% of their cell surface plasmin-generating capacity.9,19,26,27 While subjects with low A2 also had lower rates of cell surface plasmin generation, A2 protein levels did not correlate with plasma CTs or CLTs, indicating that the cell surface and plasma-based fibrinolytic systems are functionally independent.
Our analysis of cell surface fibrinolysis in a heterogeneous group of subjects with VTE revealed a surprising proportion (16.8%) with tPA-dependent plasmin generating capacity below the 10th percentile for the entire study population. In addition, only 37.3% (19/51) of those with a positive FH for VTE were found to have an established IT, suggesting that 62.7% in this cohort may have an as-yet-undiscovered cause of heritable VTE. Of those with a positive FH for VTE and no IT, mean cell surface plasmin generation was reduced by ∼50% compared with HCs (Figure 1A), and 29.2% in this subgroup had cell surface plasmin generation values below the 10th percentile. Low cell surface plasmin generation was not associated with anticoagulant therapy (Figure 2A) but could possibly reflect an as-yet-undefined inflammatory mechanism associated with increased adiposity in this group. These data suggest that diminished cell surface fibrinolysis may constitute a new risk factor for VTE.
Our assessment of A2 protein expression in VTE revealed a significantly low level in all VTE groups combined. This effect was due almost exclusively to the remarkably low level of A2 protein in the subgroup with a positive FH of VTE but no previously identified heritable risk factor (Figure 3A). Low A2 protein levels were not associated with anticoagulant therapy (Figure 2B) or with either of the 2 major A2 isoforms, Mr 39 000 and Mr 37 000 daltons,29 which were detected equally in HCs and VTE subjects. Furthermore, we observed no evidence of A2 proteolysis or truncation when we probed with 3 different antibodies directed at epitopes encompassing both tPA and plasminogen-binding sites and no evidence of A2 epitope masking by autoantibodies.
On the other hand, we did note that the mean mRNA level for individuals with VTE and low A2 protein expression was 30% lower than that for HCs or VTE subjects with normal A2 levels. In addition, we identified a cluster of 5 SNPs mainly in association with low levels of A2 protein (supplemental Table 1). This SNP cluster appears to be common in the general population, appearing in ∼10% of individuals in the HapMap or 1000 Genomes databases. Because the SNP cluster did not correlate with low mRNA levels, its potential effect on gene expression is unclear. Other potential explanations for low levels of mRNA could include errors in mRNA transcription or mRNA instability. In addition, faulty protein translation or an enhanced rate of protein degradation could lead to low A2 protein levels in those with normal mRNA levels. For those individuals who exhibited reduced cell surface plasmin generation with normal A2 protein expression, abnormalities in synthesis or stability of the A2 partner protein, S100A10, are possible. Moreover, functional defects in the thrombin-triggered pp60Src kinase system that phosphorylates A2 at Y23, enabling its translocation to the cell surface, could also impair A2-mediated cell surface fibrinolysis.27,43 Problems with other cell surface fibrinolytic receptors could also reduce generation of plasmin.25
While further studies are clearly warranted, we believe that our data may reveal an undiscovered mechanism of thrombophilia. Deficiency of annexin A2 and subsequently reduced cell surface fibrinolysis could contribute to VTE in a subset of subjects with unexplained thrombophilia. Screening for cell surface plasmin generation and annexin A2 protein could be of diagnostic value in some subjects. In addition, sequencing of the ANXA2 gene or targeted variant analysis in a larger cohort of subjects with unexplained thrombophilia could identify additional subjects with explanatory genomic changes. Knowledge of A2-related deficiency or dysfunction may provide the basis for targeted treatment, as suggested by recent studies in animal models.13-15
For original data, please contact khajjar@med.cornell.edu. Original data are available under DOI https://doi.org/10.5281/zenodo.4437540.
The online version of this article contains a data supplement.
The publication costs of this article were defrayed in part by page charge payment. Therefore, and solely to indicate this fact, this article is hereby marked “advertisement” in accordance with 18 USC section 1734.
Acknowledgments
The authors thank Ton Lisman and Anant K. Menon for technical advice; Dena Almeida for expert technical assistance; Lucy Skrabanek, Friederike Dundar, and Paul Zumbo for helpful discussions; and Ralph L. Nachman for his careful review of the manuscript.
This work was supported by the National Institutes of Health, National Heart, Lung, and Blood Institute (grant HL042493) (K.A.H.) and the National Center for Advancing Translational Science (grant UL1TR002384) (Weill Cornell Medicine).
Authorship
Contribution: H.F. performed experiments, analyzed data, and wrote the paper; M.R. developed the original experimental design, initiated the study, and performed experiments; H.C. and N.K. assisted with study design and performed assays; M.D. recruited subjects, provided study samples, and assisted with study design; all coauthors assisted with manuscript review; and K.A.H. analyzed the data and wrote the paper.
Conflict-of-interest disclosure: The authors declare no competing financial interests.
Correspondence: Katherine A. Hajjar, Department of Pediatrics, Weill Cornell Medicine, 1300 York Ave, Box 45, New York, NY 10065; e-mail: khajjar@med.cornell.edu.

This feature is available to Subscribers Only
Sign In or Create an Account Close Modal