

Key Points
Although BCL2 CNVs produce aberrant expression, MYC CNVs do not, and neither MYC nor BCL2 CNVs confer a similar biology as HGBL-DH/TH-BCL2.
MYC-N11S polymorphism is associated with false-negative IHC staining, a mechanism of IHC negativity in MYC rearranged tumors.

Abstract
When the World Health Organization defined high-grade B-cell lymphoma with MYC and BCL2 and/or BCL6 rearrangements (HGBL-DH/TH) as a clinical category, rearrangements were the only structural variant (SV) incorporated. An “atypical double-hit” category has been proposed, encompassing tumors with concurrent MYC and BCL2 SVs other than cooccurring translocations (ie, copy number variations [CNVs]). Although the identification of a gene expression signature (DHITsig) shared among tumors harboring MYC and BCL2 rearrangements (HGBL-DH/TH-BCL2) has confirmed a common underlying biology, the biological implication of MYC and BCL2 CNVs requires further elucidation. We performed a comprehensive analysis of MYC and BCL2 SVs, as determined by fluorescent in situ hybridization (FISH), in a cohort of 802 de novo tumors with diffuse large B-cell lymphoma morphology. Although BCL2 CNVs were associated with increased expression, MYC CNVs were not. Furthermore, MYC and BCL2 CNVs, in the context of atypical double-hit, did not confer a similar gene expression profile as HGBL-DH/TH-BCL2. Finally, although MYC immunohistochemistry (IHC) has been proposed as a screening tool for FISH testing, 2 mechanisms were observed that uncoupled MYC rearrangement from IHC positivity: (1) low MYC messenger RNA expression; and (2) false-negative IHC staining mediated by a single-nucleotide polymorphism resulting in an asparagine-to-serine substitution at the 11th amino acid residue of MYC (MYC-N11S). Taken together, these results support the current exclusion of MYC and BCL2 CNVs from HGBL-DH/TH and highlight the ability of a molecular-based classification system to identify tumors with shared biology that FISH and IHC fail to fully capture.
Introduction
Diffuse large B-cell lymphoma (DLBCL) is a heterogeneous neoplasm that accounts for 30% to 40% of newly diagnosed non-Hodgkin lymphomas.1 Approximately 50% to 60% of patients with DLBCL are cured by standard R-CHOP (rituximab, cyclophosphamide, doxorubicin, vincristine, and prednisone) immunochemotherapy.2,3 However, patients with DLBCL that progresses or relapses after frontline immunochemotherapy have poor outcomes, making the identification of this subgroup of patients, at the time of initial diagnosis, a major priority to improve outcomes. Initial efforts to stratify DLBCL patients into clinically relevant subgroups used gene expression profiling (GEP) to identify 2 major molecular subtypes of DLBCL corresponding to different putative cells-of-origin (COO): germinal center-B cell–like (GCB-DLBCL) and activated B cell–like (ABC-DLBCL).4,5 These molecular subtypes identify distinct biology, with activation of subtype-specific oncogenic programs as a result of different mutational landscapes.6-9 However, recent studies have identified unique genetic subgroups that extend beyond the binary COO division.10-13 Notably, these genetics-based classifications did not comprehensively incorporate structural variants (SVs) involving MYC, a key oncogene in aggressive B-cell lymphomas.
Tumors of DLBCL morphology with concurrent MYC and BCL2 rearrangements are generally associated with inferior outcomes.14,15 This has contributed to the establishment of a new category in the 2017 revision of the World Health Organization (WHO) classification for lymphoid neoplasms: high-grade B-cell lymphoma with MYC and BCL2 and/or BCL6 rearrangements (HGBL-DH/TH), colloquially referred to as double- and triple-hit lymphoma.1 The description of a gene expression signature (DHITsig) in HGBL-DH/TH tumors with BCL2 rearrangement (HGBL-DH/TH-BCL2) has supported the validity of this new WHO category by identifying a unified underlying biology among these tumors that extends beyond their often shared GCB origin.16 Interestingly, about half of DHITsig+ tumors do not display concurrent MYC and BCL2 rearrangements but share similar biology and outcomes. Although a portion of these tumors harbor rearrangements cryptic to fluorescent in situhybridization (FISH),17 other mechanisms leading to DHITsig+ require further exploration.
Copy number variations (CNVs) are another SV commonly associated with aberrant gene expression, offering a potential mechanism for DHITsig+ in the absence of gene rearrangements. However, the biological impact of these alterations remains unclear, as studies of MYC and BCL2 CNVs in DLBCL have primarily focused on outcome associations.18-24 As such, although the association of MYC and BCL2 rearrangements with increased protein expression has been well described,25-28 the impact of MYC and BCL2 CNVs on expression is less well known. Despite this uncertainty, the establishment of an “atypical double-hit” category has been proposed,22 encompassing all tumors with concurrent MYC and BCL2 SVs other than cooccurring translocations. Because the diagnosis of HGBL-DH/TH requires FISH testing for MYC rearrangement in all tumors of DLCBL morphology, which is a method that can also detect CNVs, such a classification could be integrated into clinical practice. However, whether atypical double-hit tumors share biology similar to HGBL-DH/TH-BCL2 requires further investigation.
Furthermore, an atypical double-hit entity would substantially increase the number of tumors in which subsequent FISH for BCL2 SVs is required. Because routine FISH testing is already challenging where clinical pathology resources are constrained, the association of MYC rearrangement with increased protein expression has provided a potential avenue to screen tumors for subsequent FISH testing. However, ∼25% of tumors with MYC rearrangement are negative for MYC protein expression according to immunohistochemistry (IHC) (universally performed by using the Y69 antibody)29 using a threshold of ≥40% tumor cell staining.28 Because the study of MYC rearrangement with increased expression has largely been limited to IHC, it is unknown if the lack of detectable protein expression is due to low MYC expression or other mechanisms specific to IHC.
Here, we performed a comprehensive analysis of the association of MYC and BCL2 SVs (rearrangement and CNVs), as determined by FISH, with expression at the messenger RNA (mRNA) and protein level in a cohort of 802 de novo tumors with DLBCL morphology. Using this approach, we assessed the biological impact of MYC and BCL2 CNVs and elucidated mechanisms of IHC negativity in MYC rearranged tumors.
Methods
Patient cohort
The study cohort consisted of 802 tumors with DLBCL morphology, as determined by central pathology review. The tumors represent all those with available GEP data in 3 cohorts drawn from a population-based registry of patients diagnosed and treated in British Columbia, Canada. Full inclusion and exclusion criteria are provided in the supplemental Methods (available on the Blood Web site). In brief, the study materials comprised diagnostic biopsy samples from adult patients with de novo DLBCL, excluding posttransplant lymphoproliferative disorders, primary mediastinal B-cell lymphoma, patients with central nervous system involvement, and those known to have a history of indolent lymphoma or HIV infection. This study was approved by the University of British Columbia/BC Cancer Research Ethics Board, in accordance with the Declaration of Helsinki.
FISH and IHC analyses
FISH was performed on formalin-fixed paraffin-embedded (FFPE) biopsy specimens using commercially available break-apart probes (supplemental Table 1). Tumors displaying break-apart signals in ≥5% of cells were considered to harbor a rearrangement. Gain was defined as 3 to 4 fused signals in ≥25% of cells; high-level gain was defined as ≥5 signals in ≥10% of cells.22 Genes that were rearranged with increased copy number were included only in the rearranged group. Tumors with amplification (defined by uncountable signals) were placed in their own category, irrespective of break-apart status. IHC staining was performed for MYC (Y69, Epitomics) and BCL2 (BCL2/124, Dako; and E17, Epitomics) on the BenchMark XT platform (Ventana). Thresholds of ≥40% and ≥50% of tumor cell staining were used to define positivity for MYC and BCL2, respectively.26
GEP and molecular subtyping
Digital GEP was performed on total RNA extracted from FFPE material by using the DLBCL90 assay on the nCounter platform (NanoString) to determine MYC and BCL2 mRNA expression levels and assign COO and DHITsig status, as previously described.16 Tumors were classified into molecular subtypes, with DHITsig+ taking precedence over COO (supplemental Figure 1A). Tumors classified as DHITsig-indeterminate were included in the DHITsig+ subtype (supplemental Methods).
MYC mutation analysis
To determine potential mechanisms for unexplained MYC IHC negativity, MYC sequencing data from 446 tumors were analyzed. Mutational data for 325 tumors were generated based on deep targeted sequencing using the TruSeq Custom Amplicon assay.30 The remainder were sequenced by using Agilent SureSelect custom hybrid capture assays.31,32 Further details are given in the supplemental Material.
Modeling the N11S variant
The N11S variant was incorporated into the MYC locus of DOHH-2 and Karpas-422 cell lines using CRISPR/Cas9. Incorporation of the N11S variant was validated by Sanger sequencing, and the allelic frequency was determined by using a droplet digital polymerase chain reaction mutation detection assay. Wild-type (WT) controls were expanded from single cells under the same experimental conditions.
Western blots were performed on cell lysates using the Y69 and 9E10 antibodies. For IHC, cell lines were formalin-fixed and paraffin-embedded, and IHC was performed by using the Y69 antibody. Further information, as well as details on further studies of the N11S variant in additional cell lines, is available in the supplemental Methods.
Statistical analyses
Comparisons between mRNA expression levels were performed by using 2-sided Student t tests with adjustment for multiple testing using the Holm-Bonferroni method. Odds ratios and associated significance of protein expression and DHITsig+ expression within subgroups were determined by univariable logistic regression. All statistical analyses were performed by using R 4.0.0 software (R Foundation for Statistical Computing).
Results
Genetic and IHC analysis of MYC and BCL2 was performed on 802 de novo tumors of DLBCL morphology drawn from 3 population-based cohorts (supplemental Figure 2). Clinical characteristics are shown in Table 1.
Demographic and clinical characteristics of study cohorts
| Characteristic | Total cohort (n = 802) | CCSRI cohort (n = 497*) | DLC347 cohort (n = 325*) | GPH cohort (n = 175) |
|---|---|---|---|---|
| Treatment | ||||
| R-CHOP/R-CHOP–like | 722 (90) | 435 (88) | 325 (100) | 157 (90) |
| Intensive | 11 (1) | 1 (0) | — | 10 (6) |
| Palliative | 23 (3) | 17 (3) | — | 6 (3) |
| Other | 13 (2) | 13 (3) | — | — |
| Unknown | 29 (4) | 29 (6) | — | — |
| Refused | 4 (0) | 2 (0) | — | 2 (1) |
| Age, y | ||||
| Median (range) | 66 (19-96) | 68 (20-96) | 64 (19-92) | 65 (19-93) |
| ≤60 | 272 (34) | 161 (32) | 133 (41) | 56 (32) |
| >60 | 530 (66) | 336 (68) | 192 (59) | 119 (68) |
| Sex, no. (%) | ||||
| Male | 485 (60) | 288 (58) | 207 (64) | 110 (63) |
| Female | 317 (40) | 209 (42) | 118 (36) | 65 (37) |
| Stage, no. (%) | ||||
| I/II | 181 (24) | 118 (25) | 81 (25) | 38 (22) |
| III/IV | 585 (76) | 345 (75) | 244 (75) | 135 (78) |
| Missing | 36 | 34 | — | 2 |
| LDH, no. (%) | ||||
| Normal | 375 (52) | 217 (52) | 146 (47) | 100 (57) |
| Above the ULN | 342 (48) | 200 (48) | 162 (53) | 75 (43) |
| Missing | 85 | 80 | 17 | — |
| ECOG PS, no. (%) | ||||
| 0-1 | 476 (63) | 290 (64) | 217 (67) | 102 (58) |
| 2-4 | 281 (37) | 162 (36) | 108 (33) | 73 (42) |
| Missing | 45 | 45 | — | — |
| Extranodal sites, no. (%) | ||||
| 0-1 | 655 (82) | 413 (83) | 278 (86) | 134 (77) |
| ≥2 | 147 (18) | 84 (17) | 47 (14) | 41 (23) |
| IPI score, no. (%) | ||||
| Low (0-1) | 230 (31) | 141 (33) | 103 (33) | 51 (29) |
| Intermediate (2-3) | 351 (48) | 209 (48) | 153 (48) | 79 (45) |
| High (4-5) | 152 (21) | 81 (19) | 60 (19) | 45 (26) |
| Missing | 68 | 66 | 9 | — |
ECOG PS, Eastern Cooperate Oncology Group performance status; IPI, International Prognostic Index; LDH, lactate dehydrogenase; R-CHOP, rituximab, cyclophosphamide, doxorubicin, vincristine, and prednisone; ULN, upper level of normal.
Overlap between CCSRI and DLC347 cohorts (n = 195).
Association of MYC and BCL2 SVs with mRNA and protein expression
Identification of MYC and BCL2 SVs by FISH was interpretable in 771 and 740 tumors, respectively. MYC gain (MYCGain; defined as 3-4 copies) was the most frequent MYC SV, detected in 20% (152 of 771) of tumors, whereas MYC rearrangement (MYCTr) and high-level MYC gain (MYCGain+; defined as ≥5 copies) were detected in 13% (104 of 771) and 4% (30 of 771) of tumors. In contrast, BCL2Tr was the most frequent BCL2 SV, detected in 28% (206 of 740) of tumors; BCL2Gain and BCL2Gain+ were detected in 21% (155 of 740) and 8% (56 of 740) of tumors.
To determine the significance of MYC and BCL2 SVs, the association of these alterations with mRNA and protein expression was examined compared with expression levels in tumors lacking SVs (Figure 1). MYC and BCL2 mRNA expression was assessed according to GEP in all tumors, whereas dichotomous levels of MYC and BCL2 protein expression were determined by IHC in 709 and 769 tumors, using thresholds of ≥40% and ≥50% cell staining to define positivity, respectively. Both MYCTr and BCL2Tr were strongly associated with increased mRNA and protein expression (P < .0001). In contrast, MYC and BCL2 CNVs were observed to have different effects. Both BCL2Gain and BCL2Gain+ were strongly associated with increased mRNA and protein expression (P < .0001), with BCL2Gain+ conferring similar mRNA levels as BCL2Tr. In contrast, MYCGain and MYCGain+ were not associated with increased mRNA (P = .95 and P = .78) or protein (P = .21 and P = .18) expression. Notably, no increase in mRNA expression was seen even in tumors with >7 copies of MYC (P = .79) (Figure 2). Taken together, although rearrangements of both MYC and BCL2 are associated with deregulated expression, only CNVs of BCL2 produced aberrant expression.
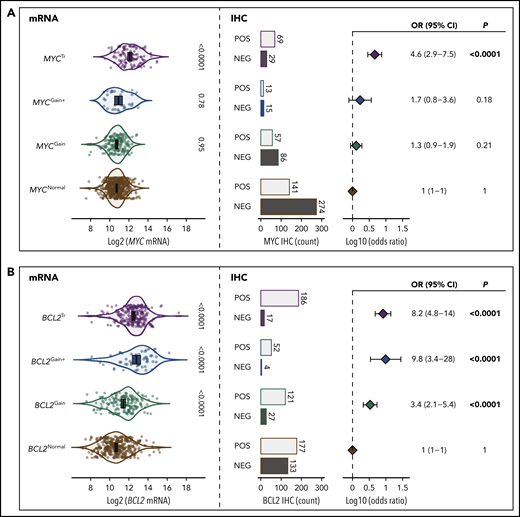
The role of MYC and BCL2 SVs in deregulation of mRNA and protein expression. (A) Association of MYC SVs with MYC mRNA and protein expression. (B) Association of BCL2 SVs with BCL2 mRNA and protein expression. The violin plots on the left show the association of mRNA expression levels with each SV. Error bars show the mean and 95% confidence intervals (CIs). On the right, the proportions of tumors that are positive (POS) or negative (NEG) according to IHC are shown along with forest plots indicating the association of each SV with IHC positivity (odds ratios with 95% CIs). All comparisons were made in reference to the normal group.
The role of MYC and BCL2 SVs in deregulation of mRNA and protein expression. (A) Association of MYC SVs with MYC mRNA and protein expression. (B) Association of BCL2 SVs with BCL2 mRNA and protein expression. The violin plots on the left show the association of mRNA expression levels with each SV. Error bars show the mean and 95% confidence intervals (CIs). On the right, the proportions of tumors that are positive (POS) or negative (NEG) according to IHC are shown along with forest plots indicating the association of each SV with IHC positivity (odds ratios with 95% CIs). All comparisons were made in reference to the normal group.

Association of MYC amplification and high-level copy number gains with MYC mRNA expression. The violin plots show MYC mRNA expression levels for tumors within each category. Tumors with MYC high-level gains are separated into subgroups with either 5 to 7 copies or >7 copies. Amplification (Amp) refers to tumors with uncountable copies of MYC. All comparisons were made in reference to the normal group. MYCTr is shown for reference. Error bars show the mean and 95% confidence intervals.
Association of MYC amplification and high-level copy number gains with MYC mRNA expression. The violin plots show MYC mRNA expression levels for tumors within each category. Tumors with MYC high-level gains are separated into subgroups with either 5 to 7 copies or >7 copies. Amplification (Amp) refers to tumors with uncountable copies of MYC. All comparisons were made in reference to the normal group. MYCTr is shown for reference. Error bars show the mean and 95% confidence intervals.
Of note, amplification of MYC (MYCAmp; defined by uncountable signals) was observed in 4 tumors and was associated with elevated MYC mRNA expression levels (P = .04), with all tumors displaying levels of expression comparable to MYCTr (Figure 2). Although only 1 tumor displayed amplification without a break-apart pattern (supplemental Figure 3), due to the rarity and limited understanding of MYCAmp, these tumors were excluded from other FISH subgroups.33
Mechanisms of MYC and BCL2 deregulation within molecular subtypes
The increase in expression associated with MYC and BCL2 rearrangements and BCL2 CNVs was observed across all molecular subtypes (supplemental Figure 4). However, some alterations failed to reach significance due to low incidence within specific subtypes. To determine the role of SVs within each molecular subtype, the subtype-specific frequency of MYC and BCL2 SVs was explored.
In total, 155 tumors were classified as DHITsig+, including 88% (46 of 52) of HGBL-DH/TH-BCL2 tumors. Highest expression levels of both MYC and BCL2 were observed in DHITsig+ tumors (supplemental Figure 5). MYCTr and BCL2Tr were the only SVs frequently observed in the DHITsig+ subtype, detected in 49% (74 of 151) and 67% (97 of 144) of tumors, and were both associated with increased levels of expression (Figure 3; supplemental Figure 4A-B).

Mechanisms of MYC and BCL2 deregulation within molecular subtypes. (A) Mechanisms of MYC deregulation within molecular subtypes. (B) Mechanisms of BCL2 deregulation within molecular subtypes. Tumors are arranged from lowest to highest mRNA expression within each subtype, and mRNA expression levels are shown relative to the full cohort as log2(Z scores). The vertical dotted black lines indicate the mean expression of MYC or BCL2 within the full cohort. Ticks represent tumors with the indicated SVs, and their proportional distribution within each subtype is represented by curves relative to mRNA expression levels. Ticks on the right side of the vertical dotted black line represent tumors with mRNA expression levels above the cohort mean; ticks on the left represent tumors with mRNA expression levels below the cohort mean. The distributions of IHC-positive and IHC-negative tumors are also shown relative to mRNA expression levels.
Mechanisms of MYC and BCL2 deregulation within molecular subtypes. (A) Mechanisms of MYC deregulation within molecular subtypes. (B) Mechanisms of BCL2 deregulation within molecular subtypes. Tumors are arranged from lowest to highest mRNA expression within each subtype, and mRNA expression levels are shown relative to the full cohort as log2(Z scores). The vertical dotted black lines indicate the mean expression of MYC or BCL2 within the full cohort. Ticks represent tumors with the indicated SVs, and their proportional distribution within each subtype is represented by curves relative to mRNA expression levels. Ticks on the right side of the vertical dotted black line represent tumors with mRNA expression levels above the cohort mean; ticks on the left represent tumors with mRNA expression levels below the cohort mean. The distributions of IHC-positive and IHC-negative tumors are also shown relative to mRNA expression levels.
HGBL-DH/TH-BCL2 tumors are primarily of GCB COO.28 In agreement, 90% (139 of 155) of DHITsig+ tumors had a GCB COO (supplemental Figure 1B). After the exclusion of DHITsig+ tumors from the GCB subgroup (the following text refers to GCB-DLBCL as DHITsig– by definition), MYCTr was observed in only 4% (11 of 274) of GCB-DLBCLs and was not significantly associated with increased expression (Figure 3A; supplemental Figure 4A). Furthermore, MYC mRNA expression levels in MYCTr GCB-DLBCLs were significantly lower than those observed in MYCTr DHITsig+ tumors (P = .02) (supplemental Figure 6). In general, MYC expression levels were lowest in GCB-DLBCL (supplemental Figure 5), with 77% (210 of 274) of GCB-DLBCLs expressing MYC at levels below the cohort mean (Figure 3A). In contrast, BCL2Tr was observed in 30% (81 of 266) of GCB-DLBCLs and was strongly associated with increased expression (Figure 3B; supplemental Figure 4B). Thus, although MYC overexpression was not a common feature of GCB-DLBCL, inappropriate BCL2 expression, achieved through translocation, is a feature of a subset of these tumors.
Although ABC-DLBCLs expressed higher levels of MYC compared with GCB-DLBCL, no MYC SVs associated with increased expression were observed at an appreciable frequency in ABC tumors (Figure 3A), suggesting that alternative mechanisms drive MYC expression in ABC-DLBCL. In agreement, MYC expression in the absence of SVs was highest in ABC-DLBCL (supplemental Figure 7A). Although BCL2 expression in the absence of SVs was similarly highest in ABC-DLBCL (supplemental Figure 7B), BCL2 CNVs were frequently observed in ABC tumors and were associated with a further increase in expression (Figure 3B; supplemental Figure 4B). This increase was apparent for both BCL2Gain and BCL2Gain+, which were detected in 38% (96 of 253) and 13% (34 of 253) of ABC-DLBCLs, respectively. Therefore, although both MYC and BCL2 seem to be elevated in ABC tumors by alternative mechanisms, BCL2 CNVs further contribute to deregulated expression, whereas MYC CNVs do not.
Role of MYC and BCL2 CNVs in contributing to HGBL-DH/TH-BCL2 biology
A strong association between DHITsig score and HGBL-DH/TH-BCL2 was observed, with an area under the curve of the receiver-operator characteristic curve of 0.93 (supplemental Figure 8). Therefore, DHITsig+ was used as a surrogate for HGBL-DH/TH-BCL2 biology to assess whether atypical double-hit tumors share biology similar to that of HGBL-DH/TH-BCL2.
Concurrent MYC and BCL2 CNVs (MYCCNV/BCL2CNV) were observed in 12% (88 of 733) of tumors, whereas MYCCNV/BCL2Tr and BCL2CNV/MYCTr were observed in 8% (55 of 733) and 2% (14 of 733) of tumors, respectively. Only 3% (3 of 88) of MYCCNV/BCL2CNV tumors were DHITsig+ (Figure 4A), suggesting that CNVs alone are insufficient to produce HGBL-DH/TH-BCL2 biology. Although CNVs in the context of a coexisting translocation were more likely to belong to the DHITsig+ subtype, the rarity of these events prevented discernment of whether this observation could be attributed to the rearranged locus alone. Although 67% (6 of 9) of MYCTr/BCL2Gain tumors and 80% (4 of 5) of MYCTr/BCL2Gain+ tumors were DHITsig+, these tumors were not significantly more likely to belong to the DHITsig+ subtype than tumors harboring MYCTr alone (MYCTr/BCL2Normal), wherein 45% (15 of 33) were DHITsig+ (P = .27 and P = .18) (Figure 4B). Although this analysis is limited by the rarity of MYCTr/BCL2CNV, these tumors were also distinct from other DHITsig+ tumors in that they tended to display a higher COO linear predictor score (P < .0001) (supplemental Figure 9), consistent with the observed association of BCL2 CNVs with ABC-DLBCL.
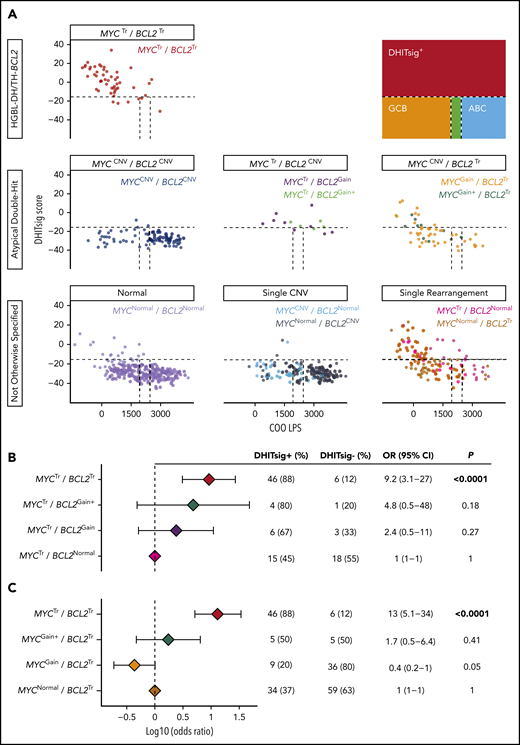
Atypical double-hit tumors do not share a similar GEP as HGBL-DH/TH-BCL2 tumors. (A) DHITsig score and COO linear predictor score are shown for HGBL-DH/TH-BCL2, atypical double-hit, and not otherwise specified tumors. Dotted lines indicate cutoffs between molecular subtype classifications as shown in the figure key. Forest plots show the odds ratios with 95% confidence intervals of belonging to the DHITsig+ subtype for each indicated subgroup of atypical double-hit tumors compared with tumors with MYC rearrangement alone (MYCTr/BCL2Normal) (B) or BCL2 rearrangement alone (MYCNormal/BCL2Tr) (C).
Atypical double-hit tumors do not share a similar GEP as HGBL-DH/TH-BCL2 tumors. (A) DHITsig score and COO linear predictor score are shown for HGBL-DH/TH-BCL2, atypical double-hit, and not otherwise specified tumors. Dotted lines indicate cutoffs between molecular subtype classifications as shown in the figure key. Forest plots show the odds ratios with 95% confidence intervals of belonging to the DHITsig+ subtype for each indicated subgroup of atypical double-hit tumors compared with tumors with MYC rearrangement alone (MYCTr/BCL2Normal) (B) or BCL2 rearrangement alone (MYCNormal/BCL2Tr) (C).
In agreement with the lack of an mRNA correlate for MYCGain, BCL2Tr/MYCGain was not associated with DHITsig+. Although 37% (34 of 93) of tumors with BCL2Tr alone (BCL2Tr/MYCNormal) were DHITsig+, only 20% (9 of 45) of BCL2Tr/MYCGain tumors belonged to the DHITsig+ subtype. Despite BCL2Tr/MYCGain+ tumors more frequently being DHITsig+ (50% [5 of 10]), they were similarly not significantly more likely to be classified as DHITsig+ than tumors harboring BCL2Tr alone (P = .41) (Figure 4C). Of note, all tumors with amplification of MYC were DHITsig+.
Mechanisms of discordance between MYC mRNA and detectable protein
Similar to previous reports,28 30% (29 of 98) of MYCTr tumors were negative for MYC protein according to IHC (<40% cell staining). IHC positivity was strongly associated with increased levels of MYC mRNA expression (P < .0001) (supplemental Figure 10). Notably, of the 11 MYCTr tumors with mRNA expression levels below the cohort mean, 82% (9 of 11) were negative for MYC IHC, providing one mechanism of MYC IHC negativity in MYCTr tumors.
To determine a potential mechanism for IHC negativity in MYCTr tumors with high mRNA expression levels, MYC sequencing data for 446 tumors were analyzed. Four of the five highest mRNA-expressing MYCTr tumors that were negative for MYC IHC harbored mutations in exon 2 of MYC. Interestingly, 3 of these tumors carried a single nucleotide polymorphism resulting in an asparagine-to-serine substitution at the 11th amino acid residue of MYC (MYC-N11S), whereas the fourth tumor had mutations affecting nearby residues (T8I and L14V). In total, the MYC-N11S variant was observed in five MYCTr tumors, with 4 of 5 negative for MYC protein expression (Figure 5A).
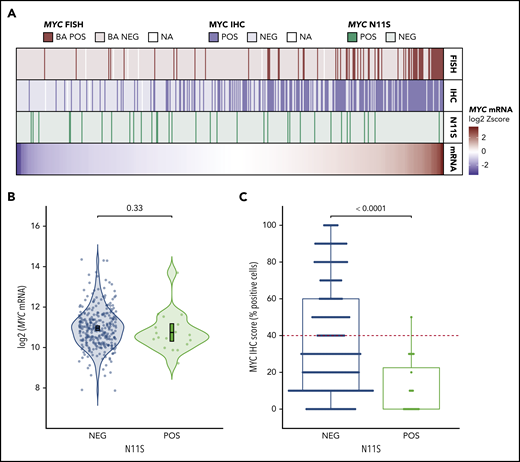
MYC-N11S polymorphism is associated with decreased MYC protein expression as detected by IHC using the Y69 antibody. (A) MYC mRNA expression is shown in the bottom track as a heatmap for the 446 tumors in which MYC sequencing data were available. Tumors are linearly arranged from lowest to highest expression, and the corresponding N11S status, MYC IHC status, and MYC rearrangement status for each tumor are shown in the tracks above the heatmap. Break-apart positive (BA POS) refers to tumors positive for MYC rearrangement (MYCTr). (B) Expression of MYC mRNA in N11S-positive (POS) and N11S-negative (NEG) tumors. P value was determined by an unpaired 2-sided Student t test. Error bars represent the mean and 95% confidence intervals. (C) Percentage of tumor cells positive for MYC IHC staining in N11S POS and NEG tumors. The red dotted line indicates the ≥40% threshold used to identify MYC IHC positivity. The P value was determined by using the Mann-Whitney U test. Only tumors with IHC scores on a 10% increment scale of percent positively stained cells are included in B and C (n = 323).
MYC-N11S polymorphism is associated with decreased MYC protein expression as detected by IHC using the Y69 antibody. (A) MYC mRNA expression is shown in the bottom track as a heatmap for the 446 tumors in which MYC sequencing data were available. Tumors are linearly arranged from lowest to highest expression, and the corresponding N11S status, MYC IHC status, and MYC rearrangement status for each tumor are shown in the tracks above the heatmap. Break-apart positive (BA POS) refers to tumors positive for MYC rearrangement (MYCTr). (B) Expression of MYC mRNA in N11S-positive (POS) and N11S-negative (NEG) tumors. P value was determined by an unpaired 2-sided Student t test. Error bars represent the mean and 95% confidence intervals. (C) Percentage of tumor cells positive for MYC IHC staining in N11S POS and NEG tumors. The red dotted line indicates the ≥40% threshold used to identify MYC IHC positivity. The P value was determined by using the Mann-Whitney U test. Only tumors with IHC scores on a 10% increment scale of percent positively stained cells are included in B and C (n = 323).
Among all sequenced tumors, 7.6% (34 of 446) harbored the N11S variant, and 91% (30 of 33) were negative for MYC protein expression, as detected by IHC using the Y69 antibody (Figure 5A). Analysis of MYC mRNA expression revealed no significant difference between N11S-positive and N11S-negative tumors (P = .33) (Figure 5B; supplemental Figure 11). In contrast, tumors positive for the N11S variant showed significantly reduced MYC IHC staining (P < .0001) (Figure 5C). Interestingly, the Y69 antibody is known to bind within the N terminus of MYC,34 suggesting that the association of the N11S variant with reduced protein detection may be due to disrupted binding of the Y69 antibody.
N11S-mediated disruption of the Y69 epitope leads to false-negative MYC IHC staining
To determine if the N11S variant disrupts binding of the Y69 antibody, MYC-N11S was modeled in the MYC rearranged DLBCL cell line DOHH-2 using CRISPR/Cas9. Both heterozygous and homozygous mutants were produced in replicate (supplemental Figure 12A). Importantly, all cell lines expressed comparable levels of MYC mRNA (supplemental Figure 12C), and there was no difference in proliferation across N11S and WT cell lines (P = .59) (supplemental Figure 13), a process regulated by MYC.35 Western blots using the Y69 antibody detected significantly reduced levels of MYC in N11S cell lines compared with WT (Figure 6A-B). In contrast, nearly equivalent levels of MYC were detected between N11S and WT cell lines using the 9E10 antibody, which binds to a different region of MYC.36 This finding was verified in HEK-293T cells overexpressing WT or N11S MYC (supplemental Figure 14). Taken together, these results suggest that the N11S variant disrupts Y69 binding, leading to a reduction in detectable protein.
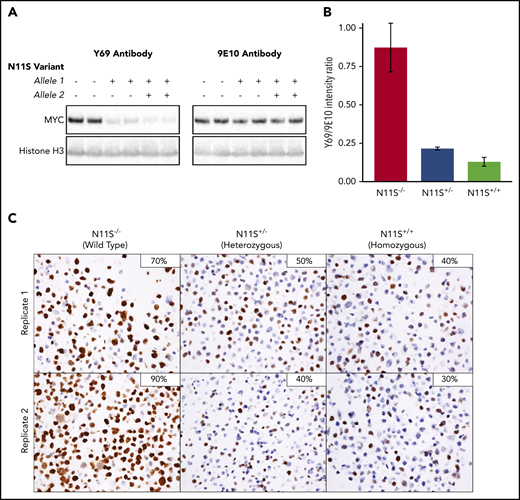
MYC-N11S polymorphism leads to disruption of the Y69 binding and reduced IHC staining. The N11S variant was modeled in DOHH-2 cells using CRISPR/Cas9. N11S−/− refers to WT cell lines, whereas N11S+/− and N11S+/+ refer to cell lines heterozygous and homozygous for the N11S variant, respectively. (A) Western blotting for MYC was performed on whole-cell extracts of N11S and WT DOHH-2 cells using the Y69 and 9E10 antibodies. Histone H3 was used as a loading control. (B) Ratio of protein detected by western blotting using the Y69 and 9E10 antibodies, normalized for loading. Error bars indicate standard error. (C) MYC IHC using the Y69 antibody on FFPE section from N11S and WT DOHH-2 cell lines (40× objective lens). The percentage of positively stained cells for each whole section is shown in the upper right corner of the images.
MYC-N11S polymorphism leads to disruption of the Y69 binding and reduced IHC staining. The N11S variant was modeled in DOHH-2 cells using CRISPR/Cas9. N11S−/− refers to WT cell lines, whereas N11S+/− and N11S+/+ refer to cell lines heterozygous and homozygous for the N11S variant, respectively. (A) Western blotting for MYC was performed on whole-cell extracts of N11S and WT DOHH-2 cells using the Y69 and 9E10 antibodies. Histone H3 was used as a loading control. (B) Ratio of protein detected by western blotting using the Y69 and 9E10 antibodies, normalized for loading. Error bars indicate standard error. (C) MYC IHC using the Y69 antibody on FFPE section from N11S and WT DOHH-2 cell lines (40× objective lens). The percentage of positively stained cells for each whole section is shown in the upper right corner of the images.
To assess the impact of MYC-N11S in a routine clinical setting, MYC IHC was performed on FFPE sections of N11S cell lines. A significant reduction in the proportion of stained cells was observed in N11S cell lines (30%-50% staining) compared with WT cell lines (70%-90% staining), with heterozygous and homozygous cell lines showing comparable levels of staining (Figure 6C). The lack of a difference in staining between heterozygous and homozygous cell lines was explained by the predominant expression of the N11S variant in heterozygous cells (supplemental Figure 12B), suggesting incorporation of the N11S variant on the translocated allele. Interestingly, MYC-N11S was also observed in the MYCTr DLBCL cell lines WSU-DLCL2 and SU-DHL-10. Expression of the N11S variant was only seen in WSU-DLCL2, which was correspondingly MYC IHC negative, whereas SU-DHL-10 expressed the WT allele and was positive for MYC IHC (supplemental Figure 15). The presence of the N11S variant on the nontranslocated allele of SU-DHL-10 was confirmed by linked-read sequencing (data not shown).
Because most N11S positive tumors do not harbor MYCTr, the N11S variant was modeled in Karpas-422 cells, which lack MYCTr. In contrast to DOHH-2 cell lines, no apparent difference in MYC staining was observed between WT (70%-90% staining) and heterozygous (70%-80% staining) cell lines (supplemental Figure 16). Importantly, equal expression was observed from the WT and N11S allele (supplemental Figure 12B). Because Karpas-422 WT cells are strongly positive for MYC IHC staining, it is likely that very high levels of biallelic MYC expression can overcome the attenuating effect of the N11S variant.
Discussion
We provide a comprehensive analysis of the impact of MYC and BCL2 SVs, as detected by FISH, on expression at the mRNA and protein level in 802 de novo tumors of DLBCL morphology. Consistent with previous reports,25-28 MYCTr and BCL2Tr were both strongly associated with increased expression. In contrast, although BCL2 CNVs were strongly associated with increased expression, MYC CNVs were not.
MYC expression in normal B-cell differentiation is tightly regulated, with transient expression observed immediately before germinal center (GC) formation following interaction with cognate T cells and in a small subset of centrocytes in the GC light zone undergoing cyclic reentry into the dark zone.37,38 Most DLBCL tumors display a GEP corresponding to a light zone COO, a cell not expected to express MYC.39 Tumors with MYCTr circumvent this regulation by placing MYC under the control of regulatory elements of genes that are transcriptionally active in the GC, such as immunoglobulin loci.40-42 In contrast, although focal MYC CNVs have been reported, most affect a larger region, likely retaining the native MYC regulatory elements.17,43,44 We therefore postulate that transcriptional regulation of MYC is maintained in the majority of DLBCL tumors harboring MYC CNVs, explaining the lack of impact on expression. Of note, although this study was restricted to FISH due to its use in clinical practice, this observation highlights the need for further studies using methodologies with greater resolution to fully elucidate the spectrum of MYC CNVs and their associated significance. Such methods could additionally account for the confounding effects of cryptic translocations.17,45,46
Distinct features of MYC expression were observed across molecular subtypes. MYCTr was the only SV associated with increased expression and was almost exclusively observed in DHITsig+ tumors. With removal of DHITsig+ tumors from the GCB subtype, deregulation of MYC was absent from the majority of remaining GCB tumors, suggesting that MYC deregulation is not a fundamental feature of GCB-DLBCL biology. In contrast, MYC expression was slightly elevated in ABC-DLBCL in the absence of SVs, suggesting that alternative mechanisms may contribute to MYC deregulation, such as NF-κB activation.47,48
Distinct mechanisms of BCL2 deregulation were also observed across molecular subtypes. Rearrangement of BCL2 was predominantly a feature of DHITsig+ tumors, although also observed in a portion of GCB-DLBCLs. In contrast, deregulation of BCL2 expression by CNVs was predominantly a feature of ABC-DLBCL. Of note, BCL2 expression in ABC-DLBCL was also elevated in the absence of BCL2 SVs, likely also due to NF-κB activation.25,49
When the WHO defined HGBL-DH/TH, the relevant SVs were limited to rearrangements, with ongoing uncertainty about the biological and clinical impact of CNVs.1 Studies examining the clinical impact of CNVs have raised the possibility of an “atypical double-hit” category. Although outcome associations are essential for identifying patients with an unmet clinical need, these associations are intrinsically linked to current treatment strategies. To accommodate the changing landscape and evolution of DLBCL treatment strategies, a classification entity should encompass tumors that share a similar underlying biology. As such, although HGBL-DH/TH encompasses tumors harboring concurrent MYC and BCL6 rearrangement, analysis of BCL6 was not included in this study because the biology of these tumors is distinct from that of HGBL-DH/TH-BCL2.16 In contrast, the shared biology among HGBL-DH/TH-BCL2 tumors has been shown by a common gene expression pattern (DHITsig+) shared among these tumors. Of interest, although the DHITsig was highly sensitive in identifying HGBL-DH/TH-BCL2 tumors, here DHITsig+ identified an additional 108 tumors sharing a similar biology that routine clinical FISH failed to capture.
Notably, MYC and BCL2 CNVs, in the context of atypical double-hit, did not confer a similar GEP as HGBL-DH/TH-BCL2 tumors. Although a trend toward DHITsig+ was observed for MYCTr/BCL2CNV and BCL2Tr/MYCGain+ tumors, this association was not significantly stronger than the association of translocation alone nor was it as definitive as the association of HGBL-DH/TH-BCL2 tumors with DHITsig+. Furthermore, tumors with MYCTR/BCL2CNV typically displayed an ABC COO. Therefore, irrespective of prognostic significance, these results strongly support the current WHO classification, whereby only rearrangements are considered in defining HGBL-DH/TH.
Although MYC IHC has been proposed as a screening method for subsequent FISH,50 MYC IHC negativity was observed in 30% of MYCTr tumors, consistent with previous reports.28 Two major mechanisms were seen that uncoupled MYCTr from MYC IHC positivity, namely low resultant MYC mRNA levels and the presence of the MYC-N11S variant. The N11S variant was detected in 7.6% of all sequenced tumors, comparable with the global minor allele frequency of 3.4% (rs4645959).51 Modeling the N11S variant in a cell line harboring MYCTr led to a decrease in detectable protein. Interestingly, although this effect only seems to be active when the N11S variant is present on the translocated allele, 4 of 5 patient tumors harboring the N11S variant with concomitant MYCTr were negative for MYC IHC.
It was previously reported that the MYC-N11S variant results in lower protein levels.52 Here, we showed that the introduction of the variant did not alter mRNA or protein levels when an antibody (9E10) to the C terminus of the protein was used. The discrepancy between the levels of protein detected by the 9E10 and Y69 antibodies in manipulated cell lines suggests that, rather than a true decrease in MYC expression, an apparent decrease of MYC protein is observed due to N11S-mediated disruption of the Y69 epitope. Although use of an IHC-suitable antibody that binds to the C terminus would be ideal for accurate detection of MYC protein, development of such an antibody has proven challenging.34
In summary, this study strongly supports the current exclusion of CNVs of MYC and BCL2 from the definition of HGBL-DH/TH, acknowledging that the analysis was limited to DLBCL morphology and excluded transformation from indolent lymphoma. It also highlights mechanisms that uncouple MYCTr from MYC protein expression, including those reflecting true low mRNA and protein levels, possibly related to the MYC partner gene,27 and others that are spurious, related to disruption of an antibody epitope. Building on the finding of rearrangements of MYC and BCL2 that are not detected by FISH, our study supports moving from a category defined simply by the presence of gene rearrangements to one defined by the strong molecular biology that these rearrangements typically produce.
Presented in part at the 59th annual meeting of the American Society of Hematology, Atlanta, GA, 9-12 December 2017.
Requests for data sharing may be submitted to the corresponding author (David W. Scott; e-mail: dscott8@bccancer.bc.ca).
The online version of this article contains a data supplement.
The publication costs of this article were defrayed in part by page charge payment. Therefore, and solely to indicate this fact, this article is hereby marked “advertisement” in accordance with 18 USC section 1734.
Acknowledgments
This study was supported by the Canadian Cancer Society Research Institute (704848 and 705288), Genome Canada (4108), Genome British Columbia (171LYM), the Canadian Institutes of Health Research (GPH-129347 and 300738), the Terry Fox Research Institute (1061 and 1043), and the BC Cancer Foundation. B.C. is supported by a Canada Graduate Scholarship–Masters Award. C.S., R.D.M., and D.W.S. are supported by a Michael Smith Foundation for Health Research Career Investigator Award (5120), Scholar Award (16805), and Health Professional Investigator award (18646), respectively. D.W.S. is supported by the BC Cancer Foundation.
Authorship
Contribution: B.C. and D.W.S. conceived and designed this study, analyzed and interpreted data, and wrote the manuscript; B.C., S.B.-N., M.B., T.M.-T., P.F., J.W.C., G.W.S., D.E., A.M., R.D.G., and D.W.S. performed research; B.C. and A.J. performed the statistical analysis; and all authors participated in the collection and assembly of data, and all authors read and edited the manuscript.
Conflict-of-interest disclosure: G.W.S. reports consulting and honoraria from Seattle Genetics. D.V. reports consulting and honoraria from Roche, Celgene, Janssen, Teva, Lundbeck, Seattle Genetics, AstraZeneca, Gilead, Kite, Novartis, and NanoString. C.F. reports honoraria from Seattle Genetics, Janssen, Amgen, Celgene, and AbbVie; and research funding from Roche and Teva. A.S.G. reports consulting and honoraria from Janssen, AbbVie, and Gilead. K.J.S. reports consulting and honoraria from Bristol Myers Squibb, Merck, Seattle Genetics, AstraZeneca, Gilead, and AbbVie; consulting for Servier; and steering committee membership for BeiGene. L.H.S. reports consulting and honoraria from Roche/Genentech, AbbVie, Amgen, Apobiologix, AstraZeneca, Acerta, Celgene, Gilead, Janssen, Kite, Karyopharm, Lundbeck, Merck, MorphoSys, Seattle Genetics, Teva, Takeda, TG Therapeutics, and Verastem. C.S. reports consulting and advisory board member for Seattle Genetics, Bayer, Curis, and Roche; and research funding from Bristol Myers Squibb and Trillium Therapeutics. D.W.S. reports consulting for AbbVie, AstraZeneca, Celgene, and Janssen; research funding from Janssen and NanoString Technologies; and is a named inventor on patents, including one licensed to NanoString Technologies. A.J., D.E., R.D.M., and D.W.S. are inventors on the DLBCL90 patent. The remaining authors declare no competing financial interests.
Correspondence: David W. Scott, British Columbia Cancer Research Centre, 675 West 10th Ave, Vancouver, BC V5Z 1L3, Canada; e-mail: dscott8@bccancer.bc.ca.

This feature is available to Subscribers Only
Sign In or Create an Account Close Modal