

Key Points
Combinatorial genome editing of hematopoietic progenitors shows the importance of mutational cooperativity in specifying leukemia lineage.
Combinatorial patterns of mutations are associated with drug sensitivity in preclinical models of erythroleukemia.

Abstract
Acute erythroid leukemia (AEL) is characterized by a distinct morphology, mutational spectrum, lack of preclinical models, and poor prognosis. Here, using multiplexed genome editing of mouse hematopoietic stem and progenitor cells and transplant assays, we developed preclinical models of AEL and non-erythroid acute leukemia and describe the central role of mutational cooperativity in determining leukemia lineage. Different combination of mutations in Trp53, Bcor, Dnmt3a, Rb1, and Nfix resulted in the development of leukemia with an erythroid phenotype, accompanied by the acquisition of alterations in signaling and transcription factor genes that recapitulate human AEL by cross-species genomic analysis. Clonal expansion during tumor evolution was driven by mutational cooccurrence, with clones harboring a higher number of founder and secondary lesions (eg, mutations in signaling genes) showing greater evolutionary fitness. Mouse and human AEL exhibited deregulation of genes regulating erythroid development, notably Gata1, Klf1, and Nfe2, driven by the interaction of mutations of the epigenetic modifiers Dnmt3a and Tet2 that perturbed methylation and thus expression of lineage-specific transcription factors. The established mouse leukemias were used as a platform for drug screening. Drug sensitivity was associated with the leukemia genotype, with the poly (ADP-ribose) polymerase inhibitor talazoparib and the demethylating agent decitabine efficacious in Trp53/Bcor–mutant AEL, CDK7/9 inhibitors in Trp53/Bcor/Dnmt3a–mutant AEL, and gemcitabine and bromodomain inhibitors in NUP98-KDM5A leukemia. In conclusion, combinatorial genome editing has shown the interplay of founding and secondary genetic alterations in phenotype and clonal evolution, epigenetic regulation of lineage-specific transcription factors, and therapeutic tractability in erythroid leukemogenesis.
Introduction
Acute erythroid leukemia (AEL) is a high-risk subtype of leukemia notable for erythroblastic proliferation of the bone marrow and a poor outcome.1-3 Recent attempts to classify AEL in the spectrum of myelodysplastic syndromes (MDS) and acute myeloid leukemia (AML) using morphologic criteria alone have failed to provide meaningful insights regarding disease biology.4 Moreover, experimental models of erythroleukemia are limited, with the first models available being those that initiate leukemia using Spleen Focus Forming Virus5 or Spi-1/Pu.1 transgenesis,6,7 or by enforcing expression of hematopoietic lineage transcription factors,8 which do not recapitulate the genetic complexity of human leukemias that commonly harbor multiple genetic alterations. Recently, a fully penetrant AEL was induced in double Bcor−/−/Dnmt3a−/− knockout mice.9 Using genomic analyses of large cohorts of AEL and non-erythroid leukemia,10 we described several mutationally distinct age-dependent subtypes of AEL, including cases with: (1) biallelic TP53 mutations (32%), often with concomitant mutations of chromatin regulators, transcription factors, and tumor suppressors (DNMT3A, BCOR, EZH2, RB1, or NFIX); (2) NPM1 mutations (12%); (3) KMT2A (MLL) mutations or rearrangements (11%); (4) NUP98 rearrangements (4%); (5) DDX41 mutations (3%); and (6) more than one-third of cases (37%) that lack one of these mutually exclusive, subtype-defining mutations but with enrichment of mutations in ASXL1, TET2, and splicing factors. These combinatorial patterns of mutations and associated distinctive gene expression profiles were powerful predictors of outcome, with NUP98-rearranged and TP53-mutated cases having the most dismal outcome and, conversely, NPM1-mutated AEL having the best outcome.
Using viral oncogene transduction of mouse hematopoietic stem and progenitor cells (HSPCs), we found that NUP98-KDM5A drives the development of myeloid leukemia and that NTRK1 mutations and TP53 inactivation together promote the development of AEL.10 These findings indicate that a subset of AEL alterations are leukemogenic, possibly with important genotype–phenotype correlations. However, these models account for <10% of cases and are not suited to recapitulate the polygenic combinations of alterations observed in the majority of AEL cases. Here, we used CRISPR/Cas9 genome editing of HSPCs and transplant assay of lethally irradiated mice to compare leukemia lineage upon editing of a range of different genes (Trp53, Tet2, Dnmt3a, Asxl1, Ezh2, Stag2, Bcor, Ppm1d, Rb1, and Nfix) to determine the effects of combinatorial mutations on leukemia phenotype and examine the therapeutic tractability of the established tumors. Edited gene sites were selected based on human mutational hotspots. Many of these genes are mutated in other myeloid leukemias or MDS but at a markedly different prevalence than in AEL. For example, AEL has significantly higher frequency of TP53 mutations, and loss of NFIX, located at chromosome 19, was specifically found in TP53-mutant AEL with chromothripsis of chromosome 19. Moreover, fusion of C-terminal NFIX to ZNF93 was found in the AEL TF-1 cell line.10 Thus, we sought to introduce the combinations of mutations observed in AEL in mouse HSPCs and characterize the resulting effects on leukemogenesis. We show the power of this approach in generating AEL models that recapitulate genomic features of human leukemia; associations between leukemia genotype and lineage, with notable cooperativity between TP53 and BCOR alterations; and that deregulation of erythroleukemia driver genes in both human disease and mouse models is strongly associated with leukemia genotype and deregulated methylation of key lineage-specific transcription factors.
Methods
According to the patterns of mutation cooccurrence and exclusivity observed in human AEL (Figure 1A-B),10 six different tag red fluorescent protein (tRFP+) lentiviral pools of 10 single guide RNA (gRNA) against Trp53, Tet2, Dnmt3a, Asxl1, Ezh2, Stag2, Bcor, Ppm1d, Rb1, and Nfix, or a nontargeting control gRNA, were generated (supplemental Methods, available on the Blood Web site) and used to transduce Cas9-eGFP-mouse lineage–negative HSPCs for transplant assays. The arising tumors were subjected to pathologic analysis; exome, transcriptome, and methylation profiling; single-cell analysis of transcriptomic and mutational evolution; and evaluation of drug sensitivity in vitro and in vivo (supplemental Tables 1-10; supplemental Figures 1 and 2). Data were compared vs and integrated with previous mouse models of NUP98-rearranged AML and NTRK1/TP53 comutated AEL leukemia and with human AEL.8,10
![Establishment of leukemia models by CRISPR/Cas9–mediated gene editing of HSPCs. (A) Frequency of mutations in human AEL10 of genes edited by CRISPR/Cas9. (B) Patterns of mutational cooccurrence and mutual exclusion in the 10 genes selected for gene editing. In orange are cell cycle regulators; in red, genes regulating DNA methylation; in purple, transcription factors; in pink, chromatin regulation genes; and in green, the cohesin gene STAG2. (C) Kaplan-Meier survival curves of established leukemia mouse models and control mice (nontargeting guide [NTG]). Mice from primary, secondary, tertiary, and quaternary serial passages are shown. Survival comparison was analyzed by log-rank test. (D) Spleen weight (left) from primary (P, n = 14), secondary (S, n = 42), tertiary (T, n = 15), and quaternary (Q, n = 16) recipient mice and from control mice (NTG). The mean weight is shown by the horizontal line in the scatter dot plot, and the error bars represent the standard deviation. (E) Representative histology showing multisystemic infiltration of representative leukemia models of AEL (#744), mixed AEL/B-ALL (#595), and T-ALL (#755). Necropsy revealed a more extensive meningeal leukemic infiltration of meninges in lymphoid models compared with erythroid models. Images are liver, kidney, and brain (meninges). Scale bars in column 2 are 50 μm; the remainder are 100 μm. (F) Changes in gRNA enrichment in HSPCs pretransplant and in developed tumors as determined by amplicon sequencing and deep targeted sequencing. (G) Induced CRISPR/Cas9 mutations in Trp53, Bcor, and Dnmt3a. Plotted data are from supplemental Table 11. ns, not significant.](https://ash.silverchair-cdn.com/ash/content_public/journal/blood/137/12/10.1182_blood.2020009103/1/m_bloodbld2020009103f1.png?Expires=1769104503&Signature=lDJWeN2Ea2ZURFe-hkI5qFwc3BslyJSsrFwreYM-zMg7fJT51hQpD5vBcPnIJCRfZ-16dWq-ySWtU~hRC9fnkOj-C~qlkUsVs6mbcofeSJCJqx8mqB3sqdX6~3lUIta-U-q8EeOvz9-cGcy4X2QEBIgY4bQNmdfLjoum2RB~v6omT~C0TuIBA9Ez2J2iZV0I5Q~htWnpwLK~Ex6BHRglO7JNOmfGRs9a9dFvbiHihPZkWrXntChG6EGkguFY8HfKSUBFarNdbXQpVE3M~LZqPn8LLXwvwiYdtmK4-ep9dHdZjVwkII08fJlW-HCUASQ9nM0OBG65-Ov9rMl9aMZxyQ__&Key-Pair-Id=APKAIE5G5CRDK6RD3PGA)
Establishment of leukemia models by CRISPR/Cas9–mediated gene editing of HSPCs. (A) Frequency of mutations in human AEL10 of genes edited by CRISPR/Cas9. (B) Patterns of mutational cooccurrence and mutual exclusion in the 10 genes selected for gene editing. In orange are cell cycle regulators; in red, genes regulating DNA methylation; in purple, transcription factors; in pink, chromatin regulation genes; and in green, the cohesin gene STAG2. (C) Kaplan-Meier survival curves of established leukemia mouse models and control mice (nontargeting guide [NTG]). Mice from primary, secondary, tertiary, and quaternary serial passages are shown. Survival comparison was analyzed by log-rank test. (D) Spleen weight (left) from primary (P, n = 14), secondary (S, n = 42), tertiary (T, n = 15), and quaternary (Q, n = 16) recipient mice and from control mice (NTG). The mean weight is shown by the horizontal line in the scatter dot plot, and the error bars represent the standard deviation. (E) Representative histology showing multisystemic infiltration of representative leukemia models of AEL (#744), mixed AEL/B-ALL (#595), and T-ALL (#755). Necropsy revealed a more extensive meningeal leukemic infiltration of meninges in lymphoid models compared with erythroid models. Images are liver, kidney, and brain (meninges). Scale bars in column 2 are 50 μm; the remainder are 100 μm. (F) Changes in gRNA enrichment in HSPCs pretransplant and in developed tumors as determined by amplicon sequencing and deep targeted sequencing. (G) Induced CRISPR/Cas9 mutations in Trp53, Bcor, and Dnmt3a. Plotted data are from supplemental Table 11. ns, not significant.
Establishment of leukemia models by CRISPR/Cas9–mediated gene editing of HSPCs. (A) Frequency of mutations in human AEL10 of genes edited by CRISPR/Cas9. (B) Patterns of mutational cooccurrence and mutual exclusion in the 10 genes selected for gene editing. In orange are cell cycle regulators; in red, genes regulating DNA methylation; in purple, transcription factors; in pink, chromatin regulation genes; and in green, the cohesin gene STAG2. (C) Kaplan-Meier survival curves of established leukemia mouse models and control mice (nontargeting guide [NTG]). Mice from primary, secondary, tertiary, and quaternary serial passages are shown. Survival comparison was analyzed by log-rank test. (D) Spleen weight (left) from primary (P, n = 14), secondary (S, n = 42), tertiary (T, n = 15), and quaternary (Q, n = 16) recipient mice and from control mice (NTG). The mean weight is shown by the horizontal line in the scatter dot plot, and the error bars represent the standard deviation. (E) Representative histology showing multisystemic infiltration of representative leukemia models of AEL (#744), mixed AEL/B-ALL (#595), and T-ALL (#755). Necropsy revealed a more extensive meningeal leukemic infiltration of meninges in lymphoid models compared with erythroid models. Images are liver, kidney, and brain (meninges). Scale bars in column 2 are 50 μm; the remainder are 100 μm. (F) Changes in gRNA enrichment in HSPCs pretransplant and in developed tumors as determined by amplicon sequencing and deep targeted sequencing. (G) Induced CRISPR/Cas9 mutations in Trp53, Bcor, and Dnmt3a. Plotted data are from supplemental Table 11. ns, not significant.
Details regarding additional experimental and molecular methods used in this study are provided in the supplemental Methods.
Results
Comutated Trp53 and Bcor drive erythroleukemia
Fourteen genetically different leukemia models were established in primary recipient mice by CRISPR/Cas9 genome editing (supplemental Table 3). Leukemic clones from primary tumors were serially transplantable across multiple different genotypes, with a shorter latency in subsequent passages (median survival of 94 days vs 37, 29, and 21 days of secondary, tertiary, and quaternary recipients, respectively; P < .0001) and with multiorgan dissemination (Figure 1C-E; supplemental Figure 3).
Sequencing of edited sites and analysis of the leukemia genomes and transcriptomes showed that the patterns of concomitant mutations were central determinants of tumor lineage. In contrast to the uniform representation of gRNAs in HSPCs pretransplant, tumors exhibited enrichment of specific gRNAs according to tumor lineage (Figure 1F). Specifically, induction of AEL (tumor cell phenotype GATA1+RUNX1+CD41–GR1–MAC1–MPO–CD19–CD3–B220–PAX5–) was associated with inactivation of Bcor and Trp53, which were comutated in all engineered AEL tumors (n = 8) (Figure 1G), either alone (n = 2 tumors) or comutated with Dnmt3a (n = 2), Rb1 (n = 4), or Nfix (n = 2) (Figures 1F-G and 2A; supplemental Figure 3B-E; supplemental Table 11). CRISPR/Cas9–induced mutations were mostly frameshifts but also aberrantly spliced transcripts (eg, in Bcor) as detected by RNA-sequencing (supplemental Figure 4), indicating the complexity of alterations induced by genome editing and the need for genome-wide approaches for mutation identification.
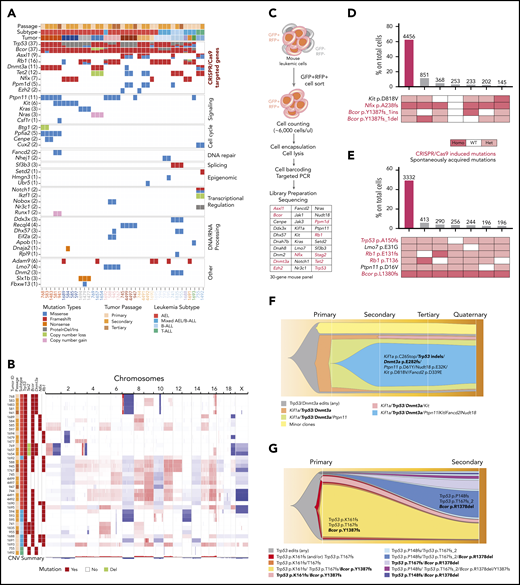
Genetic architecture of the established leukemia mouse models. (A) Mutations induced by CRISPR/Cas9 gene editing and spontaneously acquired during leukemia clonal evolution. Each column is a different mouse. For each gene, all variants are reported in supplemental Tables 11 and 12. In metadata, each tumor model is represented by a different color. (B) Copy number changes from whole-exome sequencing and visualized by Integrative Genomics Viewer (Igv) show gross aneuploidies in samples with Trp53 mutations. Blue indicates deletions; red indicates gains. (C) Schematic workflow of single-cell DNA-sequencing performed on representative established mouse models of AEL (n = 8, samples: 2 primary, 4 secondary, 1 tertiary, and 1 quaternary tumor). Bar plot showing cooccurrence of mutations in cells from mouse #587 (secondary passage) (D) and from mouse #588 (E) sample. In panel D, the large non-frameshift deletion in Trp53 (p.R155-172del) was not detectable by this assay and not included in this analysis. However, from bulk sequencing, variant allele frequency was 77%, suggesting it can be a founder event. (F) Fish plot showing acquisition of mutations in serial transplants (from primary to quaternary passage, mouse IDs are 768, 583, 941, and 962, respectively). The genes with homozygous mutations are in bold. In secondary passage, gain of Kit and Fancd2 mutations drove clonal expansion (blue clone). Minor clones include cells with a different heterozygous or homozygous combination of mutations of Tp53, Dnmt3a, and Kif1a. Bcor deletions are reported in supplemental Table 13. However, because the mean amplicon number among cells was low, we chose not to use it for clonal analysis. (G) Fish plot showing acquisition of mutations from a primary mouse model with AEL (mouse ID 1695) to a secondary passage with mixed AEL/B-ALL (mouse ID 594). The suffix “_2” in TP53 T167fs_2 describes a frameshift mutation due to a deletion of 2 nucleotides. In TP53 T167fs, the frameshift mutation is due to a nucleotide insertion. The genes with homozygous mutations are in bold. In panels F and G, the symbol “/” means “and” (cooccurrence of mutations). GFP, green fluorescent protein; RFP, red fluorescent protein; WT, wild type.
Genetic architecture of the established leukemia mouse models. (A) Mutations induced by CRISPR/Cas9 gene editing and spontaneously acquired during leukemia clonal evolution. Each column is a different mouse. For each gene, all variants are reported in supplemental Tables 11 and 12. In metadata, each tumor model is represented by a different color. (B) Copy number changes from whole-exome sequencing and visualized by Integrative Genomics Viewer (Igv) show gross aneuploidies in samples with Trp53 mutations. Blue indicates deletions; red indicates gains. (C) Schematic workflow of single-cell DNA-sequencing performed on representative established mouse models of AEL (n = 8, samples: 2 primary, 4 secondary, 1 tertiary, and 1 quaternary tumor). Bar plot showing cooccurrence of mutations in cells from mouse #587 (secondary passage) (D) and from mouse #588 (E) sample. In panel D, the large non-frameshift deletion in Trp53 (p.R155-172del) was not detectable by this assay and not included in this analysis. However, from bulk sequencing, variant allele frequency was 77%, suggesting it can be a founder event. (F) Fish plot showing acquisition of mutations in serial transplants (from primary to quaternary passage, mouse IDs are 768, 583, 941, and 962, respectively). The genes with homozygous mutations are in bold. In secondary passage, gain of Kit and Fancd2 mutations drove clonal expansion (blue clone). Minor clones include cells with a different heterozygous or homozygous combination of mutations of Tp53, Dnmt3a, and Kif1a. Bcor deletions are reported in supplemental Table 13. However, because the mean amplicon number among cells was low, we chose not to use it for clonal analysis. (G) Fish plot showing acquisition of mutations from a primary mouse model with AEL (mouse ID 1695) to a secondary passage with mixed AEL/B-ALL (mouse ID 594). The suffix “_2” in TP53 T167fs_2 describes a frameshift mutation due to a deletion of 2 nucleotides. In TP53 T167fs, the frameshift mutation is due to a nucleotide insertion. The genes with homozygous mutations are in bold. In panels F and G, the symbol “/” means “and” (cooccurrence of mutations). GFP, green fluorescent protein; RFP, red fluorescent protein; WT, wild type.
TP53-mutated tumors commonly exhibited gross aneuploidy as observed in human TP53-mutated AEL with complex karyotype (Figure 2B; supplemental Figure 5A-F). These tumors commonly acquired secondary mutations in signaling pathway genes such as Ptpn11, Kit, Kras, Nras, and Csf1r1 and in regulators of cell cycle and DNA repair genes (Btg1 and Fancd2). Mutational hotspots were similar to those observed in human leukemia, and they were acquired in minor clones in primary tumors but drove clonal expansion in subsequent passages (supplemental Table 12).
In contrast to the engineered AEL models, several other patterns of mutations promoted non-erythroid leukemia formation. Triple inactivation of Trp53, Bcor, and Tet2 promoted B-cell acute lymphoblastic leukemia (B-ALL; GATA1–RUNX1–CD41–GR1–MAC1–CD19+CD3–B220+PAX5+) that was accompanied by Sf3b3 mutation. Concomitant inactivation of Dnmt3a and Tet2, together with subsequent Notch1 mutation and Ikzf1 loss (supplemental Figure 5A), promoted T-ALL (GATA1–RUNX1–CD41–GR1– MAC1–CD19–CD3+B220dimPAX5–) that acquired Setd2 mutation in serial passaging (Figure 2A; supplemental Tables 11-12).
The leukemia phenotype of the established mouse models was further supported by a digital cellular deconvolution method from gene expression data (xCell)11 that confirmed enrichment of erythroid cells in the AEL models, T cells in the T-cell ALL model, and B cells in the B-ALL models. Mixed erythroid/lymphoid leukemias (GATA1+RUNX1+CD41–GR1–MAC1–CD19+CD3-B220+PAX5+), with a combination of mutations in Bcor, Trp53, and Rb1, were confirmed to express both erythroid and lymphoid B-cell markers (supplemental Figure 6A). These data highlight the leukemogenic role of the mutations studied and the importance of primary and secondary lesions in driving tumor lineage.
Founder mutations induced by genome editing were stable in serial transplants; in contrast, subclonal mutations in Asxl1, Ppm1d, and Ezh2 were often lost in serial passages, suggesting a weak role in driving leukemia expansion (Figure 1F; supplemental Table 11). Although leukemia cells constitutively expressed Cas9, off-target sites of genome editing were not identified.
Interestingly, analysis at the time of last follow-up of bone marrow samples from mice that did not develop tumors (n = 12) showed enrichment of combinations of gRNAs targeting Tet2, Dnmt3a, Stag2, and Asxl1 but not Nfx1, Rb1, Trp53, or Bcor (except for one) (supplemental Figure 6B). These genes are frequently mutated in clonal hematopoiesis of indeterminate potential, a clinical entity defined by the presence of a cancer-associated clonal mutation in at least 2% of nucleated blood cells of individuals without frank neoplasia.12 These results support the notion that mutations in these genes alone are insufficient to promote leukemogenesis. As in human AEL, in which mutations in Dnmt3a and Tet2 are frequently found in older patients with TP53 mutations, here they promoted tumors only when cooccurring with Trp53. Notably, no mice transplanted with HSPCs with induced Stag2 inactivation developed tumors. Among those, 2 mice died within 20 days showing signs of bone marrow failure, suggesting a synthetic lethality from the induced mutations. Homozygous Stag2 loss in normal cells has been described to promote collapse of replication forks and double-strand breaks in the DNA, with consequent activation of DNA damage signaling pathways and ultimately cell death.13
Accumulation of mutations drives clonal expansion and leukemia phenotype
Bulk tumor sequencing can suggest but not directly show mutational cooccurrence and provides limited insight into the nature of mutational patterns driving clonal evolution. Hence, to explore the role of combinatorial mutations in promoting transformation and clonal evolution, we performed single-cell DNA-targeted sequencing of representative primary and passaged tumors (Figure 2C; supplemental Table 13). This approach enabled several observations. First, transformation was accompanied by expansion of multiple clones, with the dominant one usually showing the highest number of driver mutations. For example, in Bcor/Nfix/Kit–mutated AEL, >60% of cells had cooccurrence of all mutations, whereas minor clones (<5%) did not (Figure 2D). Similarly, in the AEL mouse model with mutations in Bcor, Trp53, Rb1, Ptpn11, and Lmo7, >50% of cells harbored all mutations (Figure 2E). Moreover, an AEL model with editing-induced Dnmt3a/Bcor/Trp53 mutations in the founder clone acquired mutations in Kif1a (C26Stop) and Ptpn11 (D61Y), and this clone became predominant over those without mutations in signaling genes. Additional mutations in Kit (D818V, equivalent to the human D816V mutation14 ), Nudt18, and Fancd2 were acquired by the primary clone during passage in a secondary recipient mouse. This clone expanded in serial passages, whereas the subclone with founder but any of these new mutations was lost during passaging (Figure 2F). This dynamic accumulation of mutations recapitulates sequential occurrence of mutations in human AEL and confirms that mutations in signaling genes are secondary events that promote expansion of fitter clones. Notably, the mutation in the Fanconi gene Fancd2 was associated with a progressive increase in mutation burden on passaging (supplemental Figure 7).
Second, this analysis showed that fluctuation in mutational clonal composition drives changes in leukemia phenotype. In a triple Bcor/Rb1/Trp53–mutant AEL model, expansion of cells with mixed AEL/B lymphoid phenotype (GATA1+, CD44+, B220+, CD19+, and PAX5+) was observed in secondary passages. To investigate phenotypic architecture, we performed single-cell DNA-sequencing (Figure 2G) and full-length RNA-sequencing coupled with high parameter flow cytometric immunophenotyping that identified 4 distinct gene expression clusters (Figure 3A; supplemental Figures 8 and 9A). Immature hematopoietic cells with expression of both primitive erythroid and lymphoid markers (eg, Gata2, Gata1, Cd45; group 0) (supplemental Figure 9B) and progenitor erythroid cells expressing Ms4a2 and Gata1 (group 1) were predominant in the primary tumor, whereas more differentiated erythroid cells (group 2) expressing Hba/Hbb genes, and mixed B-lymphoid/erythroid cells, expressing Cd74, Cd19, Pax5, Cd44, and Hba/Hbb genes (group 3), were dominant in the secondary tumor passage (supplemental Tables 14-15; supplemental Figure 9C-D).
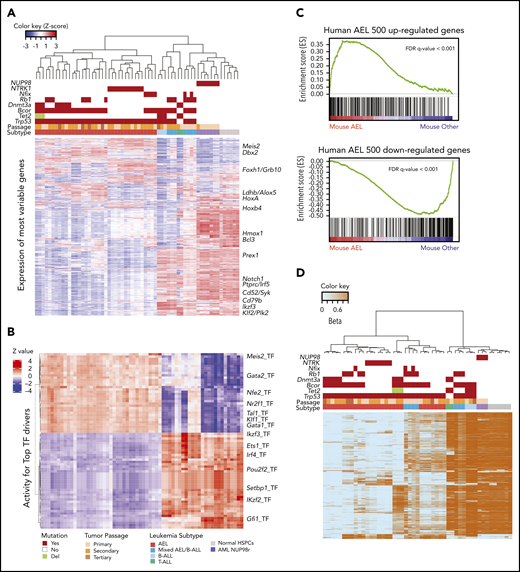
Transcriptome and methylome profiles of established mouse models recapitulating human leukemia. (A) Unsupervised hierarchical clustering identified 2 main gene expression subgroups associated with leukemia phenotype. Group 1 included samples with combinations of CRISPR/Cas9–induced mutations in Trp53, Bcor, Dnmt3a, Nfix, Tet2, or Rb1 and samples with NTRK1/TP53 double mutations. Color legends are the same in panel B. (B) Heatmap of NetBID-inferred activity of top 34 positive and 41 negative TF drivers in the comparison of AEL mouse model vs other leukemia subtypes (N = 75, and the P < 1e-9 was used as the significance cutoff). Drivers in the top 34 rows are upregulated in the AEL mouse model, whereas the bottom 41 rows represent genes downregulated in the AEL mouse model. Sample order is the same from panel A. (C) Gene set enrichment analysis confirmed that the established mouse AEL models recapitulated human AEL.10 (D) Heatmap of beta values, with 0 for unmethylated CpGs in light blue, and 1 for methylated CpGs in orange. Top 8000 most variable CpGs were selected based on mean absolute deviation score of M-value (log2Ratio) and used for hierarchical clustering. Three main groups were depicted that were correlated with genotype and gene expression profile. Each color represents a different leukemia model. Color legends for subtypes, passages, and mutations are from panels A and B. FDR, false discovery rate; Pri_mouse, primary mouse ID; RNA-seq HC, RNA-seq hierarchical clustering.
Transcriptome and methylome profiles of established mouse models recapitulating human leukemia. (A) Unsupervised hierarchical clustering identified 2 main gene expression subgroups associated with leukemia phenotype. Group 1 included samples with combinations of CRISPR/Cas9–induced mutations in Trp53, Bcor, Dnmt3a, Nfix, Tet2, or Rb1 and samples with NTRK1/TP53 double mutations. Color legends are the same in panel B. (B) Heatmap of NetBID-inferred activity of top 34 positive and 41 negative TF drivers in the comparison of AEL mouse model vs other leukemia subtypes (N = 75, and the P < 1e-9 was used as the significance cutoff). Drivers in the top 34 rows are upregulated in the AEL mouse model, whereas the bottom 41 rows represent genes downregulated in the AEL mouse model. Sample order is the same from panel A. (C) Gene set enrichment analysis confirmed that the established mouse AEL models recapitulated human AEL.10 (D) Heatmap of beta values, with 0 for unmethylated CpGs in light blue, and 1 for methylated CpGs in orange. Top 8000 most variable CpGs were selected based on mean absolute deviation score of M-value (log2Ratio) and used for hierarchical clustering. Three main groups were depicted that were correlated with genotype and gene expression profile. Each color represents a different leukemia model. Color legends for subtypes, passages, and mutations are from panels A and B. FDR, false discovery rate; Pri_mouse, primary mouse ID; RNA-seq HC, RNA-seq hierarchical clustering.
Because this cluster annotation was performed by using differentially expressed genes, it is important to note that the indicated cell phenotypes are predictions that do not necessarily reflect the stage of these cells within a normal differentiation pathway. The secondary tumor showed upregulation of B-cell receptor signaling and germinal center B-cell signatures with expression of Bach2, Ets1, Btg1, Vpreb1, Cd79A, Cd79B, Syk, and Blnk (supplemental Figure 10A). Single-cell RNA-sequencing identified an alternative isoform of Bcor in mixed B/erythroid cells due to a larger Bcor gene deletion. This deletion was confirmed by single-cell DNA-sequencing of total and purified subpopulations of erythroid, lymphoid, or mixed phenotype (supplemental Figure 10B-F; supplemental Table 16). In contrast to the truncated Bcor alleles induced by genome editing in the primary tumor, expression of this BCOR isoform was associated with downregulation of components of noncanonical polycomb repressive complex 1 (PRC1.1),15 such as Kdm2b, Ring1b, Pcfg1, and Rybp, and overexpression of its repressed target genes, including lymphoid markers (eg, Traf3ip3, Bach2, Zfp36, Runx3, Bcr, Foxo1, Pax5, Irf4, Lef1). The interaction region with BCL6 was retained as shown by upregulation of BCL6 and B-cell receptor signaling pathway, suggesting this BCOR truncation promoted lymphoid maturation (supplemental Figure 10B-C). Overall, integrated single-cell genomic/transcriptomic profiling directly showed the relationship of initiating and secondary genomic lesions and their relationship to leukemic phenotype.
Genotype-directed perturbed methylation drives erythroid leukemogenesis
Hierarchical clustering of transcriptome data of tumors induced by genome editing and those induced by viral HSPC manipulation (NUP98-rearranged leukemia and comutated NTRK1/TP53R172H models10 ) identified 2 clusters of tumors corresponding to leukemia phenotype and genotype. The AEL clusters included those models established by both genome editing with comutations in Trp53, Bcor, Dnmt3a, Nfix, or Rb1 and those induced by viral expression of NTRK1/TP53R172H mutations. The non-AEL cluster included mouse tumors of B- or T-lymphoid, or mixed B-lymphoid/erythroid phenotype induced by genome editing, and NUP98-rearranged AML (Figure 3A). Gene set enrichment analysis revealed significant similarity of the gene expression profiles of mouse and human AEL.
We next sought to identify putative drivers of erythroleukemia and used cross-species analysis of gene expression profile data using the NetBID algorithm.16 We first identified major transcription factors (TFs) in human AEL10 and then calculated the activity scores of these TFs in the mouse samples (Figure 3B; supplemental Figure 2). Among the top TFs with positive regulation in the AEL cluster were TFs required for differentiation of megakaryocyte–erythroid progenitors (eg, Nr2f1, Gata1, Klf1, Gfi1b, Tal1, Nfe2) (supplemental Figures 11A and 12A). Conversely, among the top negatively regulated TFs in AEL were those required for lymphoid cell activation (eg, Irf4, Id3, Pou2f2) (supplemental Figures 11B and 12B). In unsupervised gene expression analysis of AEL, Bcor/Trp53 comutated models clustered together and had aberrant expression of HSC-expressed genes (eg, Smo, Hoxa9, Hoxa7, Hoxb3, Hoxb4, Mllt6). These genes were also deregulated in a mouse model of Bcor/Nras mutant myeloid leukemia.17 Comparing human primary AEL tumors10 vs B-ALL18 and T-ALL,19 we identified the top 500 most upregulated or downregulated genes in AEL. Enrichment of these signatures was evaluated by using gene set enrichment analysis (Figure 3C), which revealed similarity of mouse and human AEL tumors. Genes upregulated in AEL included those expressed in the erythroid lineage and key erythroid transcription factors (eg, Gata1, Gata2, Klf1, Gfi1b, Nfe2, Tal1), cytokine receptors (Epor and Kit), and red blood cell surface markers (eg, Ermap, Ank1, Cd36, Epb42, Slc4a1). In addition, upregulation of Hoxa/b genes (Hoxa3/5/6/7/9/10 and Hoxb5/6/7) was observed (supplemental Table 17).
Because 2 genes targeted by genome editing (Dnmt3a and Tet2) regulate methylation in normal hematopoietic cells,20,21 we explored how mutations in these genes and other drivers perturbed methylation, gene expression, and tumor lineage. The global cytosine guanine dinucleotide (CpG) methylation level across the different genetic backgrounds was examined. Mouse models of AEL with a combination of induced founder mutations in Trp53, Bcor, Nfx1, and Rb1 and models of NTRK1/TP53 comutated AEL, exhibited global hypomethylation, whereas NUP98-rearranged models and normal HSPCs had intermediate global methylation levels (supplemental Table 18). An interaction of Dnmt3a and Tet2 mutation status was evident, with global hypomethylation in Dnmt3a single mutated tumors, hypermethylation of Tet2 single mutated tumors, and intermediate methylation of Dnmt3a/Tet2 mutated tumors (Figure 3D; supplemental Table 19). In addition, considering that DNA methylation regulates gene expression by recruiting proteins involved in gene repression or by inhibiting the binding of transcription factor(s) to DNA, we identified genes showing negative correlation between promoter methylation and gene expression. Among these genes, the most overrepresented gene ontology terms were those implicated in erythrocyte differentiation (P = 9.99 × 10⁻¹³; including genes such as Gata1, Klf1, Tal1, Nfe2l1, Kit, Lyn, and Jak2) and protein binding (P = 5.84 × 10⁻²⁰; including Mef2c, Braf, Rcor1, Lifr, and Ctnna1) (supplemental Table 20). These data show that tumor development is accompanied by changes in methylation and gene expression of erythroid transcription factors.
To investigate the contribution to leukemogenesis by Dnmt3a and/or Tet2 mutations in the established models, we analyzed genomic regions sharing similar methylation profiles across the mouse leukemia models, with alterations of Dnmt3a and/or Tet2 mutation/deletion compared with the methylation profiles in normal HSPCs. Five distinct groups of differentially hypomethylated and hypermethylated CpGs between tumors and HSPCs were detected according to genotype and were inversely correlated with gene expression levels (Figure 4A-B; supplemental Table 21). Hypomethylated regions were more frequently associated with genic regions and with enrichment of EP300 binding,22 especially in Dnmt3a-mutated AEL models (Figure 4B-E; supplemental Table 22). Conversely, clusters of hypermethylated CpGs were predominant in proximal gene promoters and therefore repressed gene expression, as shown by enrichment of SUZ12 binding23 (Figure 4C-E). Differentially methylated groups of CpGs correlated with specific tumor genotypes. Dnmt3a-mutated/Tet2 wild-type leukemia models, or Dnmt3a-mutant/Tet2-heterozygous models, were of erythroid phenotype and exhibited hypomethylation and overexpression of genes regulating erythrocyte differentiation and homeostasis, including Gata1, Klf1, and Kit. Conversely, these tumors also exhibited hypermethylation and low expression of genes involved in leukocyte activation and differentiation (eg, Myb, Tnfaip3, Ikzf3, Cd74) (supplemental Table 23). Interestingly, compared with Dnmt3a-mutated/Tet2 wild-type tumors, heterozygous inactivation of Tet2 promoted restoration of methylation of genes involved in metabolic pathways (eg, Nmnat2, Arg1, Satt5a, Ddah2) (Figure 4A).
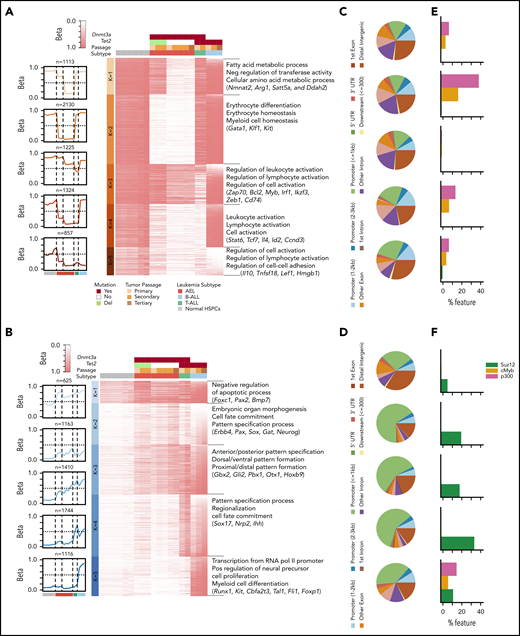
Characterization of hypomethylated and hypermethylated regions in mouse models with Dnmt3a and/or Tet2 mutations compared with HSPCs. Heatmap of beta scores for each hypomethylated (A) or hypermethylated (B) genomic region (row) clustered by using k-means; each column represents one sample, and genotypes are shown on top. Centroid of beta score for each cluster is shown on the left. The pie charts describe the overlap between hypomethylated (C) and hypermethylated (D) genomic regions and known genetic regions (mm9). Percentage of genomic regions in hypomethylated (E) or hypermethylated (F) clusters that overlap with SUZ12, P300, and MYB binding sites (http://useast.ensembl.org/info/genome/funcgen/index.html). UTR, untranslated region.
Characterization of hypomethylated and hypermethylated regions in mouse models with Dnmt3a and/or Tet2 mutations compared with HSPCs. Heatmap of beta scores for each hypomethylated (A) or hypermethylated (B) genomic region (row) clustered by using k-means; each column represents one sample, and genotypes are shown on top. Centroid of beta score for each cluster is shown on the left. The pie charts describe the overlap between hypomethylated (C) and hypermethylated (D) genomic regions and known genetic regions (mm9). Percentage of genomic regions in hypomethylated (E) or hypermethylated (F) clusters that overlap with SUZ12, P300, and MYB binding sites (http://useast.ensembl.org/info/genome/funcgen/index.html). UTR, untranslated region.
This scenario is consistent with the emerging metabolic function of TET proteins in adipocytes. TET2 is normally expressed in adipose tissue where it regulates global 5-hydroxymethylcytosine levels, but its expression is diminished in adipose stem cells from obese subjects, concurrent with a reduction in global 5-hydroxymethylcytosine levels.24 Mutated Tet2 without Dnmt3a was associated with the B-ALL phenotype and hypermethylation in enhancer regions that were characterized by enrichment of genes involved in myeloid and erythroid cell differentiation (eg, Runx1, Kit, Cbfa2t3, Tal1, Fli1, Foxp1, Cepba) and in T-cell differentiation (eg, Il15, Card11, Zbtb16) (Figure 4B). Although the observed changes in methylation may in part reflect erythroid lineage fate, the highly significant association with Dnmt3a/Tet2 genotype suggests that perturbation of lineage-specific transcription factors in leukemic cells may drive a specific lineage.
Therapeutic sensitivity of preclinical AEL models
The engineered models of AEL offered the opportunity to explore drug sensitivity to a wide range of compounds and examine the correlation between specific genetic alterations and therapeutic sensitivity. The human erythroid/megakaryocytic acute leukemia cell lines with TP53 mutation (TF-1 and HEL) or NUP98-KDM5A rearrangement (CHFR-288) and representative mouse models of leukemia (n = 11) were selected to test sensitivity to a panel of 219 drugs; this panel included common antineoplastic and targeted agents that were enriched for inhibitors of protein kinases (n = 77; eg, AKT, CDK, ERK, JAK family), apoptosis and cell cycle checkpoints (n = 17), and epigenetic regulators (n = 93; eg, histone methyltransferases, histone demethylases, histone deacetylases, DNA methyltransferases, bromodomain proteins) (Figure 5A; supplemental Table 10; supplemental Figures 13-15). Almost all tested leukemia models (9 of 11 [82%]) harbored Trp53 mutations in combination with cooperating mutations in other genes (eg, Dnmt3a, Bcor, Tet2, Ptpn11). Two additional samples were Trp53 wild type: a T-ALL with mutations in Notch1, Dnmt3a, and Tet2; and a NUP98-KDM5A-rearranged AML. Drug sensitivity was dependent on leukemia genotype. NUP98-KDM5A–derived leukemias were sensitive to BRD2/4 inhibitors (SJ849018, OTX015, and I-BET726), topoisomerase II inhibitors (eg, mitoxantrone, daunorubicin) and, as previously described, gemcitabine25 (Figure 5B; supplemental Figure 14A).
![Ex vivo drug vulnerabilities. (A) Activity of compounds in human cell lines of AEL and NUP98-KDM5A rearranged AML and in primary cells from the established mouse models of AEL, AML, and B/T-ALL. The heatmap indicates area under the curve (AUC) values for each compound per leukemia sample; red indicates higher sensitivity. The 2 positive controls used in the drug screening (bortezomib [BORT] and panobinostat [PANO]) are in bold. Distribution of AUC values (y-axis) for each compound (x-axis) in CHFR-2811 human cells expressing NUP98-KDM5A and mouse primary NUP98-KDM5A–expressing AML cells (B), AEL leukemia mouse models (#1651 and #1483) with mutations in Trp53, Bcor, and Dnmt3a (C), and AEL leukemia mouse models (#4497 and #4499) with mutations in Trp53 and Bcor but wild-type Dnmt3a (D). The topmost effective drugs (higher AUC values) are highlighted by colored dots in each panel. The 2 positive controls (BORT and PANO) are highlighted in gray.](https://ash.silverchair-cdn.com/ash/content_public/journal/blood/137/12/10.1182_blood.2020009103/1/m_bloodbld2020009103f5.png?Expires=1769104503&Signature=4SyHuu~PbcIAakXrAAzaNwIuNzv-ga-y~iA7KvKXr0IQVhqv4nJX2XU8Fz1fMfdi6b6yCOvZpvh5RjmM9A~O8MRQhQo5RFreBTOUmgJu550lP9FtdHYkt16S-k4aCHzPRbwI4t~9ki6SrEBZZgNl6U15tece00ycLHHyJk9cED1sNVaxyHJD6G-mOa~u~yO3ENZJ~lg25bOT1vmiNJO90IamWo-xQKumOteUCpGlwXFDpFalzBaSs8gYK2Fv3ijXcz8At64KwvJYif2Y3z6IZyotnim~K9XZWb~Z5XIwqTgR4H818jGDKuuzAxOkPZAUOQBntDc6R6NmPecv9xodQw__&Key-Pair-Id=APKAIE5G5CRDK6RD3PGA)
Ex vivo drug vulnerabilities. (A) Activity of compounds in human cell lines of AEL and NUP98-KDM5A rearranged AML and in primary cells from the established mouse models of AEL, AML, and B/T-ALL. The heatmap indicates area under the curve (AUC) values for each compound per leukemia sample; red indicates higher sensitivity. The 2 positive controls used in the drug screening (bortezomib [BORT] and panobinostat [PANO]) are in bold. Distribution of AUC values (y-axis) for each compound (x-axis) in CHFR-2811 human cells expressing NUP98-KDM5A and mouse primary NUP98-KDM5A–expressing AML cells (B), AEL leukemia mouse models (#1651 and #1483) with mutations in Trp53, Bcor, and Dnmt3a (C), and AEL leukemia mouse models (#4497 and #4499) with mutations in Trp53 and Bcor but wild-type Dnmt3a (D). The topmost effective drugs (higher AUC values) are highlighted by colored dots in each panel. The 2 positive controls (BORT and PANO) are highlighted in gray.
Ex vivo drug vulnerabilities. (A) Activity of compounds in human cell lines of AEL and NUP98-KDM5A rearranged AML and in primary cells from the established mouse models of AEL, AML, and B/T-ALL. The heatmap indicates area under the curve (AUC) values for each compound per leukemia sample; red indicates higher sensitivity. The 2 positive controls used in the drug screening (bortezomib [BORT] and panobinostat [PANO]) are in bold. Distribution of AUC values (y-axis) for each compound (x-axis) in CHFR-2811 human cells expressing NUP98-KDM5A and mouse primary NUP98-KDM5A–expressing AML cells (B), AEL leukemia mouse models (#1651 and #1483) with mutations in Trp53, Bcor, and Dnmt3a (C), and AEL leukemia mouse models (#4497 and #4499) with mutations in Trp53 and Bcor but wild-type Dnmt3a (D). The topmost effective drugs (higher AUC values) are highlighted by colored dots in each panel. The 2 positive controls (BORT and PANO) are highlighted in gray.
AEL models with mutated Trp53, Bcor, and Dnmt3a (Figure 5C) were sensitive to aurora kinase A inhibitor; to bromodomain, histone deacetylase, and demethylase inhibitors; and to CDK7 and CDK9 inhibitors (THZ1, anti-CDK7; LY2857785, anti–CDK8/CDK9; and CDK9-IN-2, anti-CDK9). Sensitivity to CDK9 inhibitors was confirmed in AEL samples with combinatorial mutations in Trp53, Bcor, Nfix, and Rb1, whereas sensitivity to CDK7 inhibition was confirmed in both human TP53-mutated AEL cell lines (supplemental Figure 15A).
Notably, Trp53/Bcor–mutated tumors lacking Dnmt3a or Tet2 mutations showed high sensitivity to poly(ADP-ribose) polymerase (PARP) inhibitors, such as talazoparib or veliparib, and to CDK inhibitors (THZ1 and LY2857785) (Figures 5D and 6A). Sensitivity to single-agent talazoparib was independent of BRCA status,26 and it was validated in ex vivo studies from cells harvested from multiple mice. Moreover, in these experiments, we confirmed sensitivity to decitabine27 in tumors with Trp53 mutations and wild-type Dnmt3a (Figure 6B). Thus, these results suggest that treatment approaches based on PARP inhibition, hypomethylating agents (decitabine), or a combination of the 2 compounds may be effective for high-risk AEL patients with TP53 mutations. This combinatorial approach has been shown to increase trapping of PARP by PARP inhibitors at DNA damage sites. This correlates with increased DNA damage, synergistic tumor cytotoxicity, blunting of self-renewal, and strong antitumor responses in BRCA wild-type cancer cells.28
![Ex vivo and in vivo sensitivity to checkpoint inhibitors and decitabine. (A) Activity of checkpoint/TP53 pathway inhibitors (n = 17) in human cell lines of AEL and NUP98-rearranged AML and in primary cells from the established mouse models of AEL, AML, and B/T-ALL. Cells were treated with increasing concentrations of the indicated compounds. Cell viability was determined after drug incubation by using CellTiter-Glo (Promega). Heatmap indicates area under the curve (AUC) values for each compound per leukemia sample. The positive control drugs (bortezomib and panobinostat) are in bold. (B) Ex vivo sensitivity to decitabine and talazoparib as single agents or in combination in AEL primary cells from #4491 (upper panel) and serial passages of #4497 (lower panel) cells. Data are reported as percent control (dimethyl sulfoxide) and represented as mean ± standard deviation of 3 replicates. The half-maximal inhibitory concentration (values in square brackets) was evaluated by nonlinear regression analysis using GraphPad Prism (GraphPad Software). In vivo studies: AEL mouse models #4497 (C) and #4491 (D) were randomized to receive 0.5 mg/kg intravenous decitabine once daily on treatment days 1 to 5 every 28-day cycle; 0.1 mg/kg oral talazoparib days 1 to 5 and days 14 to 19 once daily; 0.1 mg/kg oral talazoparib days 1 to 5 and days 14 to 19 once daily plus 0.5 mg/kg intravenous decitabine [Dec + Tal] once daily days 1 to 5; and a talazoparib vehicle control group. Tumor burden was monitored by spleen size reduction and percentage of GFP+RFP+ in bone marrow (BM) and spleen samples (SPL) from moribund mice (#4497) (panel C) or by bioluminescent imaging (#4491) (panel D). In panel C, some mice were found dead (n = 3 in Dec + Tal; n = 1 in decitabine; n = 2 in talazoparib; and n = 2 in vehicle). From those, spleen was weighted when possible, but BM and SPL samples were not available for analysis by flow cytometry. (E) Kaplan-Meier analysis of animal survival. Survival comparison was analyzed by log-rank test. Adj., adjusted; Anova, analysis of variance; Checkp. i., checkpoint inhibitors; GFP, green fluorescent protein; RFP, red fluorescent protein.](https://ash.silverchair-cdn.com/ash/content_public/journal/blood/137/12/10.1182_blood.2020009103/1/m_bloodbld2020009103f6.png?Expires=1769104503&Signature=yHGG7V0mJ0KHkNvjX~0-fvtXo7aLpB8IZjCREFOGFuH0y3Z20WRKZBvCT88cSAJ9vyi4vYSLfhGG4njxCRsVcRnFSV39b7xalzKtRS4D~N0xhxZe7Q~co7UJHQ-KZsD57qnv0cQJkV7qvRT9eNbucZIt1JAHHgC76DKSUOvcawCXCY2X8Ed2VcqR0R~Npb9Yf7w5FFMnAKSg0vbYPvvE~wCjLPFmc4vknBeOqDuqHbFzPG07aQgPj8wa2LhSw8NpF3XwhsuJ41mQP5m4KwpViWWT~pPHjfWMNnHxrdeDaUoUEdpDeRGzlfzc9BP2ekZVq195Wn6HQHh2VuBcwvRXOw__&Key-Pair-Id=APKAIE5G5CRDK6RD3PGA)
Ex vivo and in vivo sensitivity to checkpoint inhibitors and decitabine. (A) Activity of checkpoint/TP53 pathway inhibitors (n = 17) in human cell lines of AEL and NUP98-rearranged AML and in primary cells from the established mouse models of AEL, AML, and B/T-ALL. Cells were treated with increasing concentrations of the indicated compounds. Cell viability was determined after drug incubation by using CellTiter-Glo (Promega). Heatmap indicates area under the curve (AUC) values for each compound per leukemia sample. The positive control drugs (bortezomib and panobinostat) are in bold. (B) Ex vivo sensitivity to decitabine and talazoparib as single agents or in combination in AEL primary cells from #4491 (upper panel) and serial passages of #4497 (lower panel) cells. Data are reported as percent control (dimethyl sulfoxide) and represented as mean ± standard deviation of 3 replicates. The half-maximal inhibitory concentration (values in square brackets) was evaluated by nonlinear regression analysis using GraphPad Prism (GraphPad Software). In vivo studies: AEL mouse models #4497 (C) and #4491 (D) were randomized to receive 0.5 mg/kg intravenous decitabine once daily on treatment days 1 to 5 every 28-day cycle; 0.1 mg/kg oral talazoparib days 1 to 5 and days 14 to 19 once daily; 0.1 mg/kg oral talazoparib days 1 to 5 and days 14 to 19 once daily plus 0.5 mg/kg intravenous decitabine [Dec + Tal] once daily days 1 to 5; and a talazoparib vehicle control group. Tumor burden was monitored by spleen size reduction and percentage of GFP+RFP+ in bone marrow (BM) and spleen samples (SPL) from moribund mice (#4497) (panel C) or by bioluminescent imaging (#4491) (panel D). In panel C, some mice were found dead (n = 3 in Dec + Tal; n = 1 in decitabine; n = 2 in talazoparib; and n = 2 in vehicle). From those, spleen was weighted when possible, but BM and SPL samples were not available for analysis by flow cytometry. (E) Kaplan-Meier analysis of animal survival. Survival comparison was analyzed by log-rank test. Adj., adjusted; Anova, analysis of variance; Checkp. i., checkpoint inhibitors; GFP, green fluorescent protein; RFP, red fluorescent protein.
Ex vivo and in vivo sensitivity to checkpoint inhibitors and decitabine. (A) Activity of checkpoint/TP53 pathway inhibitors (n = 17) in human cell lines of AEL and NUP98-rearranged AML and in primary cells from the established mouse models of AEL, AML, and B/T-ALL. Cells were treated with increasing concentrations of the indicated compounds. Cell viability was determined after drug incubation by using CellTiter-Glo (Promega). Heatmap indicates area under the curve (AUC) values for each compound per leukemia sample. The positive control drugs (bortezomib and panobinostat) are in bold. (B) Ex vivo sensitivity to decitabine and talazoparib as single agents or in combination in AEL primary cells from #4491 (upper panel) and serial passages of #4497 (lower panel) cells. Data are reported as percent control (dimethyl sulfoxide) and represented as mean ± standard deviation of 3 replicates. The half-maximal inhibitory concentration (values in square brackets) was evaluated by nonlinear regression analysis using GraphPad Prism (GraphPad Software). In vivo studies: AEL mouse models #4497 (C) and #4491 (D) were randomized to receive 0.5 mg/kg intravenous decitabine once daily on treatment days 1 to 5 every 28-day cycle; 0.1 mg/kg oral talazoparib days 1 to 5 and days 14 to 19 once daily; 0.1 mg/kg oral talazoparib days 1 to 5 and days 14 to 19 once daily plus 0.5 mg/kg intravenous decitabine [Dec + Tal] once daily days 1 to 5; and a talazoparib vehicle control group. Tumor burden was monitored by spleen size reduction and percentage of GFP+RFP+ in bone marrow (BM) and spleen samples (SPL) from moribund mice (#4497) (panel C) or by bioluminescent imaging (#4491) (panel D). In panel C, some mice were found dead (n = 3 in Dec + Tal; n = 1 in decitabine; n = 2 in talazoparib; and n = 2 in vehicle). From those, spleen was weighted when possible, but BM and SPL samples were not available for analysis by flow cytometry. (E) Kaplan-Meier analysis of animal survival. Survival comparison was analyzed by log-rank test. Adj., adjusted; Anova, analysis of variance; Checkp. i., checkpoint inhibitors; GFP, green fluorescent protein; RFP, red fluorescent protein.
Based on ex vivo drug screening results, we tested sensitivity to these compounds in 3 engineered AEL models harboring a combination of mutations in Trp53 and Bcor (#4491, #4497) or Trp53, Bcor, and Rb1 (#588). Tumors with Trp53 and Bcor mutations but wild-type Rb1 (#4491 and #4497) were sensitive to single-agent decitabine. Spleen size was lower in the decitabine arm or in the decitabine plus talazoparib group compared with untreated mice or mice treated with talazoparib (Figure 6C-D). However, this finding did not translate into improved survival (Figure 6E) due to hematopoietic toxicity and sepsis in mice treated with the combination regimen. In contrast, only a transient toxicity was observed in non–tumor-bearing mice (supplemental Figure 16A-D). Trp53, Bcor, and Rb1 triple-mutant tumors were also sensitive to combinatorial treatment but not to either single agent (supplemental Figure 16E-G). A limitation of this study was the lack of human AEL xenografts for validation of preclinical models. These are exceedingly difficult to establish and propagate, but here we performed preclinical studies in human TP53-mutated AEL cell line–derived xenografts that mirrored the results in the engineered models (supplemental Figure 17).
Discussion
AEL is characterized by distinct genetic subgroups with mostly mutations in TP53, epigenetic regulators, transcription factors, and signaling genes.8,10 Here we described the utility of multiplex genome editing of primary mouse HSPCs and transplant assay to engineer in vivo mouse models of AEL that faithfully recapitulate the immunophenotype, genotype, and gene expression of the human disease. We used a comprehensive approach to examine correlation of genetic alterations with leukemia phenotype, methylation state, and expression deregulation and found that mutations in Bcor and Trp53 strongly promote erythroid leukemia. This striking association of TP53 and BCOR alterations in leukemia has been recently shown in human AML in patients with TP53 mutations and complex/monosomal karyotype, of which 19% had cooccurrent BCOR mutations.29 We observed instead development of T-cell lymphoma when only the TP53 gene was mutated.10 Recently, mice lacking Bcor exhibited an expansion of myeloid and megakaryocytic–erythroid progenitors, resulting in macrocytic anemia and thrombocytosis, but no features of overt acute leukemia were observed.9 This finding suggests that mutation of TP53 or BCOR alone is insufficient to promote AEL. Here, we found that mutations in both Trp53 and Bcor and in additional genes (eg, signaling genes and epigenetic modifiers) are associated with fully penetrant AEL. The requirement for comutation with BCOR to promote leukemia is supported by the observation that Bcor/Dnmt3a comutation is associated with AEL.9
Differentiation of HSCs in myeloid and lymphoid progenitors is finely regulated by transcriptional and epigenetically processes. In HSCs, hypermethylation induced by Tet2 inactivation leads to myelomonocytic lineage skewing, whereas Dnmt3a knockout-induced hypomethylation results in opposite erythroid-biased skews through differences in CpG density of DNA-binding motifs of cell fate–specific transcription factors.30 However, how alterations in DNA methylation modifiers cooperate with additional lesions to promote leukemogenesis has not been previously investigated. Here, distinct expression and methylation status of key lineage-driving transcription factors correlated with genome editing–induced genotypes. AEL tumors with a combination of mutations in Trp53, Bcor, and Dnmt3a showed hypomethylation of transcription factor genes required for erythroid differentiation with overexpression of Gata1, Gata2, Klf1, Tal1, and Epor, the centrality of which in AEL was shown by cross-species network analysis. Inactivation of genes commonly involved in clonal hematopoiesis of indeterminate potential (Dnmt3a, Asxl1, and Tet2)31-34 only induced leukemogenesis if combined with Trp53 and Bcor mutations. This is consistent with genomic data in human adult AEL,10 in which mutations in Dnmt3a are only identified in association with other mutations, most commonly TP53.
Using genomic analyses of multiple tumor stages to dissect mutational cooccurrence and sequence of acquisition at the single-cell level, we showed that not only the founder, editing-induced mutations but also subsequently acquired mutations in signaling genes (eg, Ptpn11, cKit, Kras, Csfr1), DNA repair, or tumor suppression promote clonal fitness and genesis of the fully fledged leukemic phenotype. We previously described that mutations in signaling pathways cooccur with TP53 mutations in 15% of human AEL and are generally secondary events acquired during leukemia expansion.10,35,36 Notably, mutation hotspots in mice were similar to those observed in human leukemias, supporting the notion that these mutations are required for erythroid leukemia expansion. The erythroid phenotype may be initiated either by strong mutations that provide advantages to erythroid-restricted progenitors or it may originate from mutations in multipotent progenitors with a subsequent epigenetic drift toward the erythroid lineage.8 In this study, unbiased genome editing of HSPCs suggests that induced lesions have a major role in priming epigenetic ground state and transcriptional networks toward erythroid transformation.
By high-throughput therapeutic screening, we described sensitivity to CDK7/CDK9 inhibition for AEL models with mutations in Trp53, Bcor, and Dnmt3a or in those driven by mutations in Trp53, Bcor, Nfix, and Rb1. CDK9 is important for several biological processes, including cell differentiation, by regulating cell cycle progression and gene transcription via elongation and messenger RNA maturation.37 CDK9 inhibition has been shown to downregulate cell survival genes such as MCL-1 and MYC in AML.38 Subtypes of AEL tumors with Trp53 mutations in the absence of Dnmt3a showed high sensitivity to PARP inhibition, which was confirmed in vivo when combined with decitabine. Decitabine or other DNMT inhibitors enhance cytotoxic effects by increasing the presence and retention of PARP1 and DNMT1 at DNA damage sites.28 Clinical trials are currently ongoing to investigate sensitivity to talazoparib alone for cohesin-mutated AML and MDS with excess blasts (#NCT03974217) or in combination with decitabine (#NCT02878785) in untreated AML and relapsed or refractory AML, or with gemtuzumab ozogamicin (#NCT04207190) for the treatment of CD33+ relapsed or refractory AML.
In summary, we have shown that combinations of comutations of Trp53, Bcor, Dnmt3a, Rb1, and Nfix result in establishment of AEL that recapitulates the genomic features of human leukemia, with deregulation of aberrantly methylated putative driver genes of AEL. Preclinical studies using these mouse models and human cell lines identified novel therapeutic vulnerabilities that are not solely associated with leukemia lineage but are dependent on leukemia genotype.
RNA-sequencing and methyl-sequencing data have been deposited in the Gene Expression Omnibus (accession numbers GSE147265 and GSE147343). Exome-sequencing data were submitted to Sequence Read Archive under accession code PRJNA613663.
The online version of this article contains a data supplement.
The publication costs of this article were defrayed in part by page charge payment. Therefore, and solely to indicate this fact, this article is hereby marked “advertisement” in accordance with 18 USC section 1734.
Acknowledgments
The authors thank the Animal Resources Center and the Small Animal Imaging Center, the Compound Management Center and the Department of Chemical Biology & Therapeutics, the Genome Sequencing Facility of the Hartwell Center for Bioinformatics and Biotechnology, the Flow Cytometry and Cell Sorting core facility (R. Ashmun, S. Woolard, P. Scott, J. Laxton, and A. House), and the Cytogenetics core facility of St Jude Children’s Research Hospital. They also thank S. Chen and Takara Bio USA for their technical support with the ICELL8 experiment and S. Wang and Mission Bio for their technical support in designing the mouse CRISPR custom panel.
This work was supported in part by the American Lebanese Syrian Associated Charities of St Jude Children’s Research Hospital, a St Jude Children’s Research Hospital Collaborative Research Consortium on Chromatin Regulation in Pediatric Cancer, a Leukemia and Lymphoma Society Translational Research Program (C.G.M.), a St Baldrick’s Foundation Robert J. Arceci Innovation Award (C.G.M.), the Henry Schueler 41 & 9 Foundation (C.G.M.), a Lady Tata Memorial Trust Award (I.I.), St Jude Children’s Research Hospital Hematological Malignancies Program Garwood Fellowship (I.I.), Italian Scientists and Scholars in North America Foundation (I.I.), a National Institutes of Health (NIH), National Cancer Institute Outstanding Investigator Award (R35 CA197695, C.G.M.), a St Jude Summer Plus Fellowship, Rhodes College (J.D.F. and S.M.M.), NIH, National Cancer Institute (R25 CA23944, St Jude Pediatric Oncology Education program, E.S.H., N.G., and G.E.H.), NIH Cancer Center Support Grant (P30 CA21765, C.G.M.), T32 HL116324 (A.S.S.), and the Howard Hughes Medical Institute (B.L.E.).
The content is solely the responsibility of the authors and does not necessarily represent the official views of the NIH.
Authorship
Contribution: I.I. designed the study, coordinated and performed experiments, analyzed and interpreted data, and wrote the manuscript; C.Q. analyzed genomic data and contributed to data interpretation and manuscript writing; E.V. performed mouse experiments and analyzed data; L.J.J. performed histopathology analyses; X.Y. and J.Y. performed NetBID analysis; A. Seth, A. Shelat, B.B.F., Y.W., and H.J. contributed to ex vivo and in vivo preclinical studies; J.D.F., R.F., K.M.D., D.P.-T., S.M.M., E.S.H., N.G., and G.E.H. performed experiments; J.A.K., A.S.S., R.Z., R.C.L., and B.L.E. contributed to gRNA design and cloning, study design, and data analysis; C.G.M. oversaw the study and cowrote the manuscript; and all authors read and approved the final version of the manuscript.
Conflict-of-interest disclosure: C.G.M. reports funded research from AbbVie, Loxo Oncology, and Pfizer; speaking and travel fees from Illumina and Amgen; and stock in Amgen. I.I. reports honoraria from Amgen. B.L.E. has received research funding from Celgene and Deerfield; he serves on the scientific advisory boards for Skyhawk Therapeutics, Exo Therapeutics, and Neomorph Therapeutics, none of which are directly related to the content of this paper. The remaining authors declare no competing financial interests.
Correspondence: Charles G. Mullighan, St Jude Children’s Research Hospital, 262 Danny Thomas Place, Mail Stop 342, Memphis, TN 38105; e-mail: charles.mullighan@stjude.org.
